


 |
市場調查報告書
商品編碼
1699252
全像顯示器市場機會、成長動力、產業趨勢分析及 2025-2034 年預測Holographic Display Market Opportunity, Growth Drivers, Industry Trend Analysis, and Forecast 2025-2034 |
||||||
2024 年全球全像顯示市場價值為 34 億美元,預計 2025 年至 2034 年期間的複合年成長率將達到 25.2%。娛樂、醫療保健、汽車和教育等行業對 3D 視覺化的需求不斷成長,推動市場成長。這些顯示器透過沉浸式視覺效果增強了使用者體驗,無需額外的配件。高解析度成像和人工智慧驅動的內容等技術進步正在進一步加速其應用。對下一代全像投影系統和互動式 AR/VR 相容平台的投資正在擴大遊戲、現場活動和數位廣告中的應用。此外,對非接觸式控制、即時 3D 渲染和增強互動功能的需求正在推動市場擴張。醫學影像、汽車平視顯示器和工程視覺化領域對這些顯示器的日益青睞正在創造巨大的機會。隨著各行各業尋求更先進、更具互動性的顯示解決方案,全像技術正在成為下一代數位體驗的重要組成部分。
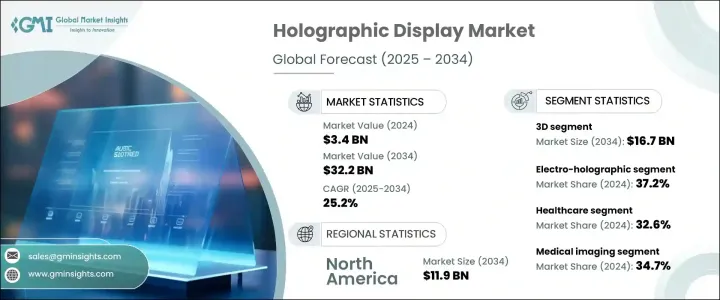
從維度來看,市場分為2D、3D、4D。隨著各行各業擴大採用沉浸式顯示技術進行互動,預計到 2034 年 3D 領域將創造 167 億美元的收入。 3D 全像顯示器能夠提供多角度視圖和即時處理數位內容,這推動了其需求,尤其是在零售、醫療保健和遊戲領域。
| 市場範圍 | |
|---|---|
| 起始年份 | 2024 |
| 預測年份 | 2025-2034 |
| 起始值 | 34億美元 |
| 預測值 | 322億美元 |
| 複合年成長率 | 25.2% |
根據技術,市場分為電子全像、觸控、雷射和活塞。 2024 年,電子全像技術佔據了 37.2% 的市場。該技術因其無需實體螢幕即可產生高解析度 3D 影像的能力而越來越受歡迎,使其適用於醫療保健和汽車等多個行業的應用。
就產業垂直而言,市場分為零售、消費性電子、醫療保健、娛樂和媒體以及航太和國防。醫療保健產業引領市場,2024 年的收入佔有率為 32.6%。全像顯示器擴大應用於醫療程序,協助外科醫生進行術前和術中規劃。這些顯示器提供器官、血管和腫瘤的詳細 3D 視覺化,提高手術精確度和患者治療效果。由於它們能夠增強深度感知並降低手術風險,因此它們在神經外科、骨科手術和心血管手術中的應用正在擴大。
根據應用,市場分為相機、數位看板、醫學影像、 CT 和 MRI、智慧電視、筆記型電腦等。醫學影像成為主導應用,到 2024 年佔據了 34.7% 的市場。全像顯示器增強了 CT 和 MRI 掃描,提供更清晰的 3D 視圖,有助於診斷和治療計劃。隨著醫療保健提供者尋求提高患者護理的準確性,對高精度成像解決方案的需求正在上升。
從地區來看,預計到 2034 年北美的市場規模將達到 119 億美元,這得益於汽車、航太和娛樂產業應用的不斷增加。 2024 年,美國市場規模將超過 9 億美元,消費性電子產品、AR/VR 應用和數位廣告的投資不斷成長,推動了全像顯示技術的進步。
目錄
第1章:方法論與範圍
第2章:執行摘要
第3章:行業洞察
- 產業生態系統分析
- 產業衝擊力
- 成長動力
- 3D全像顯示器需求不斷成長
- 擴增實境 (AR) 和虛擬實境 (VR) 的採用率不斷提高
- 醫療領域對醫學影像的應用日益廣泛
- 全像展示在遊戲和娛樂領域越來越受歡迎
- 全像顯示器在數位看板和零售領域的應用日益增多
- 產業陷阱與挑戰
- 生產和實施成本高
- 有限的內容和軟體相容性
- 成長動力
- 成長潛力分析
- 監管格局
- 技術格局
- 未來市場趨勢
- 波特的分析
- PESTEL分析
第4章:競爭格局
- 介紹
- 公司市佔率分析
- 主要市場參與者的競爭分析
- 競爭定位矩陣
- 策略儀表板
第5章:市場估計與預測:按技術,2021 年至 2034 年
- 主要趨勢
- 電子全像
- 可觸摸
- 雷射
- 活塞
第6章:市場估計與預測:依維度,2021 年至 2034 年
- 主要趨勢
- 2D
- 3D
- 4D
第7章:市場估計與預測:按應用,2021 年至 2034 年
- 主要趨勢
- 相機
- 數位看板
- 醫學影像
- 智慧電視
- 筆記型電腦
- 其他
第8章:市場估計與預測:按產業垂直,2021 年至 2034 年
- 主要趨勢
- 消費性電子產品
- 零售
- 衛生保健
- 娛樂和媒體
- 航太和國防
- 其他
第9章:市場估計與預測:按地區,2021 年至 2034 年
- 主要趨勢
- 北美洲
- 美國
- 加拿大
- 歐洲
- 德國
- 英國
- 法國
- 西班牙
- 義大利
- 荷蘭
- 亞太地區
- 中國
- 印度
- 日本
- 澳洲
- 韓國
- 拉丁美洲
- 巴西
- 墨西哥
- 阿根廷
- 中東和非洲
- 沙烏地阿拉伯
- 南非
- 阿拉伯聯合大公國
第10章:公司簡介
- EON Reality
- HoloTech Switzerland AG
- HYPERVSN
- Leia Display System
- Light Field Lab, Inc.
- Looking Glass
- MDH Hologram
- Musion IP Limited
- Nanjing DSeeLab Digital Technology Co.,Ltd.
- Realfiction
- REALFICTION
- RealView Imaging Ltd.
- SeeReal Technologies GmBH
- VividQ
- Voxon Photonics
The Global Holographic Display Market, valued at USD 3.4 billion in 2024, is set to expand at a 25.2% CAGR from 2025 to 2034. The increasing demand for 3D visualization in industries such as entertainment, healthcare, automotive, and education is fueling market growth. These displays enhance user experiences with immersive visuals, eliminating the need for additional accessories. Technological advancements, including high-resolution imaging and AI-driven content, are further accelerating adoption. Investments in next-generation holographic projection systems and interactive AR/VR-compatible platforms are expanding applications in gaming, live events, and digital advertising. Additionally, the demand for touchless controls, real-time 3D rendering, and enhanced interactive features is driving market expansion. The growing preference for these displays in medical imaging, automotive heads-up displays, and engineering visualization is creating significant opportunities. As industries seek more advanced and interactive display solutions, holographic technology is becoming a vital component of next-generation digital experiences.
By dimension, the market is divided into 2D, 3D, and 4D. The 3D segment is expected to generate USD 16.7 billion by 2034 as industries increasingly adopt immersive display technologies for interactive engagement. The ability of 3D holographic displays to offer multi-angle views and real-time manipulation of digital content is driving their demand, particularly in retail, healthcare, and gaming.
| Market Scope | |
|---|---|
| Start Year | 2024 |
| Forecast Year | 2025-2034 |
| Start Value | $3.4 Billion |
| Forecast Value | $32.2 Billion |
| CAGR | 25.2% |
Based on technology, the market is segmented into electro-holographic, touchable, laser, and piston. The electro-holographic segment accounted for 37.2% of the market share in 2024. This technology is gaining popularity due to its ability to produce high-resolution 3D images without requiring physical screens, making it suitable for applications in multiple industries, including healthcare and automotive.
In terms of industry verticals, the market is classified into retail, consumer electronics, healthcare, entertainment and media, and aerospace and defense. The healthcare sector led the market, holding a 32.6% revenue share in 2024. Holographic displays are increasingly used in medical procedures, assisting surgeons in preoperative and intraoperative planning. These displays provide detailed 3D visualizations of organs, blood vessels, and tumors, improving surgical precision and patient outcomes. Their application in neurosurgery, orthopedic procedures, and cardiovascular surgeries is expanding due to their ability to enhance depth perception and reduce surgical risks.
By application, the market is segmented into cameras, digital signage, medical imaging, CT & MRI, smart TVs, laptops, and others. Medical imaging emerged as the dominant application, securing a 34.7% market share in 2024. Holographic displays enhance CT and MRI scans, offering clearer 3D views that aid in diagnostics and treatment planning. The demand for high-precision imaging solutions is rising as healthcare providers seek improved accuracy in patient care.
Regionally, North America is projected to reach USD 11.9 billion by 2034, driven by increased adoption across automotive, aerospace, and entertainment industries. The U.S. market surpassed USD 900 million in 2024, with growing investments in consumer electronics, AR/VR applications, and digital advertising fueling advancements in holographic display technology.
Table of Contents
Chapter 1 Methodology and Scope
- 1.1 Market scope and definitions
- 1.2 Research design
- 1.2.1 Research approach
- 1.2.2 Data collection methods
- 1.3 Base estimates and calculations
- 1.3.1 Base year calculation
- 1.3.2 Key trends for market estimation
- 1.4 Forecast model
- 1.5 Primary research and validation
- 1.5.1 Primary sources
- 1.5.2 Data mining sources
Chapter 2 Executive Summary
- 2.1 Industry 360° synopsis
Chapter 3 Industry Insights
- 3.1 Industry ecosystem analysis
- 3.2 Industry impact forces
- 3.2.1 Growth drivers
- 3.2.1.1 Rising demand for 3D holographic displays
- 3.2.1.2 Increasing adoption in augmented reality (AR) and virtual reality (VR)
- 3.2.1.3 Growing adoption in healthcare for medical imaging
- 3.2.1.4 Growing popularity of holographic displays in gaming and entertainment
- 3.2.1.5 Rising adoption of holographic displays in digital signage and retail
- 3.2.2 Industry pitfalls and challenges
- 3.2.2.1 High production and implementation costs
- 3.2.2.2 Limited content and software compatibility
- 3.2.1 Growth drivers
- 3.3 Growth potential analysis
- 3.4 Regulatory landscape
- 3.5 Technology landscape
- 3.6 Future market trends
- 3.7 Porter's analysis
- 3.8 PESTEL analysis
Chapter 4 Competitive Landscape, 2024
- 4.1 Introduction
- 4.2 Company market share analysis
- 4.3 Competitive analysis of major market players
- 4.4 Competitive positioning matrix
- 4.5 Strategy dashboard
Chapter 5 Market Estimates and Forecast, By Technology, 2021 – 2034 (USD Bn)
- 5.1 Key trends
- 5.2 Electro-holographic
- 5.3 Touchable
- 5.4 Laser
- 5.5 Piston
Chapter 6 Market Estimates and Forecast, By Dimension, 2021 – 2034 (USD Bn)
- 6.1 Key trends
- 6.2 2D
- 6.3 3D
- 6.4 4D
Chapter 7 Market Estimates and Forecast, By Application, 2021 – 2034 (USD Bn)
- 7.1 Key trends
- 7.2 Camera
- 7.3 Digital signage
- 7.4 Medical imaging
- 7.5 Smart TV
- 7.6 Laptops
- 7.7 Others
Chapter 8 Market Estimates and Forecast, By Industry Vertical, 2021 – 2034 (USD Bn)
- 8.1 Key trends
- 8.2 Consumer electronics
- 8.3 Retail
- 8.4 Healthcare
- 8.5 Entertainment and media
- 8.6 Aerospace and defense
- 8.7 Others
Chapter 9 Market Estimates and Forecast, By Region, 2021 – 2034 (USD Bn)
- 9.1 Key trends
- 9.2 North America
- 9.2.1 U.S.
- 9.2.2 Canada
- 9.3 Europe
- 9.3.1 Germany
- 9.3.2 UK
- 9.3.3 France
- 9.3.4 Spain
- 9.3.5 Italy
- 9.3.6 Netherlands
- 9.4 Asia Pacific
- 9.4.1 China
- 9.4.2 India
- 9.4.3 Japan
- 9.4.4 Australia
- 9.4.5 South Korea
- 9.5 Latin America
- 9.5.1 Brazil
- 9.5.2 Mexico
- 9.5.3 Argentina
- 9.6 Middle East and Africa
- 9.6.1 Saudi Arabia
- 9.6.2 South Africa
- 9.6.3 UAE
Chapter 10 Company Profiles
- 10.1 EON Reality
- 10.2 HoloTech Switzerland AG
- 10.3 HYPERVSN
- 10.4 Leia Display System
- 10.5 Light Field Lab, Inc.
- 10.6 Looking Glass
- 10.7 MDH Hologram
- 10.8 Musion IP Limited
- 10.9 Nanjing DSeeLab Digital Technology Co.,Ltd.
- 10.10 Realfiction
- 10.11 REALFICTION
- 10.12 RealView Imaging Ltd.
- 10.13 SeeReal Technologies GmBH
- 10.14 VividQ
- 10.15 Voxon Photonics
 2025年3D全像全球市場報告2025年全像顯示器市場報告2025年全球可觸摸全像顯示市場報告
 全像顯示:市場佔有率分析、產業趨勢/統計、成長預測(2025-2030)
 全像顯示市場:按產品、技術和應用分類 - 2025-2030 年全球預測汽車全全像顯示市場:按顯示類型、技術分類 - 2025-2030 年全球預測2024-2032 年按組件、技術、尺寸、應用、最終用戶和地區分類的全像顯示市場報告
 到 2030 年全像市場預測:按產品類型、組件、技術、尺寸、最終用戶和地區進行的全球分析
 全球全像顯示市場:產業分析、規模、佔有率、成長、趨勢、預測(2024-2031)全像顯示市場 - 全球產業規模、佔有率、趨勢、機會和預測,按產品類型、技術、最終用戶、地區、競爭細分,2019-2029F