

 |
市場調查報告書
商品編碼
1699272
電線電纜市場機會、成長動力、產業趨勢分析及2025-2034年預測Wire and Cable Market Opportunity, Growth Drivers, Industry Trend Analysis, and Forecast 2025-2034 |
||||||
全球電線電纜市場穩步擴張,2024 年將達到 2,678 億美元,預計 2025 年至 2034 年的複合年成長率為 7.3%。這一成長主要得益於對輸配電網路現代化和擴建的持續投資,以滿足全球不斷成長的電力需求。不斷加快的城市化和政府主導的智慧城市計畫進一步擴大了對可靠電力基礎設施的需求。再生能源整合的推動加速了向更清潔能源的轉變,需要先進的佈線解決方案來確保高效的電網連接。
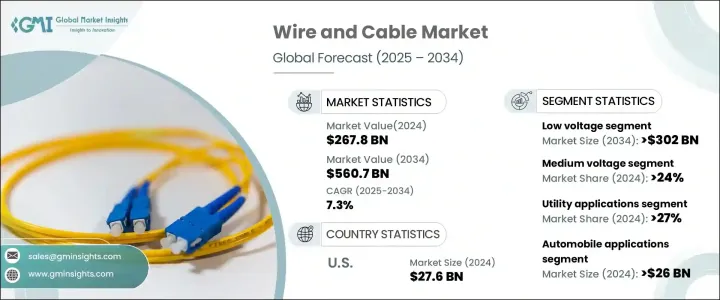
同時,地緣政治挑戰和供應鏈中斷導致國內產量激增,減少了對進口的依賴,並增強了本地製造能力。這種轉變透過簡化物流和解決原料供應缺口來支持基礎設施發展,最終推動產業成長。住宅、商業和工業應用對阻燃、高性能電纜的需求不斷成長也促進了市場擴張。該產業估值在 2022 年為 2,160 億美元,2023 年為 2,403 億美元,2024 年為 2,678 億美元,反映出多個產業的強勁需求。
| 市場範圍 | |
|---|---|
| 起始年份 | 2024 |
| 預測年份 | 2025-2034 |
| 起始值 | 2678億美元 |
| 預測值 | 5607億美元 |
| 複合年成長率 | 7.3% |
市場按電壓等級分類,包括高壓、中壓和低壓部分。受住宅和商業開發的巨大需求推動,低壓電線電纜產業預計到 2034 年將超過 3,020 億美元。這些行業正在快速發展,對安全且高效的佈線解決方案的需求不斷增加。隨著大量資金用於改善配電網路,不斷擴大的數位和智慧電網計劃進一步刺激了需求。這些項目的投資加強了先進佈線系統的必要性,確保了穩定且有效率的電力供應。
該行業還根據應用進行細分,涵蓋公用事業、物料搬運、物流、汽車、鐵路、消費性電子和建築基礎設施等廣泛領域。實用程式應用程式在 2024 年佔據了超過 27% 的市場佔有率,預計還會進一步擴大。向再生能源發電(特別是透過太陽能和風能)的轉變,提高了對耐用、高效能電力電纜的需求,以促進無縫電網整合。這種轉變持續影響著產業的發展軌跡,推動了對專業佈線解決方案的長期需求。
美國市場一直保持持續成長勢頭,2022 年估值為 239 億美元,2023 年為 256 億美元,2024 年為 276 億美元。這一趨勢得益於美國建築業投資的不斷增加,2024 年該行業的月支出將超過 2 兆美元。智慧電氣系統和永續建築實踐的日益普及進一步影響了對先進電線電纜產品的需求,從而增強了該行業未來幾年的樂觀前景。
目錄
第1章:方法論與範圍
- 市場定義
- 基礎估算與計算
- 預測計算
- 資料來源
- 基本的
- 次要
- 有薪資的
- 民眾
第2章:執行摘要
第3章:行業洞察
- 產業生態系統分析
- 監管格局
- 產業衝擊力
- 成長動力
- 產業陷阱與挑戰
- 成長潛力分析
- 波特的分析
- PESTEL分析
第4章:競爭格局
- 戰略儀表板
- 創新與技術格局
第5章:市場規模及預測:依產品,2021 年至 2034 年
- 主要趨勢
- 同軸電纜/電子線
- 光纖電纜
- 電源線
- 訊號和控制電纜
- 電信和資料電纜
第6章:市場規模及預測:按電壓,2021 年至 2034 年
- 主要趨勢
- 低的
- 中等的
- 高的
第7章:市場規模及預測:依應用,2021 年至 2034 年
- 主要趨勢
- 食品和飲料
- 汽車
- 物料搬運/物流
- 娛樂/休閒
- 公用事業
- 鐵路
- 消費性電子產品
- 建設基礎設施
- 其他
第8章:市場規模及預測:按地區,2021 年至 2034 年
- 主要趨勢
- 北美洲
- 美國
- 加拿大
- 墨西哥
- 歐洲
- 英國
- 法國
- 荷蘭
- 義大利
- 西班牙
- 瑞典
- 丹麥
- 比利時
- 德國
- 俄羅斯
- 亞太地區
- 中國
- 印度
- 日本
- 韓國
- 澳洲
- 印尼
- 菲律賓
- 紐西蘭
- 馬來西亞
- 泰國
- 中東和非洲
- 沙烏地阿拉伯
- 阿拉伯聯合大公國
- 伊拉克
- 科威特
- 卡達
- 南非
- 埃及
- 奈及利亞
- 拉丁美洲
- 巴西
- 阿根廷
- 秘魯
第9章:公司簡介
- alfanar Group
- Bahra Cables
- BELDEN
- Brugg Kabel AG
- Ducab
- Elsewedy Electric
- Federal Cables
- Fujikura
- HELUKABEL MiddleEast
- Jeddah Cables
- KEI Industries
- Midal Cables
- Naficon
- Nexans
- NIBE Industrier AB
- NKT A/S
- Power Plus Cables
- Prysmian Group
- Riyadh Cables
- Saudi Cable Company
- Sumitomo Electric Industries
- ZTT
The Global Wire And Cable Market has experienced steady expansion, reaching USD 267.8 billion in 2024, with projections indicating a 7.3% CAGR from 2025 to 2034. This growth is largely driven by the continuous investment in modernizing and expanding transmission and distribution networks to meet the rising electricity demand worldwide. Increasing urbanization and government-led smart city projects are further amplifying the need for reliable electrical infrastructure. The push for renewable energy integration has accelerated the transition to cleaner power sources, requiring advanced cabling solutions to ensure efficient grid connectivity.
Meanwhile, geopolitical challenges and supply chain disruptions have led to a surge in domestic production, reducing reliance on imports and strengthening local manufacturing capabilities. This shift supports infrastructure development by streamlining logistics and addressing raw material supply gaps, ultimately propelling industry growth. Rising demand for fire-retardant, high-performance cables across residential, commercial, and industrial applications has also contributed to market expansion. The industry's valuation stood at USD 216 billion in 2022, USD 240.3 billion in 2023, and USD 267.8 billion in 2024, reflecting strong demand across multiple sectors.
| Market Scope | |
|---|---|
| Start Year | 2024 |
| Forecast Year | 2025-2034 |
| Start Value | $267.8 Billion |
| Forecast Value | $560.7 Billion |
| CAGR | 7.3% |
The market is categorized by voltage levels, including high, medium, and low voltage segments. The low-voltage wire and cable sector is projected to exceed USD 302 billion by 2034, driven by significant demand from residential and commercial developments. These industries are growing at a rapid pace, fueling the need for safe and efficient wiring solutions. Expanding digital and smart grid initiatives are further boosting demand, as large-scale funding is directed toward improving power distribution networks. Investments in these projects reinforce the necessity for advanced wiring systems, ensuring a stable and efficient electricity supply.
The industry is also segmented based on applications, covering a wide range of sectors, including utilities, material handling, logistics, automotive, railways, consumer electronics, and building infrastructure. Utility applications accounted for over 27% of the market share in 2024 and are expected to see further expansion. The transition towards renewable power generation, particularly through solar and wind energy, has heightened the need for durable and efficient power cables to facilitate seamless grid integration. This shift continues to shape the industry's trajectory, driving long-term demand for specialized wiring solutions.
The U.S. market has demonstrated consistent growth, with valuations of USD 23.9 billion in 2022, USD 25.6 billion in 2023, and USD 27.6 billion in 2024. This trend is supported by increasing investments in the country's construction sector, where monthly expenditures surpassed USD 2 trillion in 2024. The rising adoption of smart electrical systems and sustainable building practices is further influencing the demand for advanced wire and cable products, reinforcing the sector's positive outlook in the coming years.
Table of Contents
Chapter 1 Methodology & Scope
- 1.1 Market definitions
- 1.2 Base estimates & calculations
- 1.3 Forecast calculation
- 1.4 Data sources
- 1.4.1 Primary
- 1.4.2 Secondary
- 1.4.2.1 Paid
- 1.4.2.2 Public
Chapter 2 Executive Summary
- 2.1 Industry synopsis, 2021 - 2034
Chapter 3 Industry Insights
- 3.1 Industry ecosystem analysis
- 3.2 Regulatory landscape
- 3.3 Industry impact forces
- 3.3.1 Growth drivers
- 3.3.2 Industry pitfalls & challenges
- 3.4 Growth potential analysis
- 3.5 Porter's analysis
- 3.5.1 Bargaining power of suppliers
- 3.5.2 Bargaining power of buyers
- 3.5.3 Threat of new entrants
- 3.5.4 Threat of substitutes
- 3.6 PESTEL analysis
Chapter 4 Competitive landscape, 2024
- 4.1 Strategic dashboard
- 4.2 Innovation & technology landscape
Chapter 5 Market Size and Forecast, By Product, 2021 – 2034 (USD Million)
- 5.1 Key trends
- 5.2 Coaxial cables/electronic wires
- 5.3 Fiber optics cables
- 5.4 Power cables
- 5.5 Signal & control cable
- 5.6 Telecom & data cables
Chapter 6 Market Size and Forecast, By Voltage, 2021 – 2034 (USD Million)
- 6.1 Key trends
- 6.2 Low
- 6.3 Medium
- 6.4 High
Chapter 7 Market Size and Forecast, By Application, 2021 – 2034 (USD Million)
- 7.1 Key trends
- 7.2 Food & beverages
- 7.3 Automotive
- 7.4 Material handling/logistics
- 7.5 Entertainment/leisure
- 7.6 Utilities
- 7.7 Railways
- 7.8 Consumer electronics
- 7.9 Building infrastructure
- 7.10 Others
Chapter 8 Market Size and Forecast, By Region, 2021 – 2034 (MWh & USD Million)
- 8.1 Key trends
- 8.2 North America
- 8.2.1 U.S.
- 8.2.2 Canada
- 8.2.3 Mexico
- 8.3 Europe
- 8.3.1 UK
- 8.3.2 France
- 8.3.3 Netherlands
- 8.3.4 Italy
- 8.3.5 Spain
- 8.3.6 Sweden
- 8.3.7 Denmark
- 8.3.8 Belgium
- 8.3.9 Germany
- 8.3.10 Russia
- 8.4 Asia Pacific
- 8.4.1 China
- 8.4.2 India
- 8.4.3 Japan
- 8.4.4 South Korea
- 8.4.5 Australia
- 8.4.6 Indonesia
- 8.4.7 Philippines
- 8.4.8 New Zealand
- 8.4.9 Malaysia
- 8.4.10 Thailand
- 8.5 Middle East & Africa
- 8.5.1 Saudi Arabia
- 8.5.2 UAE
- 8.5.3 Iraq
- 8.5.4 Kuwait
- 8.5.5 Qatar
- 8.5.6 South Africa
- 8.5.7 Egypt
- 8.5.8 Nigeria
- 8.6 Latin America
- 8.6.1 Brazil
- 8.6.2 Argentina
- 8.6.3 Peru
Chapter 9 Company Profiles
- 9.1 alfanar Group
- 9.2 Bahra Cables
- 9.3 BELDEN
- 9.4 Brugg Kabel AG
- 9.5 Ducab
- 9.6 Elsewedy Electric
- 9.7 Federal Cables
- 9.8 Fujikura
- 9.9 HELUKABEL MiddleEast
- 9.10 Jeddah Cables
- 9.11 KEI Industries
- 9.12 Midal Cables
- 9.13 Naficon
- 9.14 Nexans
- 9.15 NIBE Industrier AB
- 9.16 NKT A/S
- 9.17 Power Plus Cables
- 9.18 Prysmian Group
- 9.19 Riyadh Cables
- 9.20 Saudi Cable Company
- 9.21 Sumitomo Electric Industries
- 9.22 ZTT
 全球乾式電纜端接市場:市場規模、佔有率、趨勢分析(按安裝位置、電壓、應用和地區)、展望和未來預測(2024-2031 年)
 URD 電纜市場:按類型、按安裝類型、按電壓類型、按銷售管道、按應用 - 2025-2030 年全球預測
 全球電線電纜市場按產品類型、材料類型、電壓、安裝、最終用途行業和地區分類 - 預測至 2029 年
 SDI 電纜驅動器市場報告:2031 年趨勢、預測與競爭分析
 2025 年全球有線電視和其他訂閱節目市場報告
 商業電線電纜市場機會、成長動力、產業趨勢分析及2025-2034年預測
 2025 年全球電纜市場報告
 美國電線電纜市場規模、佔有率、趨勢分析報告:按電纜類型、應用和細分市場預測,2025-2030 年
 電線電纜市場規模、佔有率和成長分析(按電壓、最終用戶和地區)- 產業預測 2025-2032
 到 2030 年電梯扁平電纜市場預測:按類型、材料、電壓、應用和地區進行的全球分析