

 |
市場調查報告書
商品編碼
1699387
航空衍生燃氣渦輪機市場機會、成長動力、產業趨勢分析及 2025-2034 年預測Aeroderivative Gas Turbine Market Opportunity, Growth Drivers, Industry Trend Analysis, and Forecast 2025-2034 |
||||||
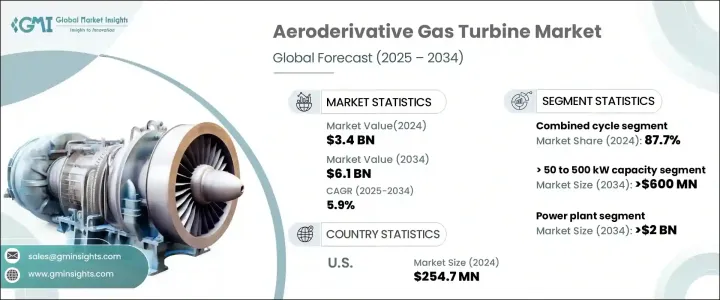
2024 年全球航空衍生型燃氣渦輪機市場規模達到 34 億美元,預計到 2034 年將達到 61 億美元,2025 年至 2034 年期間的複合年成長率為 5.9%。對能源效率標準的日益重視以及整合再生能源的轉變正在推動這些燃氣渦輪機的採用。天然氣分銷和開採的大量投資,加上全球能源消耗的不斷成長,正在促進市場的成長。此外,微電網基礎設施的擴張以及對降低大型火力發電廠資本成本的日益偏好預計將推動對這些渦輪機的需求。它們能夠在尖峰負載和備用電源情況下高效運行,並且具有較高的燃料靈活性和較短的啟動時間,因此非常適合電網電力和獨立電力系統。
數位孿生技術、人工智慧預測性維護以及渦輪機與再生能源的無縫整合等技術進步正在提高這些系統的性能和運行效率。人們對能源安全、成本效益和永續性的日益重視,為這些產品的普及創造了有利的商業環境。航空衍生型燃氣渦輪機具有快速啟動和可靠發電的能力,可提供多功能且可靠的能源解決方案,在競爭激烈且快速變化的市場中具有吸引力。
| 市場範圍 | |
|---|---|
| 起始年份 | 2024 |
| 預測年份 | 2025-2034 |
| 起始值 | 34億美元 |
| 預測值 | 61億美元 |
| 複合年成長率 | 5.9% |
市場按容量細分為<= 50 kW、> 50 至 500 kW、> 500 kW 至 1 MW、> 1 至 30 MW、> 30 至 70 MW 和 > 70 MW。預計到 2034 年,50 千瓦容量部分的複合年成長率將超過 6%。由於對分散式能源系統的需求不斷增加,該部分在偏遠地區和工業應用中越來越受歡迎,以確保電網連接有限地區的穩定電力供應。
根據技術,市場分為開式循環系統和聯合循環系統。受各產業對分散式發電日益關注的推動,開式循環部分將在 2024 年佔總收入的 12.3% 以上。渦輪機技術的不斷進步旨在提高燃油效率並遵守嚴格的排放標準,進一步加強了這一領域。同時,受益於全球向清潔能源替代品的轉變以及擺脫燃煤發電廠的趨勢,聯合循環領域將在 2024 年佔據市場主導地位,佔有 87.7% 的佔有率。
根據應用,市場細分為石油和天然氣、發電廠、加工廠、航空、海洋和其他領域。預計到 2034 年,發電廠部分的規模將超過 20 億美元,這得益於人們擴大轉向清潔能源解決方案,以及將燃氣渦輪機納入再生能源系統以提高電網穩定性。由於快速的工業擴張和嚴格的能源效率要求推動了強大發電系統的採用,預計到 2034 年,石油和天然氣行業的複合年成長率將超過 5.5%。
美國航空衍生型燃氣渦輪機市值在 2022 年為 2.679 億美元,2023 年為 2.381 億美元,2024 年為 2.547 億美元。從傳統發電廠向燃氣渦輪機技術的轉變正在推動產品採用,而對減少碳足跡和滿足嚴格環境標準的高度關注進一步推動了對這些高效渦輪機的需求。預計到 2034 年,北美市場的複合年成長率將超過 6%,這得益於不斷成長的工業活動和持續的技術創新,這些創新將提高營運效率並滿足對可靠電力解決方案日益成長的需求。
目錄
第1章:方法論與範圍
- 市場範圍和定義
- 市場估計和預測參數
- 預測計算
- 資料來源
- 基本的
- 次要
- 有薪資的
- 民眾
第2章:執行摘要
第3章:行業洞察
- 產業生態系統分析
- 監管格局
- 產業衝擊力
- 成長動力
- 產業陷阱與挑戰
- 成長潛力分析
- 波特的分析
- PESTEL 分析
第4章:競爭格局
- 介紹
- 戰略展望
- 創新與永續發展格局
第5章:市場規模及預測:依產能,2021 年至 2034 年
- 主要趨勢
- ≤ 50 千瓦
- > 50至500千瓦
- > 500 千瓦至 1 兆瓦
- > 1至30兆瓦
- > 30至70兆瓦
- > 70 兆瓦
第6章:市場規模及預測:依技術分類,2021 年至 2034 年
- 主要趨勢
- 開放式循環
- 複合循環
第7章:市場規模及預測:依應用,2021 年至 2034 年
- 主要趨勢
- 發電廠
- 石油和天然氣
- 加工廠
- 航空
- 海洋
- 其他
第8章:市場規模及預測:按地區,2021 年至 2034 年
- 主要趨勢
- 北美洲
- 美國
- 加拿大
- 墨西哥
- 歐洲
- 英國
- 法國
- 德國
- 俄羅斯
- 義大利
- 荷蘭
- 丹麥
- 波蘭
- 瑞典
- 亞太地區
- 中國
- 澳洲
- 日本
- 韓國
- 印尼
- 泰國
- 馬來西亞
- 中東和非洲
- 沙烏地阿拉伯
- 阿拉伯聯合大公國
- 卡達
- 阿曼
- 埃及
- 土耳其
- 伊拉克
- 南非
- 阿爾及利亞
- 拉丁美洲
- 巴西
- 阿根廷
- 智利
第9章:公司簡介
- Ansaldo Energia
- Baker Hughes Company
- Capstone Green Energy
- Collins Aerospace
- Destinus Energy
- Doosan Enerbility
- General Electric
- Harbin Electric
- Honeywell International
- IHI Corporation
- Kawasaki Heavy Industries
- MAN Energy Solutions
- Mitsubishi Heavy Industries
- Nanjing Turbine & Electric Machinery
- Pratt & Whitney
- Rolls-Royce
- Safran
- Siemens Energy
- Vericor
- Wartsila
The Global Aeroderivative Gas Turbine Market reached USD 3.4 billion in 2024 and is projected to reach USD 6.1 billion by 2034, reflecting a CAGR of 5.9% between 2025 and 2034. Increasing emphasis on energy efficiency standards and the shift toward integrating renewable energy sources are driving the adoption of these turbines. Extensive investments in natural gas distribution and extraction, coupled with rising global energy consumption, are contributing to market growth. Additionally, the expansion of microgrid infrastructure and the growing preference for reducing capital costs of large-scale thermal power plants are expected to fuel demand for these turbines. Their ability to operate efficiently during peak load and backup power scenarios, along with their high fuel flexibility and low startup times, makes them highly suitable for both grid power and independent power systems.
Technological advancements such as digital twin technology, AI-powered predictive maintenance, and the seamless integration of turbines with renewable energy sources are enhancing the performance and operational efficiency of these systems. The growing emphasis on energy security, cost-efficiency, and sustainability is creating a favorable business environment for the increased penetration of these products. With their ability to deliver quick startups and reliable power generation, aeroderivative gas turbines offer a versatile and dependable energy solution, making them appealing in competitive and rapidly changing markets.
| Market Scope | |
|---|---|
| Start Year | 2024 |
| Forecast Year | 2025-2034 |
| Start Value | $3.4 Billion |
| Forecast Value | $6.1 Billion |
| CAGR | 5.9% |
The market is segmented by capacity into <= 50 kW, > 50 to 500 kW, > 500 kW to 1 MW, > 1 to 30 MW, > 30 to 70 MW, and > 70 MW. The 50 kW capacity segment is expected to witness a CAGR of over 6% through 2034. This segment is gaining traction in remote areas and industrial applications due to the increasing need for decentralized energy systems, ensuring stable power supply in areas with limited grid connectivity.
By technology, the market is divided into open cycle and combined cycle systems. The open cycle segment accounted for over 12.3% of total revenue in 2024, driven by the rising focus on decentralized power generation across industries. Ongoing advancements in turbine technology aimed at improving fuel efficiency and adhering to stringent emission norms are further strengthening this segment. Meanwhile, the combined cycle segment dominated the market with an 87.7% share in 2024, benefiting from the global shift toward cleaner energy alternatives and the transition away from coal-fired power plants.
Based on application, the market is segmented into oil and gas, power plants, process plants, aviation, marine, and other sectors. The power plant segment is projected to surpass USD 2 billion by 2034, driven by the increasing shift toward cleaner energy solutions and the incorporation of gas turbines into renewable energy systems to improve grid stability. The oil and gas sector is expected to grow at a CAGR of over 5.5% through 2034, as rapid industrial expansion and stringent energy efficiency requirements are driving the adoption of robust power generation systems.
The US aeroderivative gas turbine market was valued at USD 267.9 million in 2022, USD 238.1 million in 2023, and USD 254.7 million in 2024. The shift from traditional power plants to gas turbine technology is boosting product adoption, while a heightened focus on reducing carbon footprints and meeting strict environmental standards is further driving demand for these high-efficiency turbines. The North American market is anticipated to grow at a CAGR of over 6% through 2034, supported by increasing industrial activities and continuous technological innovations that enhance operational efficiency and meet the growing demand for reliable power solutions.
Table of Contents
Chapter 1 Methodology & Scope
- 1.1 Market scope & definitions
- 1.2 Market estimates & forecast parameters
- 1.3 Forecast calculation
- 1.4 Data sources
- 1.4.1 Primary
- 1.4.2 Secondary
- 1.4.2.1 Paid
- 1.4.2.2 Public
Chapter 2 Executive Summary
- 2.1 Industry synopsis, 2021 - 2034
Chapter 3 Industry Insights
- 3.1 Industry ecosystem analysis
- 3.2 Regulatory landscape
- 3.3 Industry impact forces
- 3.3.1 Growth drivers
- 3.3.2 Industry pitfalls & challenges
- 3.4 Growth potential analysis
- 3.5 Porter's Analysis
- 3.5.1 Bargaining power of suppliers
- 3.5.2 Bargaining power of buyers
- 3.5.3 Threat of new entrants
- 3.5.4 Threat of substitutes
- 3.6 PESTEL Analysis
Chapter 4 Competitive Landscape, 2024
- 4.1 Introduction
- 4.2 Strategic outlook
- 4.3 Innovation & sustainability landscape
Chapter 5 Market Size and Forecast, By Capacity, 2021 – 2034 (MW & USD Million)
- 5.1 Key trends
- 5.2 ≤ 50 kW
- 5.3 > 50 to 500 kW
- 5.4 > 500 kW to 1 MW
- 5.5 > 1 to 30 MW
- 5.6 > 30 to 70 MW
- 5.7 > 70 MW
Chapter 6 Market Size and Forecast, By Technology, 2021 – 2034 (MW & USD Million)
- 6.1 Key trends
- 6.2 Open cycle
- 6.3 Combined cycle
Chapter 7 Market Size and Forecast, By Application, 2021 – 2034 (MW & USD Million)
- 7.1 Key trends
- 7.2 Power plants
- 7.3 Oil & gas
- 7.4 Process plants
- 7.5 Aviation
- 7.6 Marine
- 7.7 Others
Chapter 8 Market Size and Forecast, By Region, 2021 – 2034 (MW & USD Million)
- 8.1 Key trends
- 8.2 North America
- 8.2.1 U.S.
- 8.2.2 Canada
- 8.2.3 Mexico
- 8.3 Europe
- 8.3.1 UK
- 8.3.2 France
- 8.3.3 Germany
- 8.3.4 Russia
- 8.3.5 Italy
- 8.3.6 Netherlands
- 8.3.7 Denmark
- 8.3.8 Poland
- 8.3.9 Sweden
- 8.4 Asia Pacific
- 8.4.1 China
- 8.4.2 Australia
- 8.4.3 Japan
- 8.4.4 South Korea
- 8.4.5 Indonesia
- 8.4.6 Thailand
- 8.4.7 Malaysia
- 8.5 Middle East & Africa
- 8.5.1 Saudi Arabia
- 8.5.2 UAE
- 8.5.3 Qatar
- 8.5.4 Oman
- 8.5.5 Egypt
- 8.5.6 Turkey
- 8.5.7 Iraq
- 8.5.8 South Africa
- 8.5.9 Algeria
- 8.6 Latin America
- 8.6.1 Brazil
- 8.6.2 Argentina
- 8.6.3 Chile
Chapter 9 Company Profiles
- 9.1 Ansaldo Energia
- 9.2 Baker Hughes Company
- 9.3 Capstone Green Energy
- 9.4 Collins Aerospace
- 9.5 Destinus Energy
- 9.6 Doosan Enerbility
- 9.7 General Electric
- 9.8 Harbin Electric
- 9.9 Honeywell International
- 9.10 IHI Corporation
- 9.11 Kawasaki Heavy Industries
- 9.12 MAN Energy Solutions
- 9.13 Mitsubishi Heavy Industries
- 9.14 Nanjing Turbine & Electric Machinery
- 9.15 Pratt & Whitney
- 9.16 Rolls-Royce
- 9.17 Safran
- 9.18 Siemens Energy
- 9.19 Vericor
- 9.20 Wartsila
 全球工業燃氣渦輪點火系統市場研究報告 - 產業分析、規模、佔有率、成長、趨勢和預測 2025 年至 2033 年
 燃氣渦輪機
燃氣渦輪機 複合循環 (CC)的全球市場 (以季度為基礎)
 航空衍生燃氣渦輪機市場規模、佔有率和成長分析(按技術、循環、功率、燃料類型、應用、最終用途行業和地區)- 2025-2032 年行業預測
 2025-2029 年全球燃氣渦輪機市場
 2025 年燃氣渦輪機服務全球市場報告
 燃氣渦輪機市場機會、成長動力、產業趨勢分析及2025-2034年預測
 發電燃氣渦輪機市場機會、成長動力、產業趨勢分析及 2025-2034 年預測
 2025-2033 年按技術、設計類型(重型型、航改型)、額定容量、最終用戶和地區分類的燃氣渦輪機市場報告
 工業燃氣渦輪機市場規模、佔有率和成長分析(按類型、燃料類型、產能、產品、技術、應用和地區)- 2025-2032 年產業預測