


 |
市場調查報告書
商品編碼
1522834
全球五年市場預測(2024-2028):個人電腦、伺服器、主機板、Wi-Fi 連線裝置、智慧型手機Global Five-Year Market Forecast 2024-2028: PCs, Servers, Motherboards, Wi-Fi Connected Devices, and Smartphones |
||||||
該報告全面概述了全球筆記型電腦、桌上型電腦、伺服器、主機板、Wi-Fi 連接設備和智慧型手機產業,並對未來五年(2024-2028 年)的市場規模趨勢進行了展望。
筆記型電腦
預計2024年全球PC出貨量將達到2.461億台,2025年將達2.655億台,較上年成長8.3%。2024年至2028年的複合年增長率預計為2.7%。本報告重點關注傳統 PC,包括筆記型電腦和桌上型電腦,不包括平板電腦。
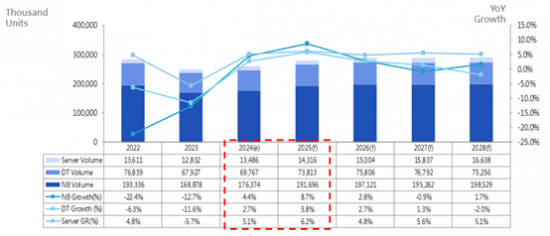
註 1:GR = 年成長率 註 2:桌上型電腦 (DT) 產品數量包含 AIO PC(一體機)數量 資料來源:MIC,2024 年 8 月
調查企業包括經營ODM、OEM、EMS、CEM、OBM和自有品牌業務的台灣筆記型電腦製造商,其生產基地和出貨目的地包括台灣、中國、日本、韓國,包括東南亞、北美、拉丁美洲、西歐等歐洲國家、等地區。
隨著全球經濟衰退持續,2023年全球筆記型電腦市場依然低迷。不過,在經歷了連續兩年的需求下滑之後,筆記型電腦供應鏈廠商對2024年的復甦持樂觀態度。
桌上型電腦
2023年全球桌上型電腦產業大幅下滑,出貨量達到67,927,000台,較2022年下降11.6%。儘管桌面PC供應鏈消除了過剩庫存,庫存水準保持健康,但市場仍受到全球經濟低迷和高通膨率的影響,導致消費者對PC產品的需求持續疲軟。
Wi-Fi 連線裝置
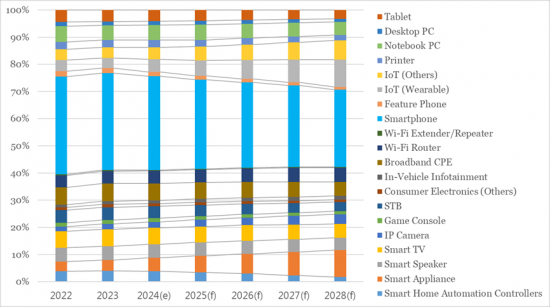
本報告研究了各種 Wi-Fi 連線設備,並將其分為三個使用領域:資訊設備、行動裝置和智慧連網家庭設備。本報告包含的設備包括智慧型手機、功能手機、物聯網(穿戴式裝置)、物聯網(其他)、印表機、筆記型電腦、桌上型電腦、平板電腦、寬頻CPE、Wi-Fi 路由器、Wi-Fi 擴展器/中繼器和智慧家庭自動化。其中,家電(其他)包括可攜式媒體企業(PMP)、電子書閱讀器、數位相機、數位相框、智慧遙控器等。IoT(穿戴式裝置)還包括智慧手錶、健身手環、XR裝置等,IoT(其他)包括機器人、智慧家庭週邊設備等。
整體市場規模預計將持續擴大。預計2028年,全球Wi-Fi連接設備市場將超過44億台設備,2023年至2028年的CAGR(複合年增長率)預計為5.1%。
2023年全球Wi-Fi連線設備出貨量較去年同期下降3.1%至32.2億台。隨著庫存清理接近完成以及市場普遍對經濟復甦持樂觀態度,Wi-Fi連接設備出貨量預計將從低點回升,並在2024年同比增長6.5%。
根據本報告的調查結果,2023年Wi-Fi連線產品(前5名產品)的出貨量佔有率由上至下依序為智慧型手機(35.7%)、寬頻CPE(6.5%)、智慧電視(6.3% )。
資料來源:MIC,2024 年 6 月
伺服器系統
隨著生成式人工智慧的出現和企業應用程式大規模語言模型 (LLM) 的最佳化,全球伺服器市場預計將在 2024 年復甦。這種復甦主要是由於人工智慧伺服器的需求增加,預計將推動全球伺服器市場的復甦。本報告重點在於以三種 CPU 架構分類的伺服器系統:x86、RISC(精簡指令集運算)等。此外,該報告還按外形規格(塔式、刀片式、機架式)和組裝等級(包括完整系統等級和準系統等級)對伺服器進行了細分。
主機板
由於多項不利因素,2023年全球主機板市場約7,540萬台,較前一年下降10.7%。預計2024年出貨量將達7,840萬台,較上年成長3.9%。這一增長是由商業和個人消費適度增長推動的,因為與 2022-2023 年相比,通膨壓力有所改善。
本報告重點關注主機板,並按 CPU 連接器類型(LGA1150、LGA1151、Socket AM3+、Socket AM4、Socket TR4 等)對主機板進行分類。出貨類型包括準系統、完整系統和獨立主機板。有關上述產品類別的定義,請參閱以下部分。
受訪企業均為業務模式為OBM (Original Brand Manufacturer)、ODM (Original Design Manufacturer)、OEM (Original Equipment Manufacturer)、EMS (Electronics Manufacturing Services)、CEM (Contract Electronics Manufacturer)及自有品牌的全球主機板製造商。生產地點和運送地區包括台灣、中國大陸、日本、韓國、其他亞洲國家、北美、拉丁美洲、西歐、其他歐洲國家和世界其他國家 (RoW)。上述地理範圍定義將在以下各節中進行解釋。
智慧型手機
雖然到 2023 年,智慧型手機仍將是最大的 Wi-Fi 使用類別,但自 2022 年以來的下降趨勢仍在繼續。尤其是中高階車型的購買力較往年減弱。儘管如此,預計到2028年全球智慧型手機出貨量將達到約13.19億部,2024年至2028年複合年增長率為2.26%。除了智慧型手機和筆記型電腦等核心產品外,智慧電視和智慧音箱等智慧家電的成長速度也可能出現逆轉。
請注意,本報告涵蓋行動電話,不包括無線電話和 PHS(個人手持系統)電話等低頻電話。手機依行動通訊標準及作業系統分為GSM、GPRS、EDGE、WCDMA、TD-SCDMA、cdmaOne、CDMA2000 1X、CDMA2000 1x EV-DO、iDEN。
目錄
- 桌上型電腦
- 全球PC(不含平板電腦)出貨量(2020-2028)
- 全球桌上型電腦出貨量(2020-2028)
- 全球桌上型電腦出貨量(2021年第一季至2023年第四季)
- 全球主機板/桌上型電腦出貨量比例(2020-2028)
- 全球桌上型電腦出貨量:依地區劃分(2020-2024)
- 全球桌上型電腦出貨量佔有率:按地區劃分(2020-2024 年)
- 依顧客類型劃分的全球桌上型電腦出貨量(2020-2024)
- 全球桌上型電腦出貨量佔有率:依顧客類型劃分(2020-2024 年)
- 全球桌上型電腦出貨量:依 CPU 連接器類型劃分(2022 年第一季 - 2024 年第二季)
- 全球桌上型電腦出貨量佔有率:按 CPU 連接器類型劃分(2022 年第一季 - 2024 年第二季)
- 情報洞察
- 調查範圍/定義
- 筆記型電腦
- 全球PC(不含平板電腦)出貨量(2020-2028)
- 全球筆記型電腦出貨量(2020-2028)
- 全球筆記型電腦出貨量(2022年第一季至2024年第四季)
- 全球筆記型電腦出貨量:按地區劃分(2020-2024年)
- 全球筆記型電腦出貨量佔有率:按地區劃分(2020-2024年)
- 全球筆記型電腦出貨量:按面板尺寸劃分(2022 年第一季 - 2024 年第二季)
- 全球筆記型電腦出貨量佔有率:按面板尺寸劃分(2022 年第一季 - 2024 年第二季)
- 按計算平台劃分的全球筆記型電腦出貨量(2022 年第一季 - 2024 年第二季)
- 全球筆記型電腦出貨量佔有率:按計算平台劃分(2022 年第一季 - 2024 年第二季)
- 情報洞察
- 調查範圍/定義
- 服務器
- 全球伺服器出貨量(2020-2028)
- 全球伺服器出貨量(2022 年第一季 - 2024 年第四季)
- 全球伺服器出貨量:依地區劃分(2020-2024)
- 全球伺服器出貨量佔有率:按地區劃分(2020-2024 年)
- 全球伺服器出貨量:依 CPU 架構劃分(2020-2024 年)
- 全球伺服器出貨量佔有率:依 CPU 架構劃分(2020-2024 年)
- 情報洞察
- 調查範圍/定義
- 母板
- 全球主機板出貨量(2020-2028)
- 全球主機板出貨量(2022年第一季至2024年第四季)
- 全球主機板/桌上型電腦出貨量比例(2020-2028)
- 全球主機板出貨量依地區劃分(2020-2024)
- 全球主機板出貨量佔有率:按地區劃分(2020-2024 年)
- 情報洞察
- 調查範圍/定義
- 手機
- 全球手機市場:依設備類型劃分(2022-2028)
- 按設備類型劃分的全球手機市場佔有率(2022-2028)
- 全球智慧型手機市場:按地區劃分(2022-2028)
- 全球智慧型手機市場佔有率:依地區劃分(2022-2028)
- 全球智慧型手機市場:依價格範圍劃分(2022-2028)
- 全球智慧型手機市場佔有率:依價格範圍劃分(2022-2028)
- 全球智慧型手機市場:依作業系統劃分(2022-2028)
- 全球智慧型手機市場佔有率:依作業系統劃分(2022-2028)
- 情報洞察
- 調查範圍/定義
- Wi-Fi 連線裝置
- 全球Wi-Fi設備市場趨勢
- Wi-Fi 連線裝置市場分析
- 出貨量分析
- 出貨量佔比分析
- 預測出貨量
- 資訊終端
- 移動設備
- 網絡設備
- 智慧互聯家居設備
- 衡量出貨佔有率預測
- 資訊設備
- 移動設備
- 網絡設備
- 智慧互聯家居設備
- Wi-Fi標準出爐狀況的變化
- MIC 視角
Market Intelligence & Consulting Institute (MIC) has recently released our latest five-year forecast value pack, which delivers MIC's comprehensive research findings for the global notebook PC, desktop PC, server, motherboard, Wi-Fi connected device, and smartphone industries for the period 2024-2028.
Notebook PCs
Global PC shipments are expected to reach 246.1 million units in 2024 and 265.5 million units in 2025, up 8.3% year-on-year. The compound annual growth rate (CAGR) is estimated at 2.7% for the period 2024-2028. This research focuses on traditional PCs, comprising notebook PCs and desktop PCs but not tablets; notebook PCs surveyed include those with screen sizes of 7 inches and larger.
Note 1: GR = Year-on-Year Growth Rate
Note 2: DT product values include the number of AIO PCs
Source: MIC, August 2024
Companies surveyed include Taiwanese notebook PC makers operating ODM, OEM, EMS, CEM, OBM, and private label businesses; production sites and shipment destinations include Taiwan, China, Japan, South Korea, Southeast Asia, North America, Latin America, Western Europe and other European countries, and other regions.
Facing the ongoing global economic downturn, the global notebook PC market witnessed another subdued year in 2023. Nevertheless, following two consecutive years of declining demand, manufacturers in the notebook PC supply chain are optimistic about a rebound in 2024.
Desktop PC
The global desktop PC industry witnessed a significant downturn in 2023, with shipments totaling 67.927 million units, marking an 11.6% decrease from 2022. Despite resolving excess inventory in the desktop PC supply chain and achieving healthier inventory levels, the market remained impacted by sluggish global economic conditions and high inflation rates, leading to sustained weak consumer demand for PC products.
Wi-Fi Connected Device
The research focuses on a wide range of Wi-Fi connected devices, which are categorized into three application areas: information devices, mobile devices, and smart connected home devices. Devices included in this research are smartphones, feature phones, IoT (Wearable), IoT (Others), printers, notebook PCs, desktop PCs, tablets, broadband CPE, Wi-Fi routers, Wi-Fi extenders/repeaters, smart home automation controllers, smart appliances, smart speakers, smart TVs, IP cameras, game consoles, STBs, consumer electronics (Others), and in-vehicle infotainment (IVI). Among them, consumer electronics (Others) includes portable media players (PMPs), e-readers, digital cameras, digital photo frames, smart remote controls, etc. IoT (Wearable) includes smartwatches, fitness bands, XR devices, etc., and IoT (Others) includes robots, smart home peripherals, etc.
The overall market size is projected to continue increasing, with the global Wi-Fi connected device market estimated to exceed 4.4 billion units by 2028, representing a compound annual growth rate (CAGR) of 5.1% from 2023 to 2028, according to the Market Intelligence & Consulting Institute (MIC).
The shipment volume of global Wi-Fi connected devices in 2023 decreased to 3.22 billion units, down 3.1% year-on-year. As inventory clearance nears completion and the market generally holds a positive outlook for economic recovery, MIC estimates that Wi-Fi connected device shipments will rebound from their lows to reach 3.43 billion units in 2024, up 6.5% year-on-year.
Based on MIC's findings, the shipment shares of the top five Wi-Fi connected products in 2023, in descending order, were smartphones (35.7%), broadband CPE (6.5%), smart TVs (6.3%), notebook PCs (5.3%), and smart speakers (5.1%), totaling 58.9% of the market share.
Source: MIC, June 2024
Server Systems
The global server market is anticipated to undergo a revival in 2024, driven by the emergence of generative AI and the optimization of large language models (LLMs) for enterprise applications. This resurgence is primarily attributed to the increasing demand for AI servers, expected to propel the recovery of the global server market. This research focuses on server systems classified by three CPU architectures: x86, RISC (Reduced Instruction Set Computing), and others. Servers in this study are further segmented into tower, blade, and rack-mounted form factors, as well as by assembly level, including full system and barebones levels.
Motherboard
Due to several detrimental factors, the global motherboard market in 2023 was approximately 75.4 million units, with a year-on-year decline of 10.7%. Shipments are expected to grow by 3.9% year-on-year in 2024, reaching 78.4 million units. This growth is attributed to the increase in commercial and consumer spending, albeit modest, as inflationary pressures have improved compared to 2022 and 2023.
This research focuses on motherboards, divided by CPU connector type, including LGA1150, LGA1151, Socket AM3+, Socket AM4, and Socket TR4. The shipment types surveyed encompass barebones systems, complete systems, and standalone motherboards. For definitions of the aforementioned product classifications, please refer to the following sections.
Companies surveyed are major global motherboard manufacturers whose business models include OBM (Original Brand Manufacturer), ODM (Original Design Manufacturer), OEM (Original Equipment Manufacturer), EMS (Electronics Manufacturing Services), CEM (Contract Electronics Manufacturer), and Private Label. The production sites and shipment regions include Taiwan, China, Japan, South Korea, other Asian countries, North America, Latin America, Western Europe, other European countries, and other regions (rest of the world, RoW). Definitions of the aforementioned geographic coverage are provided in the following sections.
Smartphone
In 2023, smartphones—remaining the largest segment of Wi-Fi application categories—continued the sluggish market trend from 2022. The purchasing power for mid-to-high-end models was weaker than in previous years. Despite this, MIC estimates that global smartphone shipments will total around 1.319 billion units by 2028, with a compound annual growth rate (CAGR) of 2.26% from 2024 to 2028. Aside from major items like smartphones and notebook PCs, smart home appliances such as smart TVs and smart speakers are likely to experience growth reversals.
The research focuses on mobile phones and does not include low-frequency phones such as cordless phones and PHS (Personal Handy System) phones. Mobile phones can be divided by mobile communications standard and operating system into GSM, GPRS, EDGE, WCDMA, TD-SCDMA, cdmaOne, CDMA2000 1X, CDMA2000 1x EV-DO, and iDEN.
Table of Contents
- Desktop PC
- Worldwide PC (exclude Tablet) Shipment Volume, 2020 - 2028
- Worldwide Desktop PC Shipment Volume, 2020 - 2028
- Worldwide Desktop PC Shipment Volume, 1Q 2021 - 4Q 2023
- Worldwide Motherboard / Worldwide Desktop PC Shipment Volume Ratio, 2020 - 2028
- Worldwide Desktop PC Shipment Volume by Region, 2020 - 2024
- Worldwide Desktop PC Shipment Share by Region, 2020 - 2024
- Worldwide Desktop PC Shipment by Customer Type, 2020 - 2024
- Worldwide Desktop PC Shipment Share by Customer Type, 2020 - 2024
- Worldwide Desktop PC Shipment by CPU Connector Type, 1Q 2022 - 2Q 2024
- Worldwide Desktop PC Shipment Share by CPU Connector Type, 1Q 2022 - 2Q 2024
- Intelligence Insight
- Research Scope & Definitions
- Notebook PC
- Worldwide PC (exclude Tablet) Shipment Volume, 2020 - 2028
- Worldwide Notebook PC Shipment Volume, 2020 - 2028
- Worldwide Notebook PC Shipment Volume, 1Q 2022 - 4Q 2024
- Worldwide Notebook PC Shipment Volume by Region, 2020 - 2024
- Worldwide Notebook PC Shipment Share by Region, 2020 - 2024
- Worldwide Notebook PC Shipment Volume by by Panel Size, 1Q 2022 - 2Q 2024
- Worldwide Notebook PC Shipment Share by by Panel Size, 1Q 2022 - 2Q 2024
- Worldwide Notebook PC Shipment Volume by Computing Platform, 1Q 2022 - 2Q 2024
- Worldwide Notebook PC Shipment Share by Computing Platform, 1Q 2022 - 2Q 2024
- Intelligence Insight
- Research Scope & Definitions
- Server
- Worldwide Server Shipment Volume, 2020 - 2028
- Worldwide Server Shipment Volume, 1Q22 - 4Q24
- Worldwide Server Shipment Volume by Region, 2020 - 2024
- Worldwide Server Shipment Share by Region, 2020 - 2024
- Worldwide Server Shipment Volume by CPU Architecture, 2020 - 2024
- Worldwide Server Shipment Share by CPU Architecture, 2020 - 2024
- Intelligence Insight
- Research Scope & Definitions
- Motherboard
- Worldwide Motherboard Shipment Volume, 2020 - 2028
- Worldwide Motherboard Shipment Volume, 1Q22 - 4Q24
- Worldwide Motherboard / Worldwide Desktop PC Shipment Volume Ratio, 2020 - 2028
- Worldwide Motherboard Shipment Volume by Region, 2020 - 2024
- Worldwide Motherboard Shipment Share by Region, 2020 - 2024
- Intelligence Insight
- Research Scope & Definitions
- Smartphone
- Worldwide Mobile Phone Market by Device Type, 2022 - 2028
- Worldwide Mobile Phone Market Share by Device Type, 2022 - 2028
- Worldwide Smartphone Market by Region, 2022 - 2028
- Worldwide Smartphone Market Share by Region, 2022 - 2028
- Worldwide Smartphone Market by Price Point, 2022 - 2028
- Worldwide Smartphone Market Share by Price Point, 2022 - 2028
- Worldwide Smartphone Market by Operating System, 2022 - 2028
- Worldwide Smartphone Market Share by Operating System, 2022 - 2028
- Intelligence Insight
- Research Scope & Definitions
- Wi-Fi Connected Devices
- 1. Development of Worldwide Wi-Fi Devices
- 2. Analaysis of Wi-Fi Connected Devices
- 2.1 Shipment Volume Analysis
- 2.2 Shipment Share Analysis
- 2.3 Shipment Volume Forecast
- 2.3.1 Information Devices
- 2.3.2 Mobile Devices
- 2.3.4 Networking Devices
- 2.3.4 Smart Connected Home Devices
- 2.4 Shipment Share Forecast
- 2.4.1 Information Devices
- 2.4.2 Mobile Devices
- 2.4.3 Networking Devices
- 2.4.4 Smart Connected Home Devices
- 3. Changes in Wi-Fi Standard Adoption
- 4. MIC Perspective
 無線基礎設施市場規模、佔有率、成長分析,按組件、按連接類型、按平台、按部署、按地區 - 行業預測,2024-2031 年
 無線基礎設施市場:按產品、技術、基礎設施和最終用戶分類 - 2025-2030 年全球預測
 無線基礎設施市場:2024年與第3季 - 2G/3G/4G/5G無線存取(點閱)核心網路
 全球電信級Wi-Fi設備市場(2024-2028)
 無線基礎設施市場:依連接類型、依基礎設施、按平台、按地區
 印度的無線基礎設施市場(2024年9月)
 Wi-Fi 網路設備的全球市場:市場佔有率分析、產業趨勢/統計、成長預測(2024-2029)
 無線基礎設施市場、機會、成長動力、產業趨勢分析與預測,2024-2032
 中國的無線基礎設施(2024年7月):利用其經濟和5G超級大國的地位,中國為國家新焦點6G鋪平道路
 ODM 與 EMS Wi-Fi 設備市場:全球產業分析、規模、佔有率、成長、趨勢、預測,2024-2033年預測