


 |
市場調查報告書
商品編碼
1494937
銀行詐欺偵測與預防全球市場:2024-2029Global Fraud Detection & Prevention in Banking Market: 2024-2029 |
||||||
| 關鍵統計 | |
|---|---|
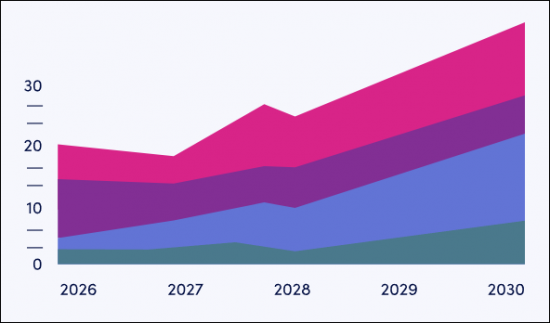
| 詐欺偵測與預防解決方案支出金額(2024年): | 173億元 |
| 詐欺偵測與預防解決方案支出金額(2029年): | 322億元 |
| 市場成長率(2024-2029) | 86% |
| 存款期限: | 2024-2029 |
本報告提供銀行業詐欺偵測和預防市場研究、不斷演變的詐欺情況詳細審查和分析、法律體系、詐欺偵測和預防利用技術和解決方案、市場成長促進因素和問題、非法交易金額、金額造成的損失、每年各類金融設備詐欺偵察和防範解決方案的支出、各地區的詳細分析以及主要供應商消除競爭的措施等。
模型視圖
市場材料/預測報告
Juniper Research的市場資料和預測報告,除了透過數字了解現狀之外,詳細解釋了方法和原因。
市場趨勢與策略報告
對當前市場情勢的綜合分析和策略建議。
市場資料與預測報告
- 與詐欺偵測和預防解決方案相關的多家銀行和金融機構
- 用於銀行詐欺偵測和預防的支出金額
- 非法交易金額
次要指標,由各主要市場提供如下:
- 銀行和金融機構
- 信用合作公司
- 貸方
- 投資公司
目次
市場趨勢/策略
第1章 要點與策略建議
- 要點
- 策略建議
第2章 市場狀況
- 定義範圍
- 詐欺類型
- 第一方欺詐
- 洗錢
- 退款欺詐
- ATO
- 合成 ID
- 偵測並防止犯罪者詐欺的解決方法
- 詐欺偵測/預防系統
- 生物鑑定
- 代幣化
- 行動分析
- AML 軟體
- 詐欺偵測/預防系統
第3章 新詐欺市場
- 主要主題相關領域
- 主要趨勢與直接驅動市場因素
- 付款方式
- 開放銀行
- BNPL
- CBDC
- 加密貨幣
- 即時支付
- 匯款
- 技術
- 人工智慧
- ML
- API
- 規則
- 英國快速支付規定
- PSD2
- RTS 對支付服務提供者的影響
第4章 細分市場分析
- 介紹
- 銀行和信用合作社
- 金融科技
- 貸方
- 減少詐欺損失
- 加強風險管理
- 提高貸款組合的品質
- 保持信用和聲譽
- 投資公司
- 主要問題
競爭排除政策
第1章 Juniper Research 競爭排行榜
第2章 公司簡介
- 發行人反詐騙供應商簡介
- Accertify
- ACI Worldwide
- ComplyAdvantage
- Discover
- Feauturespace
- Feedzai
- Fiserv
- Fraudio
- GBG
- LexisNexis Risk Solution
- Mastercard
- SEON
- Thales
- TransUnion
- Visa
- Juniper Research排行榜評估方法
- 限制和解釋
材料/預測
第1章 市場概述
- 定義/範圍
第2章 方法假設總結
- 預測概述
- 研究方法/前提
第3章 預測概述
- 發行者預防詐欺預測:摘要
- 使用詐欺偵測和預防解決方案的銀行和其他金融機構的數量
- 詐欺檢測和預防解決方案的年度總支出
- 銀行和匯款詐欺交易總數
- 銀行和匯款詐欺交易總數
第4章 銀行及其他金融機構支出
- 銀行和信用合作社用於偵測和預防詐欺的支出
- 使用詐欺偵測和預防解決方案的銀行和信用社數量
- 銀行和信用合作社用於詐欺檢測和預防解決方案的總支出
- 金融科技詐欺偵測與預防支出
- 使用詐欺偵測和預防解決方案的金融科技公司數量
- 金融科技詐欺偵測與預防解決方案的總支出
- 投資公司詐欺檢測與預防支出
- 使用詐欺偵測和預防解決方案的投資公司數量
- 投資公司在詐欺檢測和預防解決方案上的總支出
- 貸方詐欺檢測和預防支出
- 使用詐欺檢測和預防解決方案的貸方數量
- 貸方在詐欺檢測和預防解決方案上的總支出
第5章 銀行與匯款中的詐欺交易
- 數位銀行中的詐騙交易
- 數位銀行詐欺交易總數
- 數位銀行詐欺交易總額
- 匯款詐欺交易率
- 匯款詐欺交易總數
- 匯款詐欺交易總額
| KEY STATISTICS | |
|---|---|
| Spend on fraud detection and prevention solutions in 2024: | $17.3 billion |
| Spend on fraud detection and prevention solutions in 2029: | $32.2 billion |
| 2024 to 2029 market growth: | 86% |
| Forecast period: | 2024-2029 |
Overview
Our "Fraud Detection & Prevention in Banking" research report provides a detailed evaluation and analysis of the evolving fraud landscape when it comes to banking and the financial industry, including the impact of evolving payment types such as instant payments, blockchain and CBDCs (central bank digital currencies). The fraud analytics and prevention techniques study examines other initiatives and fraudulent schemes disrupting the market, such as the changing scope of government regulations and the use of artificial intelligence by both good and bad actors.
The banking fraud detection research also considers future challenges within fraud detection and prevention for banking, such as false positives and emerging trends in the banking sector space, including the increased use of behavioural analysis and transaction monitoring.
In addition, this fraud detection and prevention market report covers fraud risks market segment opportunities; providing a comprehensive approach with strategic insights into the development of advanced methods of fraud detection and prevention capabilities for banks and other financial institutions, in line with new technologies, such as AI and machine learning.
Through advanced analytics, It highlights future opportunities and technologies that are important for fraud detection and prevention vendors, banks and financial institutions to consider when adapting fraud detection and prevention solutions for the future, incorporating advanced fraud detection aspects such as AI and real-time data.
The report positions 15 fraud detection in banking and prevention vendors in the financial services sector across the Juniper Research Competitor Leaderboard; delivering an invaluable resource for stakeholders seeking to understand the competitive landscape in the financial fraud market.
The research suite contains a detailed dataset; providing forecasts for 60 countries across a wide range of different metrics and instances of fraud, including total number of banks, credit unions, lenders and investment companies using types of fraud detection and prevention solutions, total annual spend on fraud detection and prevention solutions, total number of fraudulent transactions in banking and money transfer and total fraudulent transaction value.
Key Features
- Market Dynamics: A strategic analysis of the major drivers, challenges, and innovations shaping the adoption and development of the fraud detection and prevention in banking industry, including:
- Key Takeaways & Strategic Recommendations: In-depth analysis of key development opportunities and key findings within the fraud detection and prevention in banking market, accompanied by key strategic recommendations for stakeholders.
- Benchmark Industry Forecasts: Includes forecasts for the total money transfer for both domestic and international money movement, as well as the total money sent through consumer instant payments. This data is split by our 8 key forecast regions and 60 countries.
- Juniper Research Competitor Leaderboard: Key player capability and capacity assessment for 15 vendors in the fraud detection and fraud prevention solutions space, via a Juniper Research Competitor Leaderboard.
SAMPLE VIEW
Market Data & Forecasting Report
The numbers tell you what's happening, but our written report details why, alongside the methodologies.
Market Trends & Strategies Report
A comprehensive analysis of the current market landscape, alongside strategic recommendations.
Market Data & Forecasting Report
The market-leading research suite for the "Fraud Detection and Prevention in Banking" market includes access to the full set of forecast data of 54 tables and over 24,000 datapoints. Metrics in the research suite include:
- Total number of Banks and Financial Institutions Using Fraud Detection and Prevention Solutions
- Total Spend on Fraud Detection and Prevention in Banking
- Total Fraudulent Transaction Value
These metrics are provided for the following key market verticals:
- Banks and Financial Institutions
- Credit Unions
- Lenders
- Investment Companies
Juniper Research Interactive Forecast Excel contains the following functionality:
- Statistics Analysis: Users benefit from the ability to search for specific metrics, displayed for all regions and countries across the data period. Graphs are easily modified and can be exported to the clipboard.
- Country Data Tool: This tool lets users look at metrics for all regions and countries in the forecast period. Users can refine the metrics displayed via a search bar.
- Country Comparison Tool: Users can select and compare specific countries. The ability to export graphs is included in this tool.
- What-if Analysis: Here, users can compare forecast metrics against their own assumptions, via 5 interactive scenarios.
Market Trends & Strategies Report
Juniper Research's new report examines the "Fraud Detection and Prevention in Banking" market landscape in detail; assessing current fraud trends and factors shaping the market, such as the growing use and anticipation surrounding different technologies such as AI and ML (Machine Learning), and the existing and impending regulations in the space. The report delivers comprehensive analysis of the strategic opportunities for fraud detection and prevention providers within banking; addressing key verticals, developing challenges, and how stakeholders should navigate these.
Competitor Leaderboard Report
Juniper Research's Competitor Leaderboard provides detailed evaluation and market positioning for 15 leading vendors in the payment fraud detection and prevention space. The vendors are positioned either as established leaders, leading challengers or disruptors and challengers, based on capacity and capability assessments.
The vendors in the Leaderboard include:
|
|
Backed by a robust and comprehensive scoring methodology, Juniper Research's Competitor Leaderboard allows readers to gain greater insight into leading market players; enabling them to view which companies have the highest market prospects and the strategies being implemented.
Table of Contents
Market Trends & Strategies
1. Key Takeaways & Strategic Recommendations
- 1.1. Key Takeaways
- 1.2. Strategic Recommendations
2. Market Landscape
- 2.1. Introduction
- 2.2. Definitions and Scope
- Figure 2.1: Visualisation of Fraud
- 2.3. Types of Fraud
- 2.3.1. First-party Fraud
- i. Application Fraud and Fake Accounts
- ii. Money Mules
- iii. Fronting
- iv. Sleeper Fraud
- v. APP Fraud
- vi. Social Engineering
- 2.3.2. Money Laundering
- Figure 2.2: Visualisation of Money Laundering
- 2.3.3. Chargeback Fraud
- Figure 2.3: Visualisation of Chargeback Fraud
- 2.3.4. ATO
- Figure 2.4: Visualisation of Account Takeover
- 2.3.5. Synthetic Identity
- Figure 2.5: Visualisation of Synthetic Identity Fraud
- i. Detection of Synthetic Identity Fraud
- 2.3.1. First-party Fraud
- 2.4. Solutions Utilised in Issuer Fraud Detection & Prevention
- 2.4.1. Fraud Detection and Prevention Systems
- Figure 2.6: Types of Fraud Detection and Techniques
- i. Biometrics
- ii. Tokenisation
- iii. Behavioural Analytics
- iv. AML Software
- 2.4.1. Fraud Detection and Prevention Systems
3. Emerging Fraud Market
- 3.1. Key Themes and Areas Involved
- 3.2. Key Trends & Current Market Drivers
- 3.3. Payment Types
- 3.3.1. Open Banking
- i. Increase in Fraud Through Open Banking
- Figure 3.1: Visualisation of Open Banking
- ii. Decrease in Fraud Through Open Banking
- Figure 3.2: Visualisation of Open Banking
- i. Increase in Fraud Through Open Banking
- 3.3.2. BNPL
- i. Increase in Fraud Through BNPL
- Figure 3.3: Buy Now Pay Later Flow
- ii. Decrease in Fraud Through BNPL
- i. Increase in Fraud Through BNPL
- 3.3.3. CBDCs
- Figure 3.4: Visualisation of CBDC
- i. Increase in Fraud Through CBDCs
- ii. Decrease in Fraud Through CBDCs
- iii. Mitigating CBDC Fraud
- 3.3.4. Cryptocurrency
- i. Increase in Fraud Through Cryptocurrency
- ii. Mitigating Cryptocurrency Fraud
- 3.3.5. Real-time Payments
- Figure 3.5: Visualisation of Instant Payments
- i. Increase in Fraud Through Real-time Payments
- ii. Decrease in Fraud Through Real-time Payments
- 3.3.6. Money Transfer
- i. Increase in Fraud Through Money Transfer
- Figure 3.6: Total Number of Fraudulent Money Transfer Transactions (m), Split by 8 Key Regions, 2024-2029
- ii. Decrease in Fraud Through Money Transfer
- 3.3.1. Open Banking
- 3.4. Technologies
- 3.4.1. AI
- i. Benefits of AI in Fraud Detection
- Figure 3.7: Benefits of AI in Fraud Detection
- ii. How AI Is Being Utilised by Fraudsters
- i. Benefits of AI in Fraud Detection
- 3.4.2. ML
- i. Benefits of ML in Fraud Detection
- ii. How ML Is Being Utilised by Fraudsters
- 3.4.3. APIs
- i. Benefits of APIs in Fraud Detection
- ii. How APIs Are Being Utilised by Fraudsters
- iii. Open Banking APIs
- iv. FAPI (Financial-grade API)
- 3.4.1. AI
- 3.5. Regulations
- 3.5.1. UK Faster Payments Regulation
- 3.5.2. PSD2
- 3.5.3. RTS (Regulatory Technical Standards) Implications for Payment Service Providers
- i. Fraud Detection
- ii. Merger of Home Working, Personal Devices and Corporate Access
- iii. Exemptions from SCA
- iv. Implications
- v. Network Tokenisation in India
- vi. Regulation Differences
4. Segment Analysis
- 4.1. Introduction
- 4.1.1. Banks and Credit Unions
- Figure 4.1: Total Spend on Fraud Detection and Prevention by Banks and Credit Unions ($m), Globally, Split by 8 Key Regions, 2024-2029
- 4.1.2. Fintechs
- Figure 4.2: Total Number of Fintechs Using Fraud Detection and Prevention Solutions, 2024-2029
- 4.1.3. Lenders
- i. Reducing Exposure to Fraud
- ii. Enhance Risk Management
- iii. Improved Quality of Loan Portfolio
- iv. Protect Trust and Reputation
- Figure 4.3: Total Spend on Fraud Detection and Prevention by Lenders Globally ($m), Split by 8 Key Regions, 2024-2029
- 4.1.4. Investment Companies
- Figure 4.4: Total Spend on Fraud Detection and Prevention from Investment Companies ($m), Split by 8 Key Regions, 2024-2029
- 4.1.1. Banks and Credit Unions
- 4.2. Key Challenges
Competitor Leaderboard
1. Juniper Research Competitor Leaderboard
- 1.1. Why Read This Report
- Table 1.1: Juniper Research Competitor Leaderboard Vendors: Fraud Detection & Prevention in Banking
- Figure 1.2: Juniper Research Competitor Leaderboard - Fraud Detection & Prevention in Banking
- Table 1.3: Juniper Research Competitor Leaderboard: Fraud Detection & Prevention in Banking Vendor Ranking
- Table 1.4: Juniper Research Competitor Leaderboard Fraud Detection & Prevention in Banking - Heatmap
2. Company Profiles
- 2.1. Issuer Fraud Prevention Vendor Profiles
- 2.1.1. Accertify
- i. Corporate Information
- ii. Geographical Spread
- iii. Key Clients & Strategic Partnerships
- iv. High-level View of Offering
- Figure 2.1: Accertify Financial Institution Fraud Prevention Solution
- v. Juniper Research's View: Key Strengths & Strategic Opportunities
- 2.1.2. ACI Worldwide
- i. Corporate
- ii. Geographical Spread
- iii. Key Clients & Strategic Partnerships
- iv. High-level View of Offering
- v. Juniper Research's View: Key Strengths & Strategic Opportunities
- 2.1.3. ComplyAdvantage
- i. Corporate Information
- ii. Geographical Spread
- iii. Key Clients & Strategic Partnerships
- iv. High-level View of Offering
- v. Juniper Research's View: Key Strengths & Strategic Opportunities
- 2.1.4. Discover
- i. Corporate Information
- ii. Geographical Spread
- iii. Key Clients & Strategic Partnerships
- iv. High-level View of Offering
- v. Juniper Research's View: Key Strengths & Strategic Opportunities
- 2.1.5. Feauturespace
- i. Corporate Information
- ii. Geographical Spread
- iii. Key Clients & Strategic Partnerships
- iv. High-level View of Offering
- v. Juniper Research's View: Key Strengths & Strategic Opportunities
- 2.1.6. Feedzai
- i. Corporate Information
- ii. Geographical Spread
- iii. Key Clients & Strategic Partnerships
- iv. High-level View of Offering
- v. Juniper Research's View: Key Strengths & Strategic Opportunities
- 2.1.7. Fiserv
- i. Corporate Information
- ii. Geographical Spread
- iii. Key Clients & Strategic Partnerships
- iv. High-level View of Offering
- v. Juniper Research's View: Key Strengths & Strategic Opportunities
- 2.1.8. Fraudio
- i. Corporate Information
- ii. Geographical Spread
- iii. Key Clients & Strategic Partnerships
- iv. High-level View of Offering
- v. Juniper Research's View: Key Strengths & Strategic Opportunities
- 2.1.9. GBG
- i. Corporate Information
- ii. Geographical Spread
- iii. Key Clients & Strategic Partnerships
- iv. High-level View of Offering
- v. Juniper Research's View: Key Strengths & Strategic Opportunities
- 2.1.10. LexisNexis Risk Solution
- i. Corporate Information
- ii. Geographical Spread
- iii. Key Clients & Strategic Partnerships
- iv. High-level View of Offering
- v. Juniper Research's View: Key Strengths & Strategic Opportunities
- 2.1.11. Mastercard
- i. Corporate Information
- ii. Geographical Spread
- iii. Key Clients & Strategic Partnerships
- iv. High-level View of Offering
- v. Juniper Research's View: Key Strengths & Strategic Opportunities
- 2.1.12. SEON
- i. Corporate Information
- ii. Geographical Spread
- iii. Key Clients & Strategic Partnerships
- iv. High-level View of Offering
- v. Juniper Research's View: Key Strengths & Strategic Opportunities
- 2.1.13. Thales
- i. Corporate
- ii. Geographical Spread
- iii. Key Clients & Strategic Partnerships
- iv. High-level View of Offering
- v. Juniper Research's View: Key Strengths & Strategic Opportunities
- 2.1.14. TransUnion
- i. Corporate
- ii. Geographical Spread
- iii. Key Clients & Strategic Partnerships
- iv. High-level View of Offering
- v. Juniper Research's View: Key Strengths & Strategic Opportunities
- 2.1.15. Visa
- i. Corporate
- ii. Geographical Spread
- iii. Key Clients & Strategic Partnerships
- iv. High-level View of Offering
- v. Juniper Research's View: Key Strengths & Strategic Opportunities
- 2.1.1. Accertify
- 2.2. Juniper Research Leaderboard Assessment Methodology
- 2.2.1. Limitations & Interpretations
- Table 2.4: Juniper Research Fraud Detection & Prevention in Banking Assessment Criteria
- 2.2.1. Limitations & Interpretations
Data & Forecasting
1. Market Overview
- 1.1. Introduction
- 1.2. Definitions and Scope
- Figure 1.1: Visualisation of Fraud
2. Methodology Assumptions and Summary
- 2.1. Forecast Introduction
- 2.2. Methodology & Assumptions
- Figure 2.1: Spend on Fraud Detection & Prevention Methodology
- Figure 2.2: Fraudulent Transaction Value Forecast
3. Forecast Summary
- 3.1. Issuer Fraud Prevention Forecast Summary
- 3.1.1. Number of Bank and Other Financial Institutions Using Fraud Detection & Prevention Solutions
- Figure & Table 3.1: Total Number of Banks and Financial Institutions Using Fraud Detection & Prevention Solutions (m), Split by 8 Key Regions, 2024-2029
- 3.1.2. Total Annual Spend on Fraud Detection & Prevention Solutions
- Figure & Table 3.2: Total Spend on Fraud Detection & prevention Solutions by Banks and Other Financial Institutions ($m), Split by 8 Key Regions, 2024-2029
- Table 3.3: Total Spend from Banks and Credit Unions Using Fraud Detection & Prevention Solutions ($m), Split by Company Vertical, 2024-2029
- 3.1.3. Total Number of Fraudulent Transactions across Banking and Money Transfer
- Figure & Table 3.4: Total Number of Fraudulent Transactions across Banking and Money Transfer (m), Split by 8 Key Regions 2024-2029
- 3.1.4. Total Value of Fraudulent Transactions across Banking and Money Transfer
- Figure & Table 3.5: Total Value of Fraudulent Transactions across Digital Banking and Money Transfer ($m), Split by 8 Key Regions, 2024-2029
- 3.1.1. Number of Bank and Other Financial Institutions Using Fraud Detection & Prevention Solutions
4. Banks and Other Financial Institutions Spend
- 4.1. Banks and Credit Unions Fraud Detection & Prevention Spend
- 4.1.1. Number of Banks and Credit Unions Using Fraud Detection & Prevention Solutions
- Figure & Table 4.1: Total Number of Banks and Credit Unions Using Fraud Detection & Prevention Solutions (m), Split by 8 Key Regions, 2024-2029
- 4.1.2. Total Spend by Banks and Credit Unions on Fraud Detection & Prevention Solutions
- Figure & Table 4.2: Total Spend from Banks and Credit Unions Using Fraud Detection & Prevention Solutions ($m), Split by 8 Key Regions 2024-2029
- 4.1.1. Number of Banks and Credit Unions Using Fraud Detection & Prevention Solutions
- 4.2. Fintechs Fraud Detection & prevention Spend
- 4.2.1. Number of Fintechs Using Fraud Detection & Prevention Solutions
- Figure & Table 4.3: Total Number of Fintechs Using Fraud Detection & Prevention Solutions (m), Split by 8 Key Regions, 2024-2029
- 4.2.2. Total Spend by Fintechs on Fraud Detection & Prevention Solutions
- Figure & Table 4.4: Total Spend from Fintechs Using Fraud Detection & Prevention Solutions ($m), Split by 8 Key Regions 2024-2029
- 4.2.1. Number of Fintechs Using Fraud Detection & Prevention Solutions
- 4.3. Investment Companies Fraud Detection & prevention Spend
- 4.3.1. Number of Investment Companies Using Fraud Detection & Prevention Solutions
- Figure & Table 4.5: Total Number of Investment Companies Using Fraud Detection & Prevention Solutions (m), Split by 8 Key Regions, 2024-2029
- 4.3.2. Total Spend by Investment Companies on Fraud Detection & Prevention Solutions
- Figure & Table 4.6: Total Spend from Investment Companies Using Fraud Detection & Prevention Solutions ($m), Split by 8 Key Regions, 2024-2029
- 4.3.1. Number of Investment Companies Using Fraud Detection & Prevention Solutions
- 4.4. Lenders Fraud Detection & prevention Spend
- 4.4.1. Number of Lenders Using Fraud Detection & Prevention Solutions
- Figure & Table 4.7: Total Number of Lenders Using Fraud Detection & Prevention Solutions (m), Split by 8 Key Regions, 2024-2029
- 4.4.2. Total Spend by Lenders on Fraud Detection & Prevention Solutions
- Figure & Table 4.8: Total Spend from Lenders Using Fraud Detection & Prevention Solutions ($m), Split by 8 Key Regions, 2024-2029
- 4.4.1. Number of Lenders Using Fraud Detection & Prevention Solutions
5. Fraudulent Transactions in Banking and Money Transfer
- 5.1. Fraudulent Transactions in Digital Banking
- 5.1.1. Total Number of Fraudulent Transactions in Digital Banking
- Figure & Table 5.1: Total Number of Fraudulent Transactions within Digital Banking (m), Split by 8 Key Regions, 2024-2029
- 5.1.2. Total Fraudulent Transaction Values in Digital Banking
- Figure & Table 5.2: Total Fraudulent Transaction Values in Digital Banking ($m), Split by 8 Key Regions, 2024-2029
- 5.1.1. Total Number of Fraudulent Transactions in Digital Banking
- 5.2. Fraudulent Transaction Rates in Money Transfer
- 5.2.1. Total Number of Fraudulent Transactions in Money Transfer
- Figure & Table 5.3: Total Number of Fraudulent Transactions within Money Transfer (m), Split by 8 Key Regions, 2024-2029
- 5.2.2. Total Fraudulent Transaction Values in Money Transfer
- Figure & Table 5.4: Total Fraudulent Transaction Values in Money Transfer ($m), Split by 8 Key Regions, 2024-2029
- 5.2.1. Total Number of Fraudulent Transactions in Money Transfer
 詐欺預測與檢測系統市場:2025-2030 年全球預測(按服務提供、組件、部署類型、公司規模和行業細分)
 2025年人工智慧欺詐管理全球市場報告2025年金融詐欺偵測軟體全球市場報告2025 年詐欺偵測與預防全球市場報告2025 年詐騙獵人全球市場報告
 詐欺管理市場中的人工智慧:到 2033 年的市場分析和預測 - 按類型、產品、服務、技術、組件、應用、流程、部署、最終用戶、解決方案反網路釣魚市場:按服務提供、按類型、按組織規模、按部署、按最終用戶 - 2025-2030 年全球預測詐欺偵測與預防市場規模、佔有率、趨勢分析報告:2025-2030 年按組件、應用、組織、產業、地區和細分市場預測詐欺偵測與預防市場:解決方案、服務、組織規模、部署、應用領域、產業 - 全球預測 2025-2030 年
 網路釣魚防護市場規模和預測、全球和區域佔有率、趨勢和成長機會分析報告範圍:按產品、部署、類型、企業規模、垂直領域、地理位置