


 |
市場調查報告書
商品編碼
1641894
工業級尿素-市場佔有率分析、產業趨勢與統計、成長預測(2025-2030 年)Industrial Grade Urea - Market Share Analysis, Industry Trends & Statistics, Growth Forecasts (2025 - 2030) |
||||||
※ 本網頁內容可能與最新版本有所差異。詳細情況請與我們聯繫。
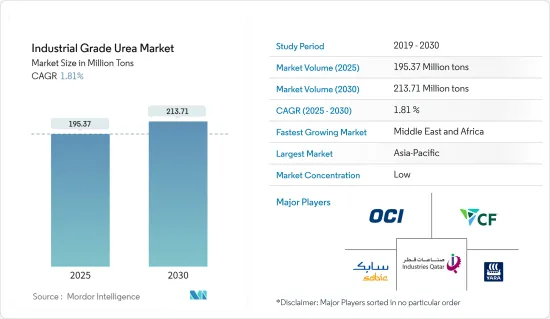
預計2025年工業級尿素市場規模為1.9537億噸,至2030年預計將達到2.1371億噸,預測期內(2025-2030年)的複合年成長率為1.81%。
考慮到 COVID-19 疫情情勢,一些國家被迫封鎖,導致人們盡量減少使用私家車。此外,汽車製造廠的暫時關閉導致尿素基催化劑的消費量下降。然而,2021年市場復甦了。預計未來幾年將出現顯著成長。
關鍵亮點
- 短期內,技術級尿素的高適用性、汽車產業需求的增加以及肥料領域使用量的增加預計將推動市場成長。
- 重點地區尿素的濫用和價格波動可能會阻礙市場的成長。
- 工業級尿素在綠建築的使用很可能在未來幾年為市場創造機會。
- 預計亞太地區將主導市場。然而,中東和非洲可能在預測期內呈現最高的複合年成長率。
尿素市場趨勢
農業領域佔市場主導地位
- 尿素(NH2)2CO 是一種無色有機化合物,稱為碳醯胺。它在水中溶解度極高,pKa 接近零。全球90%以上的尿素產量被用作氮釋放肥料。在所有常用的固態氮肥中,尿素的氮含量最高(46.7%)。因此單位氮營養素的運輸成本最低。
- 在土壤中,它會水解成氨和二氧化碳。細菌將土壤中的氨氧化為硝酸鹽,可以被植物吸收。尿素也用於許多多組分固態肥料中。尿素在水中的溶解度很高,因此非常適合用作肥料溶液(與硝酸銨:UAN結合),例如作為「葉面」肥料。作為肥料,顆粒是首選,因為它們具有窄的粒徑分佈並且有利於機械施用。
- 氮肥是提高作物產量和收益的有效途徑,特別是在乾旱和濕潤地區。氮肥專門用作作物補充劑,主要用於農業收割。
- 根據世界銀行預測,2021年全球農林漁業總產值將達4.17兆美元,高於去年的3.72兆美元。
- 亞太地區目前高度依賴氮肥。然而,氮肥的使用、營養管理不善、土壤肥力下降、缺乏補充投入以及行銷和分銷系統薄弱是亞太地區農業部門令人擔憂的一些問題。未來幾年,氮肥需求可能主導該地區的化肥市場,並將繼續推動尿素市場的消費。
- 此外,農業是世界各地主要的生計來源。農業部門正在迅速成長,尤其是在印度和美國等國家。因此,預計預測期內對氨的需求將推動市場發展。
- 針對22會計年度,印度政府為農民設定了創紀錄的目標,即把糧食產量提高2%至3.0731億噸。 21 會計年度的產量為 3.0334 億噸,而目標為 3.01 億噸。因此,這些因素預計將增加對肥料的需求並推動市場研究。
- 此外,2021年美國農業年度出口量創下了歷史新高。根據美國商務部發布的2021年貿易資料,美國對全球農產品和食品出口總額達1,770億美元,比2020年總額高出18%。
- 近年來,拉丁美洲和加勒比地區的農業部門經歷了顯著的成長。根據經濟合作暨發展組織(OECD)和聯合國糧食及農業組織(FAO)的預測,預測期內農業和漁業產量預計將增加 17%。預計其中約 53% 的成長將來自於作物產量的成長。
亞太地區佔市場主導地位
- 亞太地區佔據最大的市場佔有率,其次是北美。
- 人口成長推動了印度和中國等國家的農業發展。這增加了氮肥的消耗並推動了市場發展。
- 除農業外,由於化學、汽車和醫療行業的發展,消費量也在增加。
- 在電價上漲和對糧食生產的擔憂日益加劇的背景下,中國政府部門對化肥出口商施加了新的障礙,並有可能加劇全球價格衝擊和食品通膨。
- 中國是全世界最大的脲醛樹脂生產國。脲醛樹脂在建築中用作黏合劑,黏合膠合板、塑合板和其他木製品。
- 根據國家統計局預測,2021年糧食產量預計為6.829億噸,比去年的6.5億噸增加2%。玉米種植面積比去年增加5%,產量增加4.6%。為了應對耕地面積的下降,用於提高生產率的肥料使用量正在增加,預計這將推動該國的市場發展。
- 2022年7-9月中國尿素出口量為84.9萬噸,高於2022年第一季的30.3萬噸及第二季的42.1萬噸。
- 中國是全球最重要的汽車生產基地,根據OICA統計,2021年汽車總產量達2,608萬輛,較去年的2,523萬輛成長3%。
- 2021年,印度4-7月零售化肥銷量較去年同期下降12.4%。所有常量營養素的銷量均下降,其中尿素降幅最高,為 12.8%。
- 根據印度肥料協會的數據,2020-21 年所有肥料產品的產量為 4,349 萬噸,比 2019-20 年增加 1.7%。 2020-21年尿素產量為2460萬噸,NP/NPK複合肥產量為932萬噸,SSP產量為492萬噸,分別比2019-20年成長0.6%、7.6%和15.8%。然而,DAP產量為377萬噸,同期大幅下降了17.1%。
- 此外,印度是世界上最大的汽車生產國之一。根據OICA統計,2021年該國汽車產量從去年同期的338萬輛成長30%至440萬輛。
工業級尿素產業概況
工業級尿素市場細分,該產業參與企業眾多,但全球生產能力佔有率較小。市場的主要參與企業包括 Industries Qatar、SABIC、OCI NV、Yara、CF Industries Holdings Inc. 等。
其他福利
- Excel 格式的市場預測 (ME) 表
- 3 個月的分析師支持
目錄
第 1 章 簡介
- 調查前提條件
- 研究範圍
第2章調查方法
第3章執行摘要
第4章 市場動態
- 驅動程式
- 工業級尿素適用性高
- 汽車產業需求增加
- 擴大肥料領域的應用
- 限制因素
- 重點區域濫用尿素
- 價格波動
- 產業價值鏈分析
- 波特五力分析
- 供應商的議價能力
- 消費者議價能力
- 新進入者的威脅
- 替代品的威脅
- 競爭程度
- 原料分析
- 技術簡介
- 生產流程
- 專利分析
- 進出口趨勢
- 監理政策分析
第5章 市場區隔(市場規模:數量)
- 年級
- 肥料
- 餵食
- 科技
- 最終用戶產業
- 農業
- 化學
- 車
- 醫療
- 其他
- 地區
- 亞太地區
- 中國
- 印度
- 日本
- 韓國
- 東南亞國協
- 其他亞太地區
- 北美洲
- 美國
- 加拿大
- 墨西哥
- 歐洲
- 德國
- 法國
- 英國
- 義大利
- 歐洲其他地區
- 南美洲
- 巴西
- 阿根廷
- 南美洲其他地區
- 中東和非洲
- 沙烏地阿拉伯
- 南非
- 其他中東和非洲地區
- 亞太地區
第6章 競爭格局
- 合併、收購、合資、合作和協議
- 市場佔有率(%)分析
- 主要企業策略
- 公司簡介
- Acron
- BASF SE
- CF Industries Holdings Inc.
- China National Petroleum Corporation
- Chambal Fertilisers & Chemicals Ltd
- EuroChem Group
- IFFCO
- Industries Qatar
- Koch Fertilizer LLC
- Notore Chemical Industries PLC
- Nutrien Ltd
- OCI
- Paradeep Phosphates Ltd
- Petrobras
- PT Pupuk Kalimantan Timur(PKT)
- SABIC
- The Chemical Company
- URALCHEM JSC
- Yara
- NATIONAL FERTILIZERS LIMITED
第7章 市場機會與未來趨勢
- 工業級尿素在環保建築的應用
The Industrial Grade Urea Market size is estimated at 195.37 million tons in 2025, and is expected to reach 213.71 million tons by 2030, at a CAGR of 1.81% during the forecast period (2025-2030).
Considering the COVID-19 pandemic situation, several countries were forced to go into lockdown, which led people to minimize the usage of personal vehicles. Additionally, automotive manufacturing plants were on a temporary halt, thus leading to a decline in the consumption of urea-based catalysts. However, the market recovered in 2021. It is expected to grow at a significant rate during the coming years.
Key Highlights
- Over the short term, the high applicability of technical grade urea, increasing demand from the automotive sector, and increasing usage in the fertilizer segment are expected to drive market growth.
- The indiscriminate use of urea in critical regions and fluctuation in prices are likely to hinder the market growth.
- The use of industrial grade urea in eco-friendly construction is likely to create opportunities for the market in the coming years.
- The Asia-Pacific region is expected to dominate the market. However, the Middle East and Africa is likely to witness the highest CAGR during the forecast period.
Urea Market Trends
Agriculture Segment to Dominate the Market
- Urea (NH2)2CO is a colorless organic chemical compound known as carbamide. It is highly soluble in water and has a pKa close to zero. More than 90% of the world's urea production is used as a nitrogen-release fertilizer. Urea has the highest nitrogen content of all solid nitrogenous fertilizers in common use (46.7%). Therefore, it has the lowest transportation costs per unit of nitrogen nutrients.
- In the soil, it hydrolyses back to ammonia and carbon dioxide. Bacteria oxidize the ammonia in the soil to nitrate, which the plants can absorb. Urea is also used in many multi-component solid fertilizer formulations. Urea is highly soluble in water, therefore, very suitable for use in fertilizer solutions (in combination with ammonium nitrate: UAN), e.g., in 'foliar feed' fertilizers. For fertilizer use, granules are preferred because of their narrower particle size distribution, an advantage for mechanical application.
- Nitrogen fertilizers are viable methods for expanding crop yield and profitability, particularly in the non-chernozem zone and moist areas. Nitrogen fertilizers are specially used as supplements for crops and are primarily utilized in the agriculture industry for harvesting.
- According to the World Bank, the total value of the agriculture, forestry, and fishing industries accounted for USD 4.17 trillion in 2021, compared to USD 3.72 trillion in the previous year.
- The Asia-Pacific region holds heavy reliance on nitrogenous fertilizers at present. However, the use of nitrogenous fertilizers, poor nutrition management, declining soil fertility, lack of complementary inputs, and weak marketing and distribution systems are some of the concerns in the Asia-Pacific agriculture sector. Regardless, the demand for nitrogenous fertilizer is still likely to dominate the fertilizer market in the region over the next few years, which is likely to continue driving the consumption of the urea market.
- Furthermore, agriculture is the primary source of livelihood across the globe. Countries such as India and the United States, among others, are witnessing positive growth in the agriculture sector. Hence, the demand for ammonia is expected to drive the market during the forecast period.
- For FY22, the Indian government has set a record target for farmers to raise food grain production by 2%, with 307.31 million tons of food grains. In FY21, production was recorded at 303.34 million tons against a target of 301 million tons. Thus, these factors are expected to increase the demand for fertilizers, driving the market studied.
- In addition, the American agricultural industry witnessed the highest annual export levels ever recorded in 2021. The 2021 trade data published by the Department of Commerce shows that exports of US farm and food products to the world totaled USD 177 billion, topping the 2020 total by 18%, driven by higher prices and larger quantities as global demand strengthens.
- The agriculture sector in Latin America and the Caribbean witnessed significant growth in the recent past. According to the Organization for Economic Co-operation and Development (OECD) and the Food and Agriculture Organization of the United Nations (FAO), agricultural and fisheries production is expected to grow by 17% during the forecast period. Around 53% of this growth is expected to come from an increase in crop production.
Asia-Pacific Region to Dominate the Market
- The Asia-Pacific region accounts for the highest market share, followed by North America.
- With the increase in population, developments in the agriculture industries are taking place in countries like India and China. This increases the consumption of nitrogen fertilizers, thereby driving the market.
- Apart from the agriculture industry, consumption is also increasing with the advancements in the chemical, automobile, and medical industries.
- Chinese authorities are imposing new hurdles for fertilizer exporters among growing concerns over surging power prices and food production, which could worsen a global price shock and food inflation.
- China is one of the largest producers of urea-formaldehyde resin in the world. The urea-formaldehyde resins are used in construction as adhesives for bonding plywood, particleboard, and other wood products.
- According to the National Bureau of Statistics, in 2021, grain production totaled 682.9 million tons, up from 650 million tons last year, registering an increase of 2%. Corn acreage rose 5 percent from last year, and output rose 4.6 percent. The growing use of fertilizers to increase productivity to keep up with the declining cultivated area is expected to drive the market in the country.
- China exported 849,000 tons of urea from July 2022 to September 2022, up from 303,000 tons and 421,000 tons during Q1 2022 and Q2 2022, respectively.
- According to the OICA, China has the world's most significant automotive production base, with a total vehicle production of 26.08 million units in 2021, registering an increase of 3% compared to 25.23 million units produced last year.
- In 2021, retail sales of fertilizers in India had fallen 12.4% in April-July over the four months of last year. All major nutrients have posted lower sales, and urea observed the highest decline of 12.8%.
- According to the Fertilizer Association of India, the production of total fertilizer products stood at 43.49 million MT during 2020-21, showing an increase of 1.7% over 2019-20. The production of urea stood at 24.60 million MT, NP/ NPK complex fertilizers at 9.32 million MT, and SSP at 4.92 million MT during 2020-21, recording an increase of 0.6%, 7.6%, and 15.8%, respectively, over 2019-20. However, production of DAP at 3.77 million MT witnessed a sharp decline of 17.1% during the same period.
- Furthermore, India is among the largest producer of automobiles in the world. According to OICA, the automotive production in the country stood at 4.4 million units in 2021, registering an increase of 30% compared to 3.38 million units produced in the same period last year.
Urea Industry Overview
The industrial grade urea market is fragmented, where many players, holding a small share in the global production capacity, have been operating in the industry. Some of the major players in the market include Industries Qatar, SABIC, OCI NV, Yara, and CF Industries Holdings Inc., among others.
Additional Benefits:
- The market estimate (ME) sheet in Excel format
- 3 months of analyst support
TABLE OF CONTENTS
1 INTRODUCTION
- 1.1 Study Assumptions
- 1.2 Scope of the Study
2 RESEARCH METHODOLOGY
3 EXECUTIVE SUMMARY
4 MARKET DYNAMICS
- 4.1 Drivers
- 4.1.1 High Applicability of Technical Grade Urea
- 4.1.2 Increasing Demand from the Automotive Sector
- 4.1.3 Increasing Usage in the Fertilizers Segment
- 4.2 Restraints
- 4.2.1 Indiscriminate Use of Urea in Key Regions
- 4.2.2 Fluctuation in the Prices
- 4.3 Industry Value Chain Analysis
- 4.4 Porter's Five Forces Analysis
- 4.4.1 Bargaining Power of Suppliers
- 4.4.2 Bargaining Power of Consumers
- 4.4.3 Threat of New Entrants
- 4.4.4 Threat of Substitute Products and Services
- 4.4.5 Degree of Competition
- 4.5 Feedstock Analysis
- 4.6 Technological Snapshot
- 4.6.1 Production Process
- 4.6.2 Patent Analysis
- 4.7 Import-Export Trends
- 4.8 Regulatory Policy Analysis
5 MARKET SEGMENTATION (Market Size in Volume)
- 5.1 Grade
- 5.1.1 Fertilizer
- 5.1.2 Feed
- 5.1.3 Technical
- 5.2 End-user Industry
- 5.2.1 Agriculture
- 5.2.2 Chemical
- 5.2.3 Automotive
- 5.2.4 Medical
- 5.2.5 Other End-user Industries
- 5.3 Geography
- 5.3.1 Asia-Pacific
- 5.3.1.1 China
- 5.3.1.2 India
- 5.3.1.3 Japan
- 5.3.1.4 South Korea
- 5.3.1.5 ASEAN Countries
- 5.3.1.6 Rest of Asia-Pacific
- 5.3.2 North America
- 5.3.2.1 United States
- 5.3.2.2 Canada
- 5.3.2.3 Mexico
- 5.3.3 Europe
- 5.3.3.1 Germany
- 5.3.3.2 France
- 5.3.3.3 United Kingdom
- 5.3.3.4 Italy
- 5.3.3.5 Rest of Europe
- 5.3.4 South America
- 5.3.4.1 Brazil
- 5.3.4.2 Argentina
- 5.3.4.3 Rest of South America
- 5.3.5 Middle-East and Africa
- 5.3.5.1 Saudi Arabia
- 5.3.5.2 South Africa
- 5.3.5.3 Rest of Middle-East and Africa
- 5.3.1 Asia-Pacific
6 COMPETITIVE LANDSCAPE
- 6.1 Mergers, Acquisitions, Joint Ventures, Collaborations, and Agreements
- 6.2 Market Share (%) Analysis
- 6.3 Strategies Adopted by Leading Players
- 6.4 Company Profiles
- 6.4.1 Acron
- 6.4.2 BASF SE
- 6.4.3 CF Industries Holdings Inc.
- 6.4.4 China National Petroleum Corporation
- 6.4.5 Chambal Fertilisers & Chemicals Ltd
- 6.4.6 EuroChem Group
- 6.4.7 IFFCO
- 6.4.8 Industries Qatar
- 6.4.9 Koch Fertilizer LLC
- 6.4.10 Notore Chemical Industries PLC
- 6.4.11 Nutrien Ltd
- 6.4.12 OCI
- 6.4.13 Paradeep Phosphates Ltd
- 6.4.14 Petrobras
- 6.4.15 PT Pupuk Kalimantan Timur (PKT)
- 6.4.16 SABIC
- 6.4.17 The Chemical Company
- 6.4.18 URALCHEM JSC
- 6.4.19 Yara
- 6.4.20 NATIONAL FERTILIZERS LIMITED
7 MARKET OPPORTUNITIES AND FUTURE TRENDS
- 7.1 Use of Industrial Grade Urea in Eco-friendly Construction
 尿素市場規模、佔有率和成長分析(按等級、類型、應用、地區):產業預測(2024-2031)
 尿素市場:依等級、形式、通路、應用分類 - 2025-2030 年全球預測
 包膜尿素市場報告:2030 年趨勢、預測與競爭分析
 全球尿素市場評估:依等級、形式、應用、地區、機會、預測(2017-2031)
 全球尿素市場:按等級、按應用、按最終用途行業、按產品類型、按技術、按技術、按地區 - 預測至 2029 年
 尿素市場:全球產業分析、規模、佔有率、成長、趨勢、預測,2024-2033
 2024-2032 年按等級、應用、最終用途產業和地區分類的尿素市場報告
 農用尿素市場報告:2030 年趨勢、預測與競爭分析
 顆粒尿素市場報告:2030 年趨勢、預測與競爭分析
 全球尿素生產能力和設備投資預測:2024年~2030年