


 |
市場調查報告書
商品編碼
1631569
美國火力發電 -市場佔有率分析、產業趨勢/統計、成長預測(2025-2030)US Thermal Power - Market Share Analysis, Industry Trends & Statistics, Growth Forecasts (2025 - 2030) |
||||||
※ 本網頁內容可能與最新版本有所差異。詳細情況請與我們聯繫。
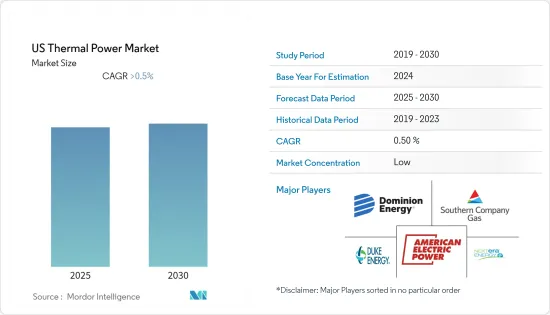
預計美國火力發電市場在預測期內的複合年成長率將超過 0.5%。
由於電力需求減少,COVID-19 爆發對市場產生了負面影響。目前市場已恢復至疫情前的水準。
美國火力發電市場預計將受到過去十年天然氣價格下跌的推動。此外,私人公司和一些州政府增加對火力發電廠的投資預計也將在預測期內推動美國火力發電市場。
然而,可再生能源價格的下降提供了經濟上可行的清潔替代能源,預計這將抑制市場成長。
提高發電工程的效率和減少有害排放可能會在未來開闢新的市場。
美國火力發電市場趨勢
天然氣預計將主導市場
- 天然氣是最清潔的燃料之一,可以經濟地以工業規模發電。在美國,燃氣發電已經開始取代燃煤發電,並預計在未來幾十年內完全取代。儘管再生能源投資預計將大幅成長,但燃氣發電提供的靈活性預計仍將受到需求。
- 天然氣發電廠的最大推動力之一是,當風能和太陽能等可再生能源不可靠時,天然氣發電廠可用作備用電源。天然氣發電廠可以快速開始運行,提高電網的可靠性。
- 到2021年,天然氣預計將成為美國最大的發電來源。全國天然氣發電量1,693.8兆瓦時,佔總發電量的38.4%。
- 美國頁岩油氣產量大幅增加,大幅降低美國對全球能源供應鏈的依賴。天然氣價格下降進一步支撐了天然氣發電市場的成長。
因此,鑑於上述幾點,天然氣產業很可能在預測期內主導市場成長。
火力發電投資增加可望帶動市場
- 在美國,建立火力發電廠的路徑因州而異。例如,加州以天然氣為主,但該州正在鼓勵電力公司以自然能源和其他能源取代天然氣發電廠。其他州,如中西部地區,正在採取更多以天然氣為基礎的方法來滿足其能源需求。
- 2021年,煤炭、天然氣、石油等能源來源約佔全國發電總量的63%。隨著時間的推移,特別是近年來,國家發電能源來源的組成發生了變化。
- 儘管燃煤發電量的佔有率逐漸下降,但由於燃氣電廠的增加,預計預測期內該國整體火力發電量將增加。
- 2022 年 7 月,密西根州西南部一座天然氣發電廠開始運作。該計劃耗資11億美元,由Kiewit公司建造,採用通用電氣公司的設備。
- 因此,鑑於以上幾點,火力發電投資的增加預計將在預測期內帶動美國火力發電市場。
美國火力發電產業概況
美國火力發電市場適度細分。該市場的主要企業(排名不分先後)包括 NextEra Energy, Inc.、Dominion Energy, Inc.、Duke Energy Corporation、Southern Company 和 American Electric Power Company, Inc.。
其他好處
- Excel 格式的市場預測 (ME) 表
- 3 個月分析師支持
目錄
第1章簡介
- 調查範圍
- 市場定義
- 研究場所
第2章調查方法
第3章執行摘要
第4章市場概況
- 介紹
- 火力發電結構(2022年)
- 火力發電容量(GW)(2028年)
- 火力發電量(太瓦時)(2022年)
- 美國運作中的火力發電廠數量(2022年)
- 2022年新增實際火力發電能力、取消及現有火力發電能力變化情形
- 到 2022 年基於石化燃料的公用事業規模發電機的容量係數(百分比)
- 最新趨勢和發展
- 政府法規和措施
- 市場動態
- 促進因素
- 抑制因素
- 供應鏈分析
- PESTLE分析
第5章 依供應來源分類的市場細分
- 煤炭
- 天然氣
- 油
第6章 競爭狀況
- 併購、合資、聯盟、協議
- 主要企業策略
- Companies Profiles
- NextEra Energy Inc.
- Dominion Energy Inc.
- Duke Energy Corporation
- Southern Company
- American Electric Power Company Inc.
- Exelon Corporation
- Xcel Energy Inc
- Public Service Enterprise Group Inc.
第7章 市場潛力及未來趨勢
The US Thermal Power Market is expected to register a CAGR of greater than 0.5% during the forecast period.
The market was negatively impacted by the outbreak of COVID-19 due to a decrease in electricity demand. The market has currently rebounded to pre-pandemic levels.
The United States thermal power market is expected to be driven by things like the price of natural gas going down over the past 10 years. Also, the increasing investments in thermal power plants from private firms and several state governments are expected to drive the United States thermal power market during the forecast period.
However, reducing the price of renewable energy has provided an economically viable cleaner alternative, which is expected to restrain the market's growth.
The improvements in efficiency and decreases in harmful emissions from thermal power projects are likely to open up new markets in the future.
US Thermal Power Market Trends
Natural Gas Expected to Dominate the Market
- Natural gas is among the cleanest fuels and can provide electricity at an industrial scale on an economically sound basis. Gas-fired power generation has already started to displace coal capacity in the country and is expected to replace it entirely in the coming decades. Although investments in renewables are expected to grow significantly, the flexibility afforded by gas-fired power generation is expected to continue to be in demand.
- Among the most significant drivers of the natural gas thermal power plants is their use as backup power for unreliability in renewable sources like wind and solar. Natural gas plants can start running on short notice, which can increase the utility grid's reliability.
- In 2021, natural gas was projected to be the largest source of electricity generation in the United States. The electricity generation from natural gas in the country was 1693.8 terawatt-hours, which accounted for 38.4% of the total electricity generated in the country.
- The country has seen a significant increase in shale oil and gas production, drastically reducing the United States' dependence on global energy supply chains. Reductions in natural gas prices have further aided the growth of the natural gas thermal power market.
Therefore, owing to the above points, the natural gas segment is likely to dominate market growth during the forecast period.
Increasing Investments in Thermal Power Expected to Drive the Market
- In the United States, different states are following different paths to establish thermal power plants. For example, the state of California is dominated by natural gas, but the state is pushing its utilities to replace natural gas power plants with renewables and other resources. Other states, like those in the Midwest, are following a more natural gas-based approach for their energy needs.
- In 2021, sources such as coal, natural gas, and petroleum accounted for around 63% of the country's total electricity generation mix. The mix of energy sources for the country's electricity generation changed over time, especially in recent years.
- Although the share of coal-fired power generation capacity is gradually decreasing, the increasing number of gas-fired power plants is expected to boost the country's overall thermal power generation capacity during the forecast period.
- In July 2022, a natural gas-fired power plant entered service in southwest Michigan. The cost of the project was USD 1.1 billion, and it was built by Kiewit Corporation and features equipment from General Electric.
- Therefore, owing to the above points, increasing thermal power investments are expected to drive the United States thermal power market during the forecast period.
US Thermal Power Industry Overview
The United States thermal power market is moderately fragmented. Some of the key players in this market (in no particular order) include NextEra Energy, Inc.; Dominion Energy, Inc.; Duke Energy Corporation; Southern Company; and American Electric Power Company, Inc.
Additional Benefits:
- The market estimate (ME) sheet in Excel format
- 3 months of analyst support
TABLE OF CONTENTS
1 INTRODUCTION
- 1.1 Scope of the Study
- 1.2 Market Definition
- 1.3 Study Assumptions
2 RESEARCH METHODOLOGY
3 EXECUTIVE SUMMARY
4 MARKET OVERVIEW
- 4.1 Introduction
- 4.2 Thermal Power Generation Mix, 2022
- 4.3 Thermal Power Installed Capacity and Forecast in GW, until 2028
- 4.4 Thermal Power Generation in TWh, till 2022
- 4.5 Number of Thermal Power Plants Operating in the United States, till 2022
- 4.6 Utility-Scale Capacity Additions, Retirements, and Changes to Existing Thermal Power Generation Capacity, 2022
- 4.7 Capacity Factors for Utility-Scale Generators Primarily Using Fossil Fuels, in %, till 2022
- 4.8 Recent Trends and Developments
- 4.9 Government Policies and Regulations
- 4.10 Market Dynamics
- 4.10.1 Drivers
- 4.10.2 Restraints
- 4.11 Supply Chain Analysis
- 4.12 PESTLE Analysis
5 MARKET SEGEMENTATION - BY SOURCE
- 5.1 Coal
- 5.2 Natural Gas
- 5.3 Petroleum
6 COMPETITIVE LANDSCAPE
- 6.1 Mergers and Acquisitions, Joint Ventures, Collaborations, and Agreements
- 6.2 Strategies Adopted by Leading Players
- 6.3 Companies Profiles
- 6.3.1 NextEra Energy Inc.
- 6.3.2 Dominion Energy Inc.
- 6.3.3 Duke Energy Corporation
- 6.3.4 Southern Company
- 6.3.5 American Electric Power Company Inc.
- 6.3.6 Exelon Corporation
- 6.3.7 Xcel Energy Inc
- 6.3.8 Public Service Enterprise Group Inc.

