


 |
市場調查報告書
商品編碼
1640451
ROV:市場佔有率分析、產業趨勢與統計、成長預測(2025-2030 年)ROV - Market Share Analysis, Industry Trends & Statistics, Growth Forecasts (2025 - 2030) |
||||||
價格
※ 本網頁內容可能與最新版本有所差異。詳細情況請與我們聯繫。
簡介目錄
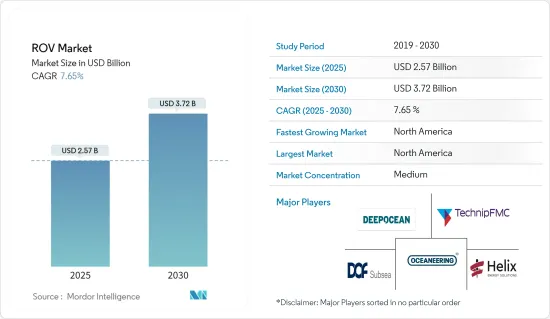
2025 年 ROV 市場規模預計為 25.7 億美元,預計到 2030 年將達到 37.2 億美元,預測期內(2025-2030 年)的複合年成長率為 7.65%。
關鍵亮點
- 預計預測期內,美洲、亞太地區、中東和非洲的海上石油和天然氣探勘活動的增加以及海洋可再生技術的發展將推動 ROV 市場的發展。
- 然而,預計多個地區對海上探勘和生產活動的禁令將抑制市場。
- 然而,正在進行的深水和超深水油氣發現以及頁岩氣探勘預計將在預測期內為 ROV 部署創造重大機會。
- 北美佔據全球市場主導地位,大部分需求來自美國和墨西哥。北美在開發先進、高機動性的 ROV 方面處於世界領先地位。
ROV 市場趨勢
石油和天然氣應用領域預計將佔據市場主導地位
- 世界主要經濟體仍然嚴重依賴石油產品,對石油和天然氣的依賴日益增加。石油和天然氣工業對國際政治和經濟有巨大影響。
- 根據《世界能源數據統計評論》預測,2022年全球石油產量為9,987.7萬桶/日,與前一年同期比較成長11.1%。世界人口的成長將反映出初級能源消耗的增加,從 2011 年的 520.90 艾焦耳增加到 2022 年的 604.04 艾焦耳。
- 根據石油輸出國組織(OPEC)的預測,2023年全球原油需求量(包括生質燃料)將達到1.0221億桶/日。資訊來源預測,年終,經濟活動和相關的石油需求將恢復,每日平均需求將增加1.04億桶以上。
- 碳氫化合物產業已經開發出適合海上條件的技術,可以成功發現和生產石油和天然氣。石油和天然氣鑽井鑽機可以在水深兩英里的水域作業。許多深水油井和管道系統依靠無人水下航行器進行安裝、檢查、維修和維護。
- 在過去的幾年中,遠程操作車輛(ROV)已經從一種具有小眾應用的新興技術發展成為石油和天然氣領域的廣泛應用。
- 全球對海上石油工業的資本投資也大幅增加,增加了對進行特定活動的各種先進技術、工具和設備的需求。這些工具包括有助於海上部門維護和檢查操作的 ROV。一些石油和天然氣公司正在投資 ROV 來支援海底勘測。
- 例如,2023 年 8 月,Energean 與總部位於阿伯丁的遠程操作車輛(ROV) 和服務全球供應商 ROVOP 簽訂了一份為期五年的 ROV 支援合約。該公司將在 Energean 的現場支援船 Energean Star(一艘改裝的平台供應船)上部署 ROV。
- ROV 的技術進步使其操作變得更容易、更有效率,從而推動了石油和天然氣行業的需求。
- 總體而言,由於海上石油和天然氣能源業務的快速成長,預計預測期內對 ROV 的需求將會增加。與遙控海上航行器相關的技術已經取得了多項改進。
北美可望主導市場
- 該地區是世界上最發達的海上石油和天然氣產業之一,主要集中在墨西哥灣和阿拉斯加近海的豐富蘊藏量。隨著鑽井深度逐年增加,蘊藏量也大幅增加,吸引了更多的投資。
- 隨著美國大力投資擴大其石油和天然氣生產能力,墨西哥灣已成為全球 ROV 需求的熱點。根據美國能源資訊署的數據,2022年,墨西哥灣沿岸的石油和天然氣產量約占美國原油總產量的15%。該地區是世界上海上鑽機部署密度最高的地區之一。該地區包括其他石油和天然氣基礎設施,包括生產和鑽探平臺、海上船舶和管道網路。
- 美國擁有世界上最大的國防預算,並且是ROV船舶研發的先驅。 2023年5月,美國宣布計劃投資高達51億美元購買高科技艦艇,用於巡邏深海並部署小型潛艇和無人機。預計此類投資將推動北美 ROV 市場的發展。
- 隨著 ROV 技術變得越來越便宜,美國石油和天然氣生產商正在投資 ROV 服務來獲取資料並對海底資產和水面進行日常維護操作。儘管其初始成本高於潛水作業,但 ROV 完成相同量的工作所需的時間更少,從而降低了計劃的整體 OPEX。
- 2024 年 5 月,美國海上服務公司 Edison Chouest 收購了位於阿伯丁的遠程操作車輛供應商 ROVOP。此次收購將使該公司的持有達到 100 多艘 ROV 和 6 艘自主水下航行器。預計該行業的此類活動將降低 ROV 的成本並提高其可靠性。
- 因此,北美ROV產業正在迅速發展。由於對海上建築和石油天然氣服務的需求不斷增加,推動該地區對 ROV 的需求,預計該行業將在預測期內繼續快速成長。
ROV行業概況
ROV 市場比較分散。市場的主要企業(不分先後順序)包括 DeepOcean AS、DOF Subsea AS、Oceaneering International Inc.、Helix Energy Solutions Group Inc. 和 TechnipFMC PLC。
其他福利
- Excel 格式的市場預測 (ME) 表
- 3 個月的分析師支持
目錄
第 1 章 簡介
- 研究範圍
- 市場定義
- 調查前提
第 2 章執行摘要
第3章調查方法
第4章 市場概況
- 介紹
- 2029 年市場規模及需求預測(十億美元)
- 最新趨勢和發展
- 政府法規和政策
- 市場動態
- 驅動程式
- 美洲、亞太、中東和非洲的海上石油和天然氣探勘活動增加
- 海上可再生技術的發展
- 限制因素
- 多地區禁止海上探勘生產活動
- 驅動程式
- 供應鏈分析
- 波特五力分析
- 供應商的議價能力
- 消費者議價能力
- 新進入者的威脅
- 替代品的威脅
- 競爭對手之間的競爭強度
第5章 市場區隔
- 類型
- 工人階級 ROV
- 觀察級 ROV
- 應用
- 石油和天然氣
- 防禦
- 其他
- 深海海洋探勘
- 活動
- 測量
- 檢查、維修和保養
- 埋葬和挖溝
- 其他活動
- 地區
- 北美洲
- 美國
- 加拿大
- 北美其他地區
- 歐洲
- 德國
- 丹麥
- 挪威
- 英國
- 義大利
- 北歐的
- 俄羅斯
- 法國
- 土耳其
- 歐洲其他地區
- 亞太地區
- 中國
- 印度
- 日本
- 澳洲
- 泰國
- 馬來西亞
- 印尼
- 越南
- 其他亞太地區
- 南美洲
- 巴西
- 阿根廷
- 哥倫比亞
- 南美洲其他地區
- 中東和非洲
- 沙烏地阿拉伯
- 阿拉伯聯合大公國
- 奈及利亞
- 南非
- 卡達
- 埃及
- 其他中東和非洲地區
- 北美洲
第6章 競爭格局
- 併購、合資、合作與協議
- 主要企業策略
- 公司簡介
- DeepOcean AS
- DOF Subsea AS
- Helix Energy Solutions Group Inc.
- TechnipFMC PLC
- Bourbon Corporation SA
- Fugro NV
- Oceaneering International Inc.
- Saab Seaeye Limited
- Forum Energy Technologies Inc.
- Saipem SpA
- Delta SubSea LLC
- ROVOP
- List of Other Prominent Players
- 市場排名/佔有率(%)分析
第7章 市場機會與未來趨勢
- 正在進行的深水和超深水油氣發現
簡介目錄
Product Code: 53122
The ROV Market size is estimated at USD 2.57 billion in 2025, and is expected to reach USD 3.72 billion by 2030, at a CAGR of 7.65% during the forecast period (2025-2030).
Key Highlights
- Increasing offshore oil and gas exploration activities in the Americas, Asia-Pacific, and Middle East and Africa and growing offshore renewable technologies are expected to drive the ROV market during the forecast period.
- On the other hand, the ban on offshore exploration and production activities in multiple regions is expected to restrain the market.
- However, the ongoing deepwater and ultra-deepwater oil and gas discoveries and shale gas explorations are expected to create huge opportunities for ROV deployment over the forecast period.
- North America dominated the market worldwide, with most of the demand coming from the United States and Mexico. North America is still leading the world with its advanced, highly maneuverable ROV development.
ROV Market Trends
The Oil & Gas Application Segment is Expected to Dominate the Market
- The dependence on oil and gas increases as major economies globally still rely heavily on petroleum-based products. The oil and gas industry displays immense influence in international politics and economics.
- According to the Statistical Review of World Energy Data, global oil production in 2022 was 99,877 thousand barrels per day, an increase of 11.1% over the previous year. The increase in global population reflected an increase in primary energy consumption, which stood at 604.04 exajoules in 2022, up from 520.90 exajoules in 2011.
- According to the Organization of the Petroleum Exporting Countries (OPEC), in 2023, the global demand for crude oil (including biofuels) amounted to 102.21 million barrels per day. The source expects economic activity and related oil demand to pick up by the end of the year, with the projections suggesting an increase of more than 104 million barrels per day.
- Many potential global reserves of hydrocarbons lie beneath the sea, and the hydrocarbon industry has developed techniques suited to the conditions found in offshore sites to find and produce oil and gas successfully. Oil and gas drilling rigs may operate in up to two miles of water depth. Many deepwater wells and pipeline systems rely on unmanned underwater vehicles to help perform installations, inspections, repairs, and maintenance.
- Over the past few years, remotely operated vehicles (ROV) have evolved from emerging technology with niche uses to extensive applications in the oil and gas sector.
- Capital expenditure in the offshore industry is also increasing significantly worldwide, thus boosting the demand for various advanced technologies, tools, and equipment to perform certain activities. These tools include the ROVs, as they ease the maintenance and inspection work in the offshore sector. Several oil and gas companies are investing in ROVs to support subsea surveys.
- For instance, in August 2023, Energean awarded a five-year ROV support contract to Aberdeen-based ROVOP, a global supplier of remotely operated vehicles (ROVs) and services. The company will deploy its ROVs onboard Energean's field support vessel, Energean Star, a converted platform supply vessel.
- Technological advancements in ROVs make their operations easier and more efficient, thus boosting their demand in the oil and gas industry.
- Overall, the demand for ROVs is expected to increase during the forecast period due to the rapidly growing offshore oil, gas, and energy operations. There have been several improvements in the technologies associated with remote-operated offshore vehicles.
North America is Expected to Dominate the Market
- The region has one of the most well-developed offshore oil and gas industries globally, with the primary areas of focus being the vast reserves in the Gulf of Mexico and the offshore Alaska region. With the drilling depths increasing over the years, the volume of technically recoverable reserves has also increased significantly, thus attracting more investments.
- As the United States invested heavily in expanding its oil and gas production capacity, the Gulf of Mexico has become a global hotspot for ROV demand. According to the US Energy Information Administration, in 2022, oil and natural gas production in the Federal Offshore Gulf of Mexico accounted for about 15% of total US crude oil production. The region has one of the highest global densities of offshore rig deployment. It comprises other oil and gas infrastructure, such as production and drilling platforms, marine vessels, and pipeline networks.
- The United States spends the most globally on its defense budget and has pioneered R&D on ROV vessels. In May 2023, the US Navy announced its plans to invest up to USD 5.1 billion in high-tech vessels that would patrol the deepest reaches of the ocean and deploy mini-subs and drones. Such types of investments are expected to drive the ROV market in North America.
- As ROV technology has become increasingly affordable, oil and gas producers in the United States are investing in ROV services to obtain data and perform routine maintenance work on subsea assets and surfaces. Despite the higher upfront cost compared to diving crews, ROVs need less time to complete the same amount of work, which reduces overall project OPEX.
- In May 2024, Edison Chouest, a US offshore services company, acquired Aberdeen-based remotely operated vehicle provider ROVOP. The deal will likely boost the company's fleet to over 100 ROVs and six autonomous underwater vehicles. Such activities in the industry are expected to reduce costs and increase ROV reliability.
- Thus, the ROV industry in North America is highly developed. As demand increases for marine construction and oil and gas services, the industry is expected to keep growing fast during the forecast period, thereby driving the demand for ROVs in the region.
ROV Industry Overview
The ROV market is semi-fragmented. Some of the major players in the market (in no particular order) include DeepOcean AS, DOF Subsea AS, Oceaneering International Inc., Helix Energy Solutions Group Inc., and TechnipFMC PLC.
Additional Benefits:
- The market estimate (ME) sheet in Excel format
- 3 months of analyst support
TABLE OF CONTENTS
1 INTRODUCTION
- 1.1 Scope of the Study
- 1.2 Market Definition
- 1.3 Study Assumptions
2 EXECUTIVE SUMMARY
3 RESEARCH METHODOLOGY
4 MARKET OVERVIEW
- 4.1 Introduction
- 4.2 Market Size and Demand Forecast in USD billion, till 2029
- 4.3 Recent Trends and Developments
- 4.4 Government Policies and Regulations
- 4.5 Market Dynamics
- 4.5.1 Drivers
- 4.5.1.1 Increasing Offshore Oil & Gas Exploration Activities in the Americas, Asia-Pacific, and Middle East and Africa
- 4.5.1.2 Growing Offshore Renewable Technologies
- 4.5.2 Restraints
- 4.5.2.1 Ban on Offshore Exploration and Production Activities in Multiple Regions
- 4.5.1 Drivers
- 4.6 Supply Chain Analysis
- 4.7 Porter's Five Forces Analysis
- 4.7.1 Bargaining Power of Suppliers
- 4.7.2 Bargaining Power of Consumers
- 4.7.3 Threat of New Entrants
- 4.7.4 Threat of Substitute Products and Services
- 4.7.5 Intensity of Competitive Rivalry
5 MARKET SEGMENTATION
- 5.1 Type
- 5.1.1 Work Class ROV
- 5.1.2 Observatory Class ROV
- 5.2 Application
- 5.2.1 Oil and Gas
- 5.2.2 Defense
- 5.2.3 Other Applications
- 5.2.4 Deep Sea Marine Exploration
- 5.3 Activity
- 5.3.1 Survey
- 5.3.2 Inspection, Repair, and Maintenance
- 5.3.3 Burial and Trenching
- 5.3.4 Other Activities
- 5.4 Geography
- 5.4.1 North America
- 5.4.1.1 United States
- 5.4.1.2 Canada
- 5.4.1.3 Rest of North America
- 5.4.2 Europe
- 5.4.2.1 Germany
- 5.4.2.2 Denmark
- 5.4.2.3 Norway
- 5.4.2.4 United Kingdom
- 5.4.2.5 Italy
- 5.4.2.6 NORDIC
- 5.4.2.7 Russia
- 5.4.2.8 France
- 5.4.2.9 Turkey
- 5.4.2.10 Rest of Europe
- 5.4.3 Asia-Pacific
- 5.4.3.1 China
- 5.4.3.2 India
- 5.4.3.3 Japan
- 5.4.3.4 Australia
- 5.4.3.5 Thailand
- 5.4.3.6 Malaysia
- 5.4.3.7 Indonesia
- 5.4.3.8 Vietnam
- 5.4.3.9 Rest of Asia-Pacific
- 5.4.4 South America
- 5.4.4.1 Brazil
- 5.4.4.2 Argentina
- 5.4.4.3 Colombia
- 5.4.4.4 Rest of South America
- 5.4.5 Middle East and Africa
- 5.4.5.1 Saudi Arabia
- 5.4.5.2 United Arab Emirates
- 5.4.5.3 Nigeria
- 5.4.5.4 South Africa
- 5.4.5.5 Qatar
- 5.4.5.6 Egypt
- 5.4.5.7 Rest of Middle East and Africa
- 5.4.1 North America
6 COMPETITIVE LANDSCAPE
- 6.1 Mergers and Acquisitions, Joint Ventures, Collaborations, and Agreements
- 6.2 Strategies Adopted by Leading Players
- 6.3 Company Profiles
- 6.3.1 DeepOcean AS
- 6.3.2 DOF Subsea AS
- 6.3.3 Helix Energy Solutions Group Inc.
- 6.3.4 TechnipFMC PLC
- 6.3.5 Bourbon Corporation SA
- 6.3.6 Fugro NV
- 6.3.7 Oceaneering International Inc.
- 6.3.8 Saab Seaeye Limited
- 6.3.9 Forum Energy Technologies Inc.
- 6.3.10 Saipem SpA
- 6.3.11 Delta SubSea LLC
- 6.3.12 ROVOP
- 6.4 List of Other Prominent Players
- 6.5 Market Ranking/Share (%) Analysis
7 MARKET OPPORTUNITIES AND FUTURE TRENDS
- 7.1 Ongoing Deepwater and Ultra-deepwater Oil and Gas Discoveries
02-2729-4219
+886-2-2729-4219
 北美採礦設備:市場佔有率分析、行業趨勢和統計、成長預測(2025-2030 年)
 海洋採礦市場 - 全球產業規模、佔有率、趨勢、機會和預測,按技術、金屬、地區和競爭細分,2020-2030 年預測
 採礦軟管市場報告:2031 年趨勢、預測與競爭分析
 全球採礦設備租賃市場:市場規模、佔有率和趨勢分析(按設備、產量、租賃類型、應用和地區)、按細分市場預測(2025-2030 年)
 非磁性合金鑽鋌的全球市場:實際成果與預測(2020年~2031年)
 採礦設備市場、規模、佔有率、趨勢、行業分析報告:依類型、推進力、產量、應用和地區 - 市場預測2025-2034
 2025-2033 年按採礦類型(長壁、房式和柱式)、應用(煤炭開採、金屬開採、礦物開採)和地區分類的地下採礦設備市場報告
 中東和非洲鑽鋌:市場佔有率分析、產業趨勢和成長預測(2025-2030 年)
 石油和天然氣膨脹封隔器 -市場佔有率分析、行業趨勢/統計、成長預測 (2025-2030)
 美國遙控潛水器:市場佔有率分析、產業趨勢、統計、成長預測(2025-2030)
▼