


 |
市場調查報告書
商品編碼
2123392
大螢幕顯示器:市場佔有率分析、行業趨勢和統計數據以及成長預測(2026-2031 年)Large Format Display - Market Share Analysis, Industry Trends & Statistics, Growth Forecasts (2026 - 2031) |
||||||

※ 本網頁內容可能與最新版本有所差異。詳細情況請與我們聯繫。
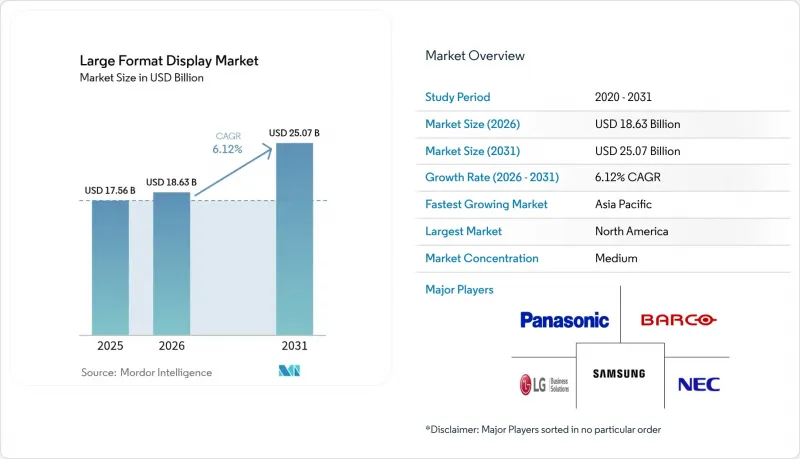
根據 Mordor Intelligence 預測,大型顯示器市場規模將從 2025 年的 175.6 億美元成長到 2026 年的 186.3 億美元,然後在 2031 年達到 250.7 億美元,2026 年至 2031 年的複合年成長率為 6.12%。
本報告按顯示類型(電視牆、獨立顯示器)、顯示尺寸(32-40吋、41-60吋、61-80吋、80吋及以上)、應用領域(室內、室外)、最終用戶(商業、基礎設施、機構、工業)和地區(北美、南美、歐洲、亞太、中東和非洲)進行細分。市場預測以美元計價。
全球大尺寸顯示器市場趨勢與洞察
高亮度、高效率LED電視牆解決方案的興起
覆晶板載晶片(COB)技術實現了符合IP67防護等級的耐用性、更低的散熱負載以及3840Hz的刷新率,從而降低了全天候運行的指揮中心顯示器的生命週期成本。飛利浦在2024年InfoComm展會上運作的Unite LED 5000系列採用高解析度P0.78通用陰極COB模組,將保固期從兩年延長至三年,並提供可選的五年服務計劃。三星長期以來在該領域的主導也得益於其在耐用性方面的類似投入,但亞洲晶圓廠硬體日益商品化正在擠壓利潤空間,迫使現有企業透過軟體支援來脫穎而出。即將推出的旨在降低待機功耗和網路待機功耗的歐盟法規將進一步推動節能型LED架構的發展。
零售業和智慧城市基礎設施對數位電子看板的需求激增
儘管零售媒體網路正在加速門市數位轉型,但店內螢幕的預算分配仍不足零售媒體總預算的1%,預計到2028年,光是美國零售商的營收就將成長6.9億美元。三星在2024年7月的市場定位報告中,將大型顯示器定位為智慧城市的“連接組織”,將導航、交通資訊和緊急訊息整合到一個統一的管理平台中。根據VIOOH 2024年的調查,近期27%的宣傳活動都採用了程序化數位戶外廣告(DOOH)購買,預計到2026年底,隨著廣告商對動態且數據豐富的廣告展示的需求不斷成長,這一比例將達到35%。亞太地區的地方政府已將類似功能納入公共競標,大型顯示器市場正從可自由支配的支出項目轉變為基礎設施預算項目。
安裝大型顯示器需要較高的初始資本支出 (Capex) 和總擁有成本 (TCO)。
以Captivision在首爾COEX Magok Le-West打造的16,000平方英尺透明媒體玻璃帷幕牆為例(該項目於2024年竣工),旗艦項目的成本可能超過800萬美元。這些成本包括結構加固、電力設備升級以及多年維護合約。像Acuity Brands這樣的整合商(該公司已同意以12.15億美元收購QSC)將視聽、照明和控制系統整合到承包工程中,並透過服務協議分攤成本。然而,中型企業和融資困難的市政當局往往會推遲專案或將部署限制在單一螢幕試驗計畫上,導致大螢幕顯示市場短期成長放緩。
細分市場分析
到2025年,電視牆將佔據大螢幕顯示器市場52.02%的佔有率,而獨立顯示器預計將以6.64%的複合年成長率(CAGR)實現最高成長率,直至2031年。儘管獨立大螢幕顯示器市場規模仍然較小,但在快餐店、企業大廳和資訊亭等對即插即用和模組化安裝要求極高的場所,其市場佔有率正在不斷成長。飛利浦的「Unite LED 5000系列」採用27.1吋16:9的箱體,可組合成8K畫面,既實現了電視牆的連續性,又兼具單面板的可維護性。 LG的118吋「MAGNIT Micro LED」為豪華酒店業提供了一種一體化解決方案,徹底解決了邊框管理的問題。
隨著COB LED成本的降低以及管理軟體在外形規格下的整合度不斷提高,效能與價格之間的差距正在縮小。三星的VXT和LG的Business Cloud能夠將多個地點的電視牆和獨立面板整合到一個統一的控制面板下,因此,差異化因素正轉向分析功能以及與廣告技術的整合。因此,系統整合商報告稱,託管服務合約數量有所增加,這一趨勢正推動大型顯示器市場持續成長。
預計到2031年,80英寸以上的面板將以6.53%的複合年成長率成長,成為所有尺寸範圍中成長最快的,這主要得益於虛擬製作舞台、控制室全屏顯示以及體驗式零售店外立面等應用的需求。相比之下,41-60吋的型號將在2025年佔據最大的市場佔有率,達到38.25%,這主要得益於企業小型討論空間和免下車菜單顯示器的需求。 TCL科技透露,其2024年的出貨量中有79%超過55英寸,這表明該公司已做好供應更大尺寸顯示器的準備。建築應用正在為尺寸範圍增加透明度和曲面設計。 Captivision的媒體玻璃和LG的透明OLED牆使設計師能夠融合數位世界和物理世界,從而在大尺寸顯示器市場中催生出一個高階細分市場。
能耗已成為監管的不確定因素。歐盟委員會即將推出的生態設計法規針對的是高亮度顯示器,而這個類別主要以80吋以上的面板為主。因此,供應商必須在不增加整體擁有成本的前提下,平衡發光輸出與更嚴格的能源效率標準。
區域分析
預計到2025年,北美將佔全球大螢幕顯示市場收入的35.25%,主要得益於混合辦公環境的發展、體育場館電視牆的維修以及零售媒體網路的擴張。達科電子(Daktronics)報告稱,在成功競標瑞銀中心(UBS Arena)和忠誠體育場(Allegiant Stadium)等場館項目後,其2025會計年度第一季實況活動業務收入成長了18%,達到1.09億美元。然而,大量的諮詢和IT相關支出對短期利潤率造成了壓力。在程式化戶外數位廣告(DOOH)領域,美國廣告主在2024年的平均支出成長了29%,加速了從靜態廣告看板向雲端管理螢幕的轉變。
預計到2031年,亞太地區的複合年成長率將達到6.68%,成長率高於其他任何地區。 TCL科技位於廣州的G8.6氧化物生產線在2024年全年全面運作,佔華星光電(CSOT)銷售額的21%,鞏固了中國在大尺寸LCD和LED基板領域的領先地位。韓國LG電子正在投資Mo-Sys Engineering,以整合Micro LED面板和XR攝影機追蹤技術,目標客戶是採用機內特特效技術的區域性工作室。印度的「智慧城市計畫」計畫在2027年於100個城市中心部署即時乘客資訊系統,但由於採購結構分散和資金限制,短期部署預計將受到限制。
歐洲正面臨一些最嚴峻的監管挑戰。歐盟委員會於2024年11月發佈公開徵求意見稿,旨在透過收緊待機功耗上限和強制要求可維修性,大幅降低每年銷售的7,000萬台電子顯示器的電力消耗。供應商將被要求使用回收材料並追蹤有害物質,這將提高市場進入門檻。德國、法國和英國正優先在多模態樞紐推廣數位電子看板,以兼具廣告功能的動態顯示器取代傳統的紙質時刻表。
儘管南美洲、中東和非洲的銷售額合計不足全球銷售額的10%,但它們蘊藏著巨大的長期成長潛力。在巴西和墨西哥,快餐菜單的數位化正在推進,但由於經濟形勢波動,投資受到限制。在阿拉伯聯合大公國和沙烏地阿拉伯,智慧城市預算正用於在機場和購物中心安裝身臨其境型外立面,作為旅遊推廣策略的一部分。在非洲部分地區,電力供應穩定性問題仍然限制了全天候運作,但安裝在電信業者塔上的顯示器正逐漸成為一種替代性的廣告平台。
其他好處:
- Excel格式的市場預測(ME)表
- 3個月的分析師支持
目錄
第1章:引言
- 研究假設和市場定義
- 調查範圍
第2章:調查方法
第3章執行摘要
第4章 市場狀況
- 市場概覽
- 市場促進因素
- 高亮度、高效率LED電視牆解決方案的興起
- 零售業和智慧城市基礎設施對數位電子看板的需求激增。
- 4K/8K 和互動顯示器在教育領域的普及以及公司間的合作。
- 大面積液晶/LED面板的每英吋成本更低
- 用於虛擬製作的 LED 設備供應量不斷增加,正在加速其在工作室中的應用。
- 基於人工智慧的雲端內容管理系統可實現即時內容個人化。
- 市場限制因素
- 大規模部署需要較高的初始資本投入和總擁有成本
- 來自行動和線上廣告管道的競爭日益激烈。
- 多面板牆的安裝和維護非常複雜
- 高亮度顯示器的新能源消耗法規
- 產業價值鏈分析
- 監理情勢
- 技術展望
- 波特五力分析
第5章 市場規模與成長預測
- 顯示類型
- 電視牆
- 獨立顯示器
- 按顯示尺寸
- 32-40英寸
- 41-60英寸
- 61-80英寸
- 80吋或更大
- 透過使用
- 室內的
- 戶外的
- 最終用戶
- 商業
- 基礎設施
- 對於機構和行業
- 按地區
- 北美洲
- 美國
- 加拿大
- 南美洲
- 巴西
- 墨西哥
- 阿根廷
- 其他南美國家
- 歐洲
- 德國
- 英國
- 法國
- 義大利
- 其他歐洲國家
- 亞太地區
- 中國
- 日本
- 印度
- 韓國
- 其他亞太國家
- 中東和非洲
- 中東
- 阿拉伯聯合大公國
- 沙烏地阿拉伯
- 其他中東國家
- 非洲
- 南非
- 奈及利亞
- 其他非洲國家
- 中東
- 北美洲
第6章 競爭情勢
- 市場集中度
- 策略趨勢
- 市佔率分析
- 公司簡介
- Samsung Electronics Co., Ltd.
- LG Display Co., Ltd.
- Sharp NEC Display Solutions, Ltd.
- Leyard Optoelectronic Co., Ltd.
- Barco NV
- Panasonic Holdings Corp.
- Sony Group Corp.
- AU Optronics Corp.
- TPV Technology Ltd.
- ViewSonic Corp.
- Christie Digital Systems USA, Inc.
- Daktronics, Inc.
- Absen Optoelectronic Co., Ltd.
- Unilumin Group Co., Ltd.
- Delta Electronics, Inc.
- AOTO Electronics Co., Ltd.
- Planar Systems, Inc.
- DynaScan Technology Corp.
- Koninklijke Philips NV
- BenQ Corp.
- E Ink Holdings, Inc.
- Prysm Systems, Inc.
第7章 市場機會與未來展望
According to Mordor Intelligence, the large format display market size is expected to grow from USD 17.56 billion in 2025 to USD 18.63 billion in 2026 and is forecast to reach USD 25.07 billion by 2031 at 6.12% CAGR over 2026-2031.
This report is Segmented by Display Type (Video Wall, Stand-Alone Display), Display Size (32-40 Inch, 41-60 Inch, 61-80 Inch, Above 80 Inch), Application (Indoor, and Outdoor), End-User (Commercial, Infrastructural, Institutional and Industrial), and Geography (North America, South America, Europe, Asia-Pacific, Middle East and Africa). The Market Forecasts are Provided in Terms of Value (USD).
Global Large Format Display Market Trends and Insights
Rise in High-Brightness, Energy-Efficient LED Video-Wall Solutions
Flip-chip chip-on-board (COB) technology is delivering IP67 durability, lower thermal loads, and 3,840 Hz refresh rates, cutting lifetime operating costs for 24/7 command-center displays. Philips' Unite LED 5000 Series, unveiled at InfoComm 2024, uses common-cathode COB modules as fine as P0.78 to extend warranty coverage from 2 to 3 years, with optional 5-year service plans. Samsung's long-running dominance likewise stems from similar durability investments, yet increasing commoditization across Asian fabs is compressing hardware margins and pushing incumbents to differentiate through software support offerings. Upcoming European Union draft rules aimed at reducing standby and network-standby power will further favor energy-optimized LED architectures.
Soaring Demand for Digital Signage in Retail and Smart-City Infrastructure
Retail-media networks are accelerating in-store digitization, but in-aisle screens still capture less than 1% of total retail-media budgets, translating into a USD 690 million upside for U.S. retailers alone by 2028. Samsung's July 2024 positioning frames large format displays as the connective tissue for smart cities, integrating wayfinding, transit alerts, and emergency messaging into one managed platform. VIOOH's 2024 study found 27% of recent campaigns included programmatic DOOH buys, a share likely to reach 35% by end-2026 as advertisers seek dynamic, data-enriched impressions. Municipal agencies in Asia-Pacific are already embedding similar functionality into public tenders, making the large format display market an infrastructure line item rather than a discretionary purchase.
High Initial Capex and Total Cost of Ownership for Large Format Installations
Flagship projects can exceed USD 8 million, as shown by Captivision's 16,000-square-foot transparent media-glass facade at COEX Magok Le-West in Seoul, completed in 2024. Costs encompass structural reinforcements, power upgrades, and multi-year maintenance contracts. Integrators such as Acuity Brands, which agreed to acquire QSC for USD 1.215 billion, are bundling audio-visual, lighting, and control systems into turnkey deals to amortize expenses over service contracts. Nevertheless, mid-market enterprises and cash-constrained municipalities often delay projects or limit deployments to single-screen pilot programs, slowing the near-term trajectory of the large format display market.
Other drivers and restraints analyzed in the detailed report include:
- Proliferation of 4K/8K and Interactive Displays Across Education and Corporate Collaboration
- AI-Driven, Cloud-Based CMS Enabling Real-Time Content Personalization
- Intensifying Competition from Mobile and Online Advertising Channels
For complete list of drivers and restraints, kindly check the Table Of Contents.
Segment Analysis
In 2025, video walls captured 52.02% of the large format display market share, while stand-alone displays are projected to achieve the fastest growth rate at 6.64% CAGR through 2031. The large format display market size for stand-alone units remains smaller but is gaining share in quick-service restaurants, corporate lobbies, and wayfinding kiosks, where drop-in replacement and modular mounting are paramount. Philips' Unite LED 5000 Series ships in 27.1-inch 16:9 cabinets that snap together into 8K canvases, blending video-wall continuity with single-panel serviceability. LG's 118-inch MAGNIT Micro LED provides an All-in-One alternative for luxury hospitality, circumventing bezel management altogether.
The performance-price gap is narrowing as COB LED costs fall and management software converges across form factors. Samsung's VXT and LG Business Cloud allow multi-site fleets to mix video walls and stand-alone panels under one dashboard, shifting differentiation to analytics and ad-tech hooks. Consequently, integrators report higher attach rates for managed-service contracts, a trend that elevates recurring revenue in the large format display market.
Panels exceeding 80 inches are on track to register a 6.53% CAGR to 2031, the quickest among size tiers, driven by virtual-production stages, control-room overviews, and experiential retail facades. In contrast, 41-60 inch models held the lion's share at 38.25% in 2025 thanks to corporate huddle spaces and drive-through menus. TCL Technology revealed that 79% of its 2024 shipments exceeded 55 inches, underscoring supply readiness for ever-larger canvases. Architectural installations add transparency and curvature to the size mix; Captivision's media glass and LG's Transparent OLED walls enable designers to meld digital and physical realms, feeding premium niches of the large format display market.
Energy consumption looms as a regulatory wildcard. The European Commission's forthcoming ecodesign rules target high-nit displays, a category dominated by panels larger than 80 inches. Vendors must therefore balance luminous output against stricter efficiency thresholds without inflating total cost of ownership.
Complete Report Scope:
- By Display Type
- Video Wall
- Stand-Alone Display
- By Display Size
- 32-40 inch
- 41-60 inch
- 61-80 inch
- Above 80 inch
- By Application
- Indoor
- Outdoor
- By End-User
- Commercial
- Infrastructural
- Institutional and Industrial
- By Geography
- North America
- United States
- Canada
- South America
- Brazil
- Mexico
- Argentina
- Rest of South America
- Europe
- Germany
- United Kingdom
- France
- Italy
- Rest of Europe
- Asia-Pacific
- China
- Japan
- India
- South Korea
- Rest of Asia-Pacific
- Middle East and Africa
- Middle East
- United Arab Emirates
- Saudi Arabia
- Rest of Middle East
- Africa
- South Africa
- Nigeria
- Rest of Africa
- Middle East
- North America
Geography Analysis
North America accounted for 35.25% of 2025 revenue in the large format display market, buoyed by hybrid-work upgrades, stadium video-wall renovations, and retail-media network rollouts. Daktronics reported an 18% spike in Live Events revenue to USD 109 million in Q1 FY2025 after winning arena projects such as UBS Arena and Allegiant Stadium, though heavy consulting and IT outlays compressed near-term margins. Programmatic DOOH saw U.S. advertisers boost spend by 29% on average in 2024, advancing the shift from static boards to cloud-managed screens.
Asia-Pacific is projected to log a 6.68% CAGR to 2031, the fastest of any region. TCL Technology's Guangzhou G8.6 oxide line ran at full capacity throughout 2024 and contributed 21% of CSOT revenue, cementing China's dominance in large format LCD and LED substrates. South Korea's LG Electronics invested in Mo-Sys Engineering to integrate Micro LED panels with XR camera tracking, targeting regional studios adopting in-camera VFX. India's Smart-City Mission plans to integrate real-time passenger information systems into 100 urban centers by 2027, though fragmented procurement and fiscal constraints moderate near-term volumes.
Europe faces the most stringent regulatory headwinds. The European Commission's November 2024 consultation aims to slash electricity use among the 70 million electronic displays sold annually by tightening standby-power caps and mandating repairability. Vendors must embed recycled content and substance-of-concern tracking, raising entry barriers. Germany, France, and the UK are prioritizing digital signage for multimodal transit hubs, converting legacy paper timetables to dynamic displays that double as advertising inventory.
South America and the Middle East and Africa collectively generate under 10% of global revenue but represent long-range opportunities. Brazil and Mexico are digitizing quick-service restaurant menus, yet economic volatility constrains capital spend. The UAE and Saudi Arabia allocate smart-city budgets to immersive facades in airports and malls aligned with tourism initiatives. Power-reliability issues in parts of Africa continue to limit 24/7 operation, though telco tower-side displays are emerging as alternative advertising nodes.
- Samsung Electronics Co., Ltd.
- LG Display Co., Ltd.
- Sharp NEC Display Solutions, Ltd.
- Leyard Optoelectronic Co., Ltd.
- Barco NV
- Panasonic Holdings Corp.
- Sony Group Corp.
- AU Optronics Corp.
- TPV Technology Ltd.
- ViewSonic Corp.
- Christie Digital Systems USA, Inc.
- Daktronics, Inc.
- Absen Optoelectronic Co., Ltd.
- Unilumin Group Co., Ltd.
- Delta Electronics, Inc.
- AOTO Electronics Co., Ltd.
- Planar Systems, Inc.
- DynaScan Technology Corp.
- Koninklijke Philips N.V.
- BenQ Corp.
- E Ink Holdings, Inc.
- Prysm Systems, Inc.
Additional Benefits:
- The market estimate (ME) sheet in Excel format
- 3 months of analyst support
TABLE OF CONTENTS
1 INTRODUCTION
- 1.1 Study Assumptions and Market Definition
- 1.2 Scope of the Study
2 RESEARCH METHODOLOGY
3 EXECUTIVE SUMMARY
4 MARKET LANDSCAPE
- 4.1 Market Overview
- 4.2 Market Drivers
- 4.2.1 Rise In High-Brightness, Energy-Efficient LED Video-Wall Solutions
- 4.2.2 Soaring Demand For Digital Signage In Retail And Smart-City Infrastructure
- 4.2.3 Proliferation Of 4K/8K And Interactive Displays Across Education And Corporate Collaboration
- 4.2.4 Cost-Per-Inch Decline Of Large-Area LCD/LED Panels
- 4.2.5 Virtual-Production LED Volumes Accelerating Studio Adoption
- 4.2.6 AI-Driven, Cloud-Based CMS Enabling Real-Time Content Personalization
- 4.3 Market Restraints
- 4.3.1 High Initial Capex And TCO For Large-Format Installations
- 4.3.2 Intensifying Competition From Mobile / Online Advertising Channels
- 4.3.3 Installation And Maintenance Complexity Across Multi-Panel Walls
- 4.3.4 Emerging Energy-Consumption Regulations For High-Nit Displays
- 4.4 Industry Value Chain Analysis
- 4.5 Regulatory Landscape
- 4.6 Technological Outlook
- 4.7 Porter's Five Forces Analysis
- 4.7.1 Threat of New Entrants
- 4.7.2 Bargaining Power of Suppliers
- 4.7.3 Bargaining Power of Buyers
- 4.7.4 Threat of Substitutes
- 4.7.5 Competitive Rivalry
5 MARKET SIZE AND GROWTH FORECASTS (VALUE)
- 5.1 By Display Type
- 5.1.1 Video Wall
- 5.1.2 Stand-Alone Display
- 5.2 By Display Size
- 5.2.1 32-40 inch
- 5.2.2 41-60 inch
- 5.2.3 61-80 inch
- 5.2.4 Above 80 inch
- 5.3 By Application
- 5.3.1 Indoor
- 5.3.2 Outdoor
- 5.4 By End-User
- 5.4.1 Commercial
- 5.4.2 Infrastructural
- 5.4.3 Institutional and Industrial
- 5.5 By Geography
- 5.5.1 North America
- 5.5.1.1 United States
- 5.5.1.2 Canada
- 5.5.2 South America
- 5.5.2.1 Brazil
- 5.5.2.2 Mexico
- 5.5.2.3 Argentina
- 5.5.2.4 Rest of South America
- 5.5.3 Europe
- 5.5.3.1 Germany
- 5.5.3.2 United Kingdom
- 5.5.3.3 France
- 5.5.3.4 Italy
- 5.5.3.5 Rest of Europe
- 5.5.4 Asia-Pacific
- 5.5.4.1 China
- 5.5.4.2 Japan
- 5.5.4.3 India
- 5.5.4.4 South Korea
- 5.5.4.5 Rest of Asia-Pacific
- 5.5.5 Middle East and Africa
- 5.5.5.1 Middle East
- 5.5.5.1.1 United Arab Emirates
- 5.5.5.1.2 Saudi Arabia
- 5.5.5.1.3 Rest of Middle East
- 5.5.5.2 Africa
- 5.5.5.2.1 South Africa
- 5.5.5.2.2 Nigeria
- 5.5.5.2.3 Rest of Africa
- 5.5.5.1 Middle East
- 5.5.1 North America
6 COMPETITIVE LANDSCAPE
- 6.1 Market Concentration
- 6.2 Strategic Moves
- 6.3 Market Share Analysis
- 6.4 Company Profiles (includes Global level Overview, Market level overview, Core Segments, Financials as available, Strategic Information, Market Rank/Share, Products and Services, Recent Developments)
- 6.4.1 Samsung Electronics Co., Ltd.
- 6.4.2 LG Display Co., Ltd.
- 6.4.3 Sharp NEC Display Solutions, Ltd.
- 6.4.4 Leyard Optoelectronic Co., Ltd.
- 6.4.5 Barco NV
- 6.4.6 Panasonic Holdings Corp.
- 6.4.7 Sony Group Corp.
- 6.4.8 AU Optronics Corp.
- 6.4.9 TPV Technology Ltd.
- 6.4.10 ViewSonic Corp.
- 6.4.11 Christie Digital Systems USA, Inc.
- 6.4.12 Daktronics, Inc.
- 6.4.13 Absen Optoelectronic Co., Ltd.
- 6.4.14 Unilumin Group Co., Ltd.
- 6.4.15 Delta Electronics, Inc.
- 6.4.16 AOTO Electronics Co., Ltd.
- 6.4.17 Planar Systems, Inc.
- 6.4.18 DynaScan Technology Corp.
- 6.4.19 Koninklijke Philips N.V.
- 6.4.20 BenQ Corp.
- 6.4.21 E Ink Holdings, Inc.
- 6.4.22 Prysm Systems, Inc.
7 MARKET OPPORTUNITIES AND FUTURE OUTLOOK
- 7.1 White-Space and Unmet-Need Assessment

 大型顯示器市場-2026-2032年全球市場預測
 全球大尺寸顯示器市場規模、佔有率、趨勢及成長分析報告(2026-2034)
 大型顯示器市場分析及至2035年預測:類型、產品、服務、技術、組件、應用、形式、最終用戶、功能、安裝形式按類型、材料、銷售管道、應用、最終用途產業和安裝類型分類的卡扣式燈箱市場,全球預測(2026-2032年)
 2026年全球大螢幕顯示器市場報告
 大尺寸顯示器市場-全球產業規模、佔有率、趨勢、機會和預測,按技術、螢幕尺寸、最終用戶、地區和競爭格局分類,2020-2030 年預測
 2032 年大尺寸顯示器市場預測:按顯示器類型、顯示器尺寸、解析度、亮度等級、技術、應用、最終用戶和地區進行的全球分析
 大尺寸尺寸顯示器市場規模、佔有率、趨勢分析報告:按顯示器類型、技術、顯示器尺寸、最終用途、地區、細分市場預測,2025-2030 年
 大型顯示器的全球市場:成長,未來展望,競爭分析 (2024年~2032年)