


 |
市場調查報告書
商品編碼
1645105
碳計量:市場佔有率分析、行業趨勢和統計、成長預測(2025-2030 年)Carbon Accounting - Market Share Analysis, Industry Trends & Statistics, Growth Forecasts (2025 - 2030) |
||||||
價格
※ 本網頁內容可能與最新版本有所差異。詳細情況請與我們聯繫。
簡介目錄
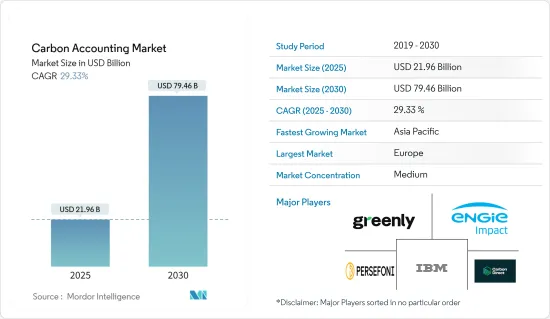
2025年碳計量市場規模預估為219.6億美元,預計2030年將達794.6億美元,預測期間(2025-2030年)複合年成長率為29.33%。
關鍵亮點
- 從中期來看,企業對實現永續性目標的日益關注以及碳排放測量和控制的嚴格法規和合規性等因素預計將成為預測期內碳計量市場最重要的促進因素。
- 另一方面,預計在預測期內,準確計算和實施碳計量方法的資料收集的複雜性將對市場構成威脅。
- 然而,在開發更具創新性和效率的碳計量方法和軟體方面,我們仍在不斷取得進展。預計這一因素將在未來幾年為市場創造許多機會。
- 亞太地區佔據市場主導地位,並可能在預測期內實現最高的複合年成長率。中國、印度、日本和其他國家由於其工業和基礎設施發展活動的不斷增加而推動市場的發展。
碳計量市場趨勢
電力業務部門實現大幅成長
- 電力產業是碳計量最重要的產業之一,因為它是溫室氣體排放的重要來源。這些產業嚴重依賴石油、煤炭和天然氣等石化燃料發電。這些排放排放了大量的溫室氣體,因此這些公司必須進行碳計量,以遵守監管和合規要求,並向投資者和相關人員提供資訊。
- 開發商將進行廣泛的碳計量,以識別高排放源,並制定策略和政策來應對增加和減少排放。這些策略和政策包括投資再生能源來源、提高效率、實施碳捕獲技術和採用更清潔的石化燃料技術。碳計量評估發電設施、輸配電系統和基礎設施等複雜營運組成部分的碳足跡,從而確定工作優先順序並最佳化資源。
- 國際可再生能源機構表示,全球減少碳排放、採用更清潔能源來源的迫切需要,正推動主要企業大力投資開發可再生能源發電計劃,大幅增加可再生能源裝置容量。 2023年全球可再生能源裝置容量約為3,869.7 GW,而2022年為3,396.32 GW,成長率約14%。
- 此外,碳計量為公用事業提供了重要資料,以評估和減輕氣候變遷的風險,包括潛在的供應中斷、基礎設施損壞和消費者需求變化。這將為低碳未來的長期、有彈性的規劃和永續的投資決策提供資訊。
- 例如,2024年3月,領先的可再生能源計劃開發商和營運商GE Vernova宣布將在Globeleq位於象牙海岸共和國的Azito Energie SA發電廠部署碳計量軟體。該電廠是該國最大的天然氣發電廠。 GE Vernova希望該軟體能為其提供必要的碳排放資訊,並確定資訊來源,以開發更有效率的流程和設備。
- 因此,如上所述,預計發電業務部門在預測期內將呈現顯著的成長率。
亞太地區佔市場主導地位
- 預計未來幾年亞太地區將主導全球碳計量市場。受快速工業化、人口成長和應對氣候變遷日益緊迫的影響,該地區主要依靠石化燃料來滿足其能源需求。中國、印度、日本和東南亞國家等製造業中心和新興經濟體是全球溫室氣體排放的主要貢獻者。然而,這些國家正積極追求永續發展目標並採取措施抑制碳排放。
- 亞太地區不斷成長的工業活動和能源需求推動了對強力的碳計量實踐的需求,以準確測量、報告並最終減少排放。在該地區營運的跨國公司面臨日益嚴格的環境法規和報告要求,推動了先進碳計量系統的採用。此外,該地區非常重視發展太陽能和風能等可再生能源,迫切需要進行全面的碳生命週期分析來量化排放。
- 2023年11月,中國政府宣布打算取消對外商投資製造業的限制,顯示中國持續致力於歡迎外商投資企業。預計這項進步措施將促進中國製造業的成長,影響整個製造業,並在預測期內推動碳計量市場的發展。
- 此外,亞太市場在新乾淨科技、基礎設施升級以及一系列其他清潔能源解決方案產品和計劃正在經歷重大發展和投資。這需要採用碳計量方法來追蹤和減少碳排放並識別資源效率低下。這就是為什麼我們正在與各種國際公司合作並開發更準確的碳計量方法。亞太地區消費者和相關人員的環保意識不斷增強,進一步推動了企業對透明碳報告的需求。
- 電池、汽車、儀器設備等製造業的規模化發展,為國際市場參與企業發展面向各行業的碳計量服務供應商、軟體開發商和諮詢公司創造了巨大的機會。
- 因此,預計亞太地區將在預測期內佔據主導地位。
碳計量產業概況
全球碳計量市場是半靜態的。該市場的主要企業(不分先後順序)包括 Greenly、國際商業機器公司、ENGIE Impact、Persefoni AI 和 Carbon Direct。
其他福利
- Excel 格式的市場預測 (ME) 表
- 3 個月的分析師支持
目錄
第 1 章 簡介
- 研究範圍
- 市場定義
- 調查前提
第 2 章執行摘要
第3章調查方法
第4章 市場概況
- 介紹
- 至2029年的市場規模及需求預測(單位:美元)
- 最新趨勢和發展
- 政府法規和政策
- 市場動態
- 驅動程式
- 企業永續性目標
- 嚴格監理與合規
- 限制因素
- 碳計量的複雜性
- 驅動程式
- 供應鏈分析
- 產業吸引力-波特五力分析
- 供應商的議價能力
- 消費者議價能力
- 新進入者的威脅
- 替代品的威脅產品/服務
- 競爭對手之間的競爭
第5章 市場區隔
- 市場類型
- 雲端基礎
- 本地
- 最終用戶
- 石油和天然氣
- 電力業務
- 建築基礎設施
- 通訊
- 飲食
- 其他
- 2029 年市場規模與需求預測(按地區)
- 北美洲
- 美國
- 加拿大
- 北美其他地區
- 歐洲
- 德國
- 法國
- 英國
- 義大利
- 西班牙
- 北歐的
- 俄羅斯
- 土耳其
- 歐洲其他地區
- 亞太地區
- 中國
- 印度
- 澳洲
- 日本
- 韓國
- 馬來西亞
- 泰國
- 印尼
- 越南
- 其他亞太地區
- 中東和非洲
- 沙烏地阿拉伯
- 阿拉伯聯合大公國
- 奈及利亞
- 埃及
- 卡達
- 南非
- 其他中東和非洲地區
- 南美洲
- 巴西
- 阿根廷
- 哥倫比亞
- 南美洲其他地區
- 北美洲
第6章 競爭格局
- 併購、合資、合作與協議
- 主要企業策略
- 公司簡介
- Greenly
- International Business Machines Corporation
- ENGIE Impact
- Persefoni AI
- Normative
- Carbon Direct
- Sphera
- Emitwise
- SINAI Technologies
- Diligent Corporation
- 市場排名/佔有率分析
第7章 市場機會與未來趨勢
- 開發創新的碳計量解決方案
簡介目錄
Product Code: 50002216
The Carbon Accounting Market size is estimated at USD 21.96 billion in 2025, and is expected to reach USD 79.46 billion by 2030, at a CAGR of 29.33% during the forecast period (2025-2030).
Key Highlights
- Over the medium term, factors such as growing corporate focus on achieving their sustainability goals and increasing stringent regulations and compliances over carbon emission measuring and regulations are expected to be among the most significant drivers for the carbon accounting market during the forecast period.
- On the other hand, the complexity of accumulating data and implementing carbon accounting methodology for accurate calculation is high, which is expected to pose a threat to the market during the forecast period.
- However, continued advancements in developing more innovative and efficient carbon accounting methodologies and software are ongoing. This factor is expected to create several opportunities for the market in the future.
- Asia-Pacific dominates the market and will likely register the highest CAGR during the forecast period. China, India, Japan, and others drive it due to the growing number of industries and infrastructural development activities in these countries.
Carbon Accounting Market Trends
The Power Utilities Segment to Witness Significant Growth
- The power utilities end-user segment is one of the most essential industries for carbon accounting as these segments are significant contributors to greenhouse gas emissions. These industries heavily rely on fossil fuels such as oil, coal, and natural gas for power generation. These sources are heavy emitters of greenhouse gases, which makes carbon accounting necessary for these companies to comply with the regulations and compliance requirements, along with informing investors and stakeholders.
- Utilities will identify the highest emitting sources by conducting extensive carbon accounting practices and developing strategies and policies to counter the growth and reduce emissions. These strategies and policies can include investing in renewable energy sources, improving efficiency, implementing carbon capture technologies, or adopting cleaner fossil fuel technology. Carbon accounting allows for assessing the carbon footprint across complex operational components like generation facilities, transmission/distribution systems, and supporting infrastructure, prioritizing efforts and optimizing resources.
- According to the International Renewable Energy Agency, the global imperative of reducing carbon emissions and adopting cleaner energy sources has led significant power utility companies to invest heavily in developing renewable energy power projects, significantly increasing the renewable energy installed capacity. In 2023, the global renewable energy installed capacity was around 3869.7 GW compared to 3396.32 GW in 2022, registering a growth rate of approximately 14%.
- Moreover, carbon accounting provides power utilities with crucial data to assess and mitigate risks posed by climate change, such as potential supply disruptions, infrastructure damage, and shifting consumer demands. This informs long-term resilient planning and sustainable investment decisions for a low-carbon future.
- For instance, in March 2024, GE Vernova, a primary renewable energy project developer and operator, announced that it would deploy carbon accounting software in Globeleq's Azito Energie S.A. power plant in Cote D'Ivoire. This is the largest natural gas power plant in the country. GE Vernova expects the software to provide necessary information on carbon emissions and identify sources to develop more efficient processes and equipment.
- Therefore, as mentioned above, the power utilities segment is expected to witness a significant growth rate during the forecast period.
Asia-Pacific to Dominate the Market
- Asia-Pacific will dominate the global carbon accounting market in the coming years. It is driven by rapid industrialization, population growth, and the increasing urgency to address climate change, as the region predominantly relies on fossil fuels to meet its energy demands. As manufacturing hubs and developing economies, countries like China, India, Japan, and Southeast Asian nations are major contributors to global greenhouse gas emissions. However, they are also actively pursuing sustainable development goals and implementing policies to curb their carbon footprints.
- The growing intensity of industrial activities and energy demands across Asia-Pacific drives the demand for robust carbon accounting practices to accurately measure, report, and ultimately reduce emissions. Multinational corporations operating in the region face stricter environmental regulations and reporting requirements, driving the adoption of sophisticated carbon accounting systems. Additionally, the region's focus on renewable energy development, such as solar and wind power, creates a pressing need for comprehensive carbon lifecycle analysis to quantify emissions savings.
- In November 2023, the Chinese government declared its intention to eliminate all restrictions on foreign involvement in manufacturing, showcasing the nation's ongoing commitment to embracing foreign enterprises. This progressive step is anticipated to foster growth in the Chinese manufacturing sector, subsequently influencing the overall manufacturing landscape and propelling the carbon accounting market forward during the forecast period.
- Moreover, the Asia-Pacific market has witnessed significant developments and investments in new clean technologies, infrastructure upgrades, and various other clean energy solution products and projects. This necessitates adopting carbon accounting methods to track and reduce carbon emissions and identify inefficient resources. This has led to collaboration with various international players and the development of more precise carbon accounting methodologies. The rising environmental consciousness among consumers and stakeholders in Asia-Pacific further fuels companies' demand for transparent carbon reporting.
- The large-scale development of manufacturing industries, such as batteries, automobiles, instruments, and equipment, presents enormous opportunities for international market players to explore carbon accounting service providers, software developers, and consulting firms catering to diverse industries.
- Thus, the Asia-Pacific region is expected to dominate the market segment during the forecast period.
Carbon Accounting Industry Overview
The global carbon accounting market is semi-consolidated. Some key players in this market (in no particular order) include Greenly, International Business Machines Corporation, ENGIE Impact, Persefoni AI, and Carbon Direct.
Additional Benefits:
- The market estimate (ME) sheet in Excel format
- 3 months of analyst support
TABLE OF CONTENTS
1 INTRODUCTION
- 1.1 Scope of the Study
- 1.2 Market Definition
- 1.3 Study Assumptions
2 EXECUTIVE SUMMARY
3 RESEARCH METHODOLOGY
4 MARKET OVERVIEW
- 4.1 Introduction
- 4.2 Market Size and Demand Forecast in USD, till 2029
- 4.3 Recent Trends and Developments
- 4.4 Government Policies and Regulations
- 4.5 Market Dynamics
- 4.5.1 Drivers
- 4.5.1.1 Corporate Sustainability Goals
- 4.5.1.2 Stringent Regultions and Compliance
- 4.5.2 Restraints
- 4.5.2.1 High Complexity in Carbon Accounting
- 4.5.1 Drivers
- 4.6 Supply Chain Analysis
- 4.7 Industry Attractiveness - Porter's Five Forces Analysis
- 4.7.1 Bargaining Power of Suppliers
- 4.7.2 Bargaining Power of Consumers
- 4.7.3 Threat of New Entrants
- 4.7.4 Threat of Substitutes Products and Services
- 4.7.5 Intensity of Competitive Rivalry
5 MARKET SEGMENTATION
- 5.1 Type
- 5.1.1 Cloud Based
- 5.1.2 On Premise
- 5.2 End Users
- 5.2.1 Oil and Gas
- 5.2.2 Power Utilities
- 5.2.3 Construction and Infrastructure
- 5.2.4 Telecommunication
- 5.2.5 Food and Beverages
- 5.2.6 Other End Users
- 5.3 Geography [Market Size and Demand Forecast till 2029 (for Regions Only)]
- 5.3.1 North America
- 5.3.1.1 United States
- 5.3.1.2 Canada
- 5.3.1.3 Rest of North America
- 5.3.2 Europe
- 5.3.2.1 Germany
- 5.3.2.2 France
- 5.3.2.3 United Kingdom
- 5.3.2.4 Italy
- 5.3.2.5 Spain
- 5.3.2.6 NORDIC
- 5.3.2.7 Russia
- 5.3.2.8 Turkey
- 5.3.2.9 Rest of Europe
- 5.3.3 Asia-Pacific
- 5.3.3.1 China
- 5.3.3.2 India
- 5.3.3.3 Australia
- 5.3.3.4 Japan
- 5.3.3.5 South Korea
- 5.3.3.6 Malaysia
- 5.3.3.7 Thailand
- 5.3.3.8 Indonesia
- 5.3.3.9 Vietnam
- 5.3.3.10 Rest of Asia-Pacific
- 5.3.4 Middle East and Africa
- 5.3.4.1 Saudi Arabia
- 5.3.4.2 United Arab Emirates
- 5.3.4.3 Nigeria
- 5.3.4.4 Egypt
- 5.3.4.5 Qatar
- 5.3.4.6 South Africa
- 5.3.4.7 Rest of Middle East and Africa
- 5.3.5 South America
- 5.3.5.1 Brazil
- 5.3.5.2 Argentina
- 5.3.5.3 Colombia
- 5.3.5.4 Rest of South America
- 5.3.1 North America
6 COMPETITIVE LANDSCAPE
- 6.1 Mergers and Acquisitions, Joint Ventures, Collaborations, and Agreements
- 6.2 Strategies Adopted by Leading Players
- 6.3 Company Profiles
- 6.3.1 Greenly
- 6.3.2 International Business Machines Corporation
- 6.3.3 ENGIE Impact
- 6.3.4 Persefoni AI
- 6.3.5 Normative
- 6.3.6 Carbon Direct
- 6.3.7 Sphera
- 6.3.8 Emitwise
- 6.3.9 SINAI Technologies
- 6.3.10 Diligent Corporation
- 6.4 Market Ranking/Share Analysis
7 MARKET OPPORTUNITIES AND FUTURE TRENDS
- 7.1 Development of Innovative Carbon Accounting Solutions
02-2729-4219
+886-2-2729-4219
 碳會計軟體市場規模、佔有率、趨勢及預測(按部署、產業和地區),2025 年至 2033 年
 2025年碳計量軟體全球市場報告
 2025年雲端碳管理系統全球市場報告
 全球能源與公用事業碳管理系統市場研究報告-產業分析、規模、佔有率、成長、趨勢與預測 2025 年至 2033 年
 2025 年智慧碳全球市場報告
 各產業碳管理解決方案的採用:東南亞
 2025-2033 年按組件、應用、產業和地區分類的碳管理軟體市場
 碳管理系統 -市場佔有率分析、產業趨勢/統計、成長預測(2025-2030)
 碳計量軟體市場,全球 2025-2029
 碳管理系統市場機會、成長動力、產業趨勢分析與 2025 - 2034 年預測
▼