


 |
市場調查報告書
商品編碼
1851030
託管列印服務:市場佔有率分析、行業趨勢、統計數據和成長預測(2025-2030 年)Managed Print Services - Market Share Analysis, Industry Trends & Statistics, Growth Forecasts (2025 - 2030) |
||||||
※ 本網頁內容可能與最新版本有所差異。詳細情況請與我們聯繫。
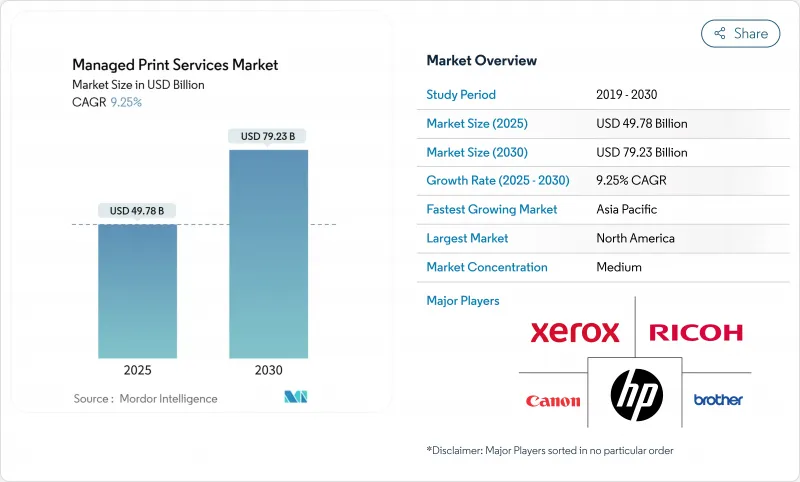
根據估計和預測,到 2025 年,託管列印服務市場規模將達到 497.8 億美元,到 2030 年將達到 792.3 億美元,年複合成長率為 9.25%。
雲端連接、混合辦公基礎設施和訂閱定價模式正在推動越來越多的大型企業和中小企業採用預測性維護技術。安全可靠的設備群、即時物聯網診斷和自動耗材補充對於降低整體擁有成本和減少非計劃性停機時間至關重要。需求也反映了永續性的要求,這些要求獎勵那些能夠量化雙面列印使用率、減少碳排放和減少紙張廢棄物的供應商。隨著以硬體為中心的傳統企業努力捍衛市場佔有率,對抗專注於人工智慧主導最佳化、整合分析、工作流程自動化和設備即服務(DaaS)的參與企業,競爭格局正在改變。亞太地區的成長勢頭最為顯著,該地區的大型製造企業和出口導向型企業將預測性維護視為提高營運效率的關鍵因素。
全球託管列印服務市場趨勢與洞察
最佳化遠距辦公列印基礎設施,推動北美MPS(管理列印服務)的普及
混合辦公模式使得分散式列印成為成本和安全隱患,迫使企業將裝置管理集中到雲端。為了在支援員工在總部、分公司和家中進行列印的同時確保合規性,企業正在採用安全列印發布、用戶身份驗證和加密作業路由等措施。夏普 Synappx 雲端列印解決方案正是為了滿足這一需求而生,它僅保留作業元元資料,旨在強化美國金融機構和醫療保健系統所推崇的零信任原則。訂閱定價模式允許用戶按需付費,無需伺服器維護,並提供儀表板來衡量永續性指標。
永續性和碳足跡要求將加速歐盟企業MPS的實施
根據歐盟氣候變遷政策,經檢驗的二氧化碳減排量是採購標準之一。雙面列印預設設定、自動碳粉回收和紙張使用分析已證實,與單面列印工作流程相比,可減少 60% 的排放,達到企業氣候責任監測機構設定的到 2030 年碳足跡減少 30-33% 的基準。因此,企業正將多年期管理列印服務 (MPS) 合約授予那些能夠提供審核的生命週期分析和低能耗設備的供應商,尤其注重那些獲得「藍天使」或「EPEAT 金級」認證的設備。
斯堪的納維亞的數位轉型導致辦公室印刷量下降
北歐企業在電子簽章和數位存檔領域處於領先地位,實現了每位員工列印頁數兩位數的下降。隨著基準列印量的下降,傳統的按頁計費模式面臨困境,迫使服務供應商拓展業務,轉向工作流程數位化和內容管理。北歐的經驗預示著其他成熟經濟體在電子帳單發票成為強制性要求和無紙化目標日益普及的情況下,也將出現類似的需求。
細分市場分析
到2024年,印表機和影印機製造商將透過將設備、韌體和耗材捆綁到整合服務合約中,佔據41%的託管列印服務市場佔有率。惠普在列印領域創下了銷售紀錄。在2025會計年度,惠普的印刷業務收入達到42億美元,利潤率為19.5%,顯示其盈利主要來自硬體。系統整合商/經銷商以10.8%的複合年成長率成長,利用其多廠商中立性為受監管客戶建構客製化設備群。他們的成長表明,客戶更重視服務而非設備品牌。獨立軟體供應商正透過針對工作流程瓶頸並整合可覆蓋各種硬體的分析和列印安全API,提供利基解決方案,從而拓展託管列印服務市場。
客戶越來越傾向於與能夠量化運作、安全合規性和環境指標的合作夥伴簽訂契約,而不是按墨粉數量付費。製造商也積極回應,向整合商開放設備遙測數據,共同開發分析工具,並資助通路培訓。同時,經銷商可以透過開發垂直領域的專業服務(例如 HIPAA 合規性模板),來拓展先前由原始設備製造商 (OEM) 主導的全國客戶群。
到2024年,本地部署仍將佔據託管列印服務市場65%的佔有率,主要集中在金融服務、國防和公共產業等產業,這些產業的管治政策限制了外部資料傳輸。然而,隨著企業將列印伺服器遷移到SaaS平台,雲端採用率將以每年11.2%的速度成長,從而減輕修補程式管理、佇列管理和驅動程式驗證的負擔。夏普的Synappx架構將原始文件置於防火牆後,僅保護元資料。這種設計模式在確保雲端可擴展性的同時,也降低了主權風險。目前,供應商正在推出混合產品,這些產品可以編配本地輸出以處理敏感工作流程,並將標準作業的列印任務發送到雲端,使企業能夠在保持風險管理的同時輕鬆採用公共雲端。
網路保險的先決條件進一步加速了雲端技術的普及,SaaS 供應商獲得 SOC-2、ISO 27001 和 FedRAMP 認證的速度甚至超過了許多公司對其內部列印伺服器審核的速度。早期採用者報告稱,支援工單減少了 30-40%,使 IT 人員能夠專注於更高價值的專案。因此,託管列印服務產業正在從裝置故障修復轉向由不斷更新的雲端分析支援的持續最佳化。
託管列印服務市場按通路類型(印表機/影印機製造商、系統整合商/經銷商、獨立軟體供應商 (ISV))、部署類型(本地部署、雲端基礎)、組織規模(中小企業 (SME)、大型企業)、最終用戶行業(銀行、金融服務和保險 (BFSI)、醫療保健、IT 和電信、其他)以及地區進行細分。市場預測以美元計價。
區域分析
北美在託管列印服務市場佔據領先地位,市佔率高達37%,這得益於其成熟的IT生態系統、早期雲端採用以及嚴格的管治標準。企業通常會將安全列印發布功能與其識別及存取管理套件整合,以簡化零信任部署。此外,北美還擁有強大的通路生態系統,OEM廠商、經銷商和獨立軟體開發商攜手合作,提供從文件擷取到歸檔的端到端自動化解決方案。許多美國財富500強企業已承諾在2030年前實現碳中和,並依靠列印設備最佳化來減少範圍3的碳排放。
亞太地區成長最快,預計到2030年複合年成長率將達到12.1%。中國製造商正在尋求預測性維護分析技術來彌補勞動力短缺,確保全天候生產。Canon抓住了這一機遇,其印刷業務的銷售額預計將在2024年達到25,227億日圓(約168億美元)。印度的外包中心正擴大將安全拉式列印技術納入西方客戶要求的ISO 27001合規架構中。日本和韓國正努力平衡先進的機器人技術與傳統的紙本工作流程,使雲端列印編配成為數位轉型的橋樑技術。東南亞的中小型企業正在採用訂閱式MPS模式來避免資本支出,從而推動了列印量穩步快速成長。
歐洲憑藉其高度成熟的數位化水準和永續性政策的挑戰,依然保持著優勢。歐盟《企業永續性發展報告指令》要求企業記錄其生命週期影響,促使企業進行廣泛的設備審核和整合。尤其是在北歐市場,儘管列印頁數有所下降,但企業正在將數位化融入剩餘的設備採購中。德國、英國和法國透過複雜的多站點企業和公共部門合約來維持需求,這些合約需要BSI C5等高階安全認證。供應商透過提供碳足跡儀錶板和與列印指標掛鉤的自動碳抵銷購買功能來脫穎而出。
其他福利:
- Excel格式的市場預測(ME)表
- 3個月的分析師支持
目錄
第1章 引言
- 研究假設和市場定義
- 調查範圍
第2章調查方法
第3章執行摘要
第4章 市場情勢
- 市場概覽
- 市場促進因素
- 最佳化遠距辦公和列印基礎設施,以推動北美地區 MPS 的普及
- 永續性和碳足跡要求將加速歐盟企業MPS的實施
- 市場成長受中小企業轉型為訂閱式服務模式驅動
- 醫療保健和政府部門對列印設備的安全性和合規性要求日益提高
- 物聯網賦能的車隊分析透過減少亞洲大型企業的停機時間,推動市場成長
- 市場限制
- 北歐地區因數位轉型導致的辦公室列印量下降阻礙了市場發展
- 資料主權問題阻礙了政府雲端基礎支付系統(MPS)的部署。
- 供應商鎖定和合約複雜性阻礙了中小企業的發展。
- 新興南亞市場對資本支出轉變為營運支出會計核算的抵制是市場限制因素。
- 價值鏈分析
- 監理展望
- 波特五力分析
- 買方的議價能力
- 供應商的議價能力
- 新進入者的威脅
- 替代品的威脅
- 競爭對手之間的競爭
- 評估影響市場的宏觀經濟趨勢
第5章 市場規模與成長預測數據
- 按頻道類型
- 印表機/影印機製造商
- 系統整合/經銷商
- 獨立軟體供應商(ISV)
- 透過部署模式
- 本地部署
- 雲端基礎的
- 按組織規模
- 中小企業
- 主要企業
- 按最終用戶行業分類
- BFSI
- 衛生保健
- 資訊科技/通訊
- 政府
- 教育
- 其他終端用戶產業
- 按地區
- 北美洲
- 美國
- 加拿大
- 墨西哥
- 歐洲
- 德國
- 英國
- 法國
- 北歐國家
- 其他歐洲地區
- 亞太地區
- 中國
- 日本
- 印度
- 韓國
- 亞太其他地區
- 南美洲
- 巴西
- 阿根廷
- 其他南美洲
- 中東和非洲
- 中東
- 海灣合作理事會(沙烏地阿拉伯、阿拉伯聯合大公國、卡達)
- 土耳其
- 其他中東地區
- 非洲
- 南非
- 奈及利亞
- 其他非洲地區
- 北美洲
第6章 競爭情勢
- 市場集中度
- 策略趨勢
- 市佔率分析
- 公司簡介
- Xerox Corporation
- Ricoh Company, Ltd.
- HP Inc.
- Canon Inc.
- Brother Industries, Ltd.
- Lexmark International, Inc.
- Konica Minolta, Inc.
- Samsung Electronics Co., Ltd.
- Kyocera Document Solutions Inc.
- Sharp Corporation
- Epson(Seiko Epson Corporation)
- Toshiba Tec Corporation
- FujiFilm Business Innovation Corp.
- Dell Technologies Inc.
- PrintFleet(ECI Software Solutions)
- PaperCut Software International
- Quadient SA
- Arc Document Solutions, Inc.
- EFI(Electronics For Imaging, Inc.)
- FlexPrint Managed Print Solutions
- OKI Electric Industry Co., Ltd.
- Pitney Bowes Inc.
- Wipro Ltd.
第7章 市場機會與未來展望
The managed print services market size is estimated at USD 49.78 billion in 2025 and is is forecast to reach USD 79.23 billion by 2030, expanding at a 9.25% CAGR.
Cloud connectivity, hybrid-work infrastructure, and subscription pricing are converging to lift adoption across large enterprises and an expanding base of small and medium businesses. Security-rich fleets, real-time IoT diagnostics, and automated consumables replenishment are proving decisive in lowering total cost of ownership and reducing unplanned downtime. Demand also reflects mounting sustainability mandates that reward providers able to quantify duplex usage, carbon savings, and paper-waste avoidance. Competitive positioning is shifting as hardware-centric incumbents blend analytics, workflow automation, and device-as-a-service bundles to defend share against cloud-native entrants specializing in AI-driven optimisation. Regional momentum is most pronounced in Asia-Pacific, where large manufacturers and export-oriented enterprises view predictive maintenance as an operational efficiency lever.
Global Managed Print Services Market Trends and Insights
Remote Work Print Infrastructure Optimisation Driving MPS Adoption in North America
Hybrid work has turned distributed print into a cost and security risk, prompting firms to consolidate device management in the cloud. Enterprises are adopting secure-print release, user authentication, and encrypted job routing to maintain compliance while supporting employees who print at headquarters, branch offices, or home. Sharp's Synappx Cloud Print targets this requirement, retaining job metadata only and reinforcing Zero Trust principles, a design favoured by US-based financial institutions and healthcare systems. Subscription pricing aligns spending to usage, eliminates server upkeep, and offers dashboards that benchmark sustainability metrics.
Sustainability and Carbon Footprint Mandates Accelerating EU Corporate MPS
EU climate policies now make verified CO2 reduction a procurement criterion. Duplex defaults, automated toner recycling, and paper-use analytics enable documented 60% emissions cuts relative to single-sided workflows, satisfying Corporate Climate Responsibility Monitor benchmarks that call for 30-33% footprint reductions by 2030. Corporates therefore award multi-year MPS contracts to providers demonstrating auditable lifecycle analytics and low-energy devices, putting a premium on fleets certified to Blue Angel or EPEAT Gold standards.
Declining Office Print Volumes Amid Digital Transformation in Nordics
Scandinavian corporations lead in e-signatures and digital archives, cutting per-employee print by double digits. Traditional cost-per-page models suffer as baseline volumes drop, prompting providers to broaden scopes to workflow digitisation and content management. Nordic lessons foreshadow demand in other mature economies as e-invoicing becomes compulsory and paper elimination targets spread.
Other drivers and restraints analyzed in the detailed report include:
- Shift Toward Subscription-based Everything-as-a-Service Models Among SMEs
- Rising Print-Device Security and Compliance Requirements in Healthcare and Government
- Data Sovereignty Concerns Hindering Cloud-based MPS in Government Agencies
For complete list of drivers and restraints, kindly check the Table Of Contents.
Segment Analysis
Printer/Copier Manufacturers owned a 41% stake of managed print services market share in 2024 by bundling devices, firmware, and consumables into integrated service agreements. Their captive install base, intellectual property, and direct field-service networks create switching costs that defend renewals. HP logged Printing segment revenue of USD 4.2 billion with a 19.5% margin in FY25, demonstrating hardware-anchored profitability. System Integrators/Resellers, expanding at 10.8% CAGR, capitalise on multi-vendor neutrality to architect bespoke fleets for regulated clients. Their growth signals customer appetite for service depth over device brand. Independent Software Vendors target workflow bottlenecks, embedding analytics and print-security APIs that overlay diverse hardware, thereby widening the managed print services market for niche solutions.
Customers increasingly award contracts to partners able to quantify uptime, security compliance, and environmental metrics rather than sell per-unit toner. Manufacturers answer by opening device telemetry to integrators, co-developing analytics, and funding channel training. Resellers, meanwhile, cultivate vertical specialisation-such as HIPAA compliance templates-that lets them penetrate national account rosters previously dominated by OEMs.
On-premise fleets still represent 65% of managed print services market size in 2024, anchored by financial services, defence, and utilities whose governance policies restrict external data transit. Yet cloud deployments will grow 11.2% annually as enterprises migrate print servers to SaaS platforms, offloading patching, queue management, and driver certification. Sharp's Synappx architecture secures metadata only, leaving raw documents behind the firewall, a design pattern that mitigates sovereignty risks while capturing cloud scalability. Providers now package hybrid offerings that orchestrate on-premise output for sensitive workflows and cloud spooling for standard jobs, enabling firms to ease into public-cloud adoption while maintaining risk controls.
Cyber insurance prerequisites further accelerate cloud, given that SaaS vendors certify against SOC-2, ISO 27001, and FedRAMP faster than many enterprises can audit internal print servers. Early movers report 30-40% support ticket reductions, freeing IT staff for higher-value initiatives. The managed print services industry therefore pivots from device break-fix toward continuous optimisation supported by always-updated cloud analytics.
Managed Print Services Market is Segmented by Channel Type (Printer/Copier Manufacturers, System Integrators/Resellers, Independent Software Vendors (ISVs)), Deployment Mode (On-Premise, Cloud-Based), Organization Size (Small and Medium Enterprises (SMEs), Large Enterprises), End-User Vertical (BFSI, Healthcare, IT and Telecom, and More), and Geography. The Market Forecasts are Provided in Terms of Value (USD).
Geography Analysis
North America heads the managed print services market with a 37% slice, underpinned by mature IT ecosystems, early cloud adoption, and stringent governance standards. Enterprises routinely integrate secure-print release with identity-and-access-management suites, streamlining Zero Trust rollouts. Channel ecosystems are deep, with OEMs, resellers, and ISVs collaborating to deliver end-to-end automation from document capture to archiving. The market also benefits from aggressive sustainability commitments by US Fortune 500 firms, many of which have pledged carbon neutrality by 2030 and rely on print fleet optimisation for scope-3 reductions.
Asia-Pacific is the fastest climber, logging a 12.1% CAGR to 2030. Chinese manufacturers procure predictive-maintenance analytics to offset labour shortages and ensure 24 X 7 production, an opportunity seized by Canon, whose Printing Group sales hit Yen 2,522.7 billion (USD 16.8 billion) in 2024. India's outsourcing hubs increasingly embed secure pull printing in ISO 27001 compliance frameworks demanded by Western clients. Japan and South Korea balance advanced robotics with paper-workflow legacies, making cloud print orchestration a bridge technology for digital transformation. Southeast Asian SMEs adopt subscription MPS to avoid capex, contributing incremental but rapid volumes.
Europe exhibits high digital maturity yet remains lucrative owing to sustainability policy headwinds. Companies must document lifecycle impacts under the EU Corporate Sustainability Reporting Directive, prompting widespread fleet audits and device consolidation. Nordic markets, in particular, show declining page volumes but buy workflow digitisation layered onto remaining devices. Germany, the United Kingdom, and France sustain demand through complex multi-site enterprises and public-sector contracts that require advanced security certifications such as BSI C5. Providers differentiate by offering carbon-footprint dashboards and automated carbon offset purchasing tied to print metrics.
- Xerox Corporation
- Ricoh Company, Ltd.
- HP Inc.
- Canon Inc.
- Brother Industries, Ltd.
- Lexmark International, Inc.
- Konica Minolta, Inc.
- Samsung Electronics Co., Ltd.
- Kyocera Document Solutions Inc.
- Sharp Corporation
- Epson (Seiko Epson Corporation)
- Toshiba Tec Corporation
- FujiFilm Business Innovation Corp.
- Dell Technologies Inc.
- PrintFleet (ECI Software Solutions)
- PaperCut Software International
- Quadient SA
- Arc Document Solutions, Inc.
- EFI (Electronics For Imaging, Inc.)
- FlexPrint Managed Print Solutions
- OKI Electric Industry Co., Ltd.
- Pitney Bowes Inc.
- Wipro Ltd.
Additional Benefits:
- The market estimate (ME) sheet in Excel format
- 3 months of analyst support
TABLE OF CONTENTS
1 INTRODUCTION
- 1.1 Study Assumptions and Market Definition
- 1.2 Scope of the Study
2 RESEARCH METHODOLOGY
3 EXECUTIVE SUMMARY
4 MARKET LANDSCAPE
- 4.1 Market Overview
- 4.2 Market Drivers
- 4.2.1 Remote Work Print Infrastructure Optimization Driving MPS Adoption in North America
- 4.2.2 Sustainability and Carbon Footprint Mandates Accelerating EU Corporate MPS
- 4.2.3 Shift Toward Subscription-based Everything-as-a-Service Models Among SMEs Drives the Market
- 4.2.4 Rising Print-Device Security and Compliance Requirements in Healthcare and Government
- 4.2.5 IoT-Enabled Fleet Analytics Reducing Downtime in Large Asian Enterprises Drives the Market
- 4.3 Market Restraints
- 4.3.1 Declining Office Print Volumes Amid Digital Transformation in Nordics Hinders the Market
- 4.3.2 Data Sovereignty Concerns Hindering Cloud-based MPS in Government Agencies
- 4.3.3 Vendor Lock-in Perception and Contract Complexity Discouraging SMEs
- 4.3.4 Capex-to-Opex Accounting Shift Resistance in Emerging South Asian Markets Restraints the Market
- 4.4 Value Chain Analysis
- 4.5 Regulatory Outlook
- 4.6 Porter's Five Forces Analysis
- 4.6.1 Bargaining Power of Buyers
- 4.6.2 Bargaining Power of Suppliers
- 4.6.3 Threat of New Entrants
- 4.6.4 Threat of Substitutes
- 4.6.5 Intensity of Competitive Rivalry
- 4.7 Assessment of Macro Economic Trends on the Market
5 MARKET SIZE AND GROWTH FORECASTS (VALUES)
- 5.1 By Channel Type
- 5.1.1 Printer/Copier Manufacturers
- 5.1.2 System Integrators/Resellers
- 5.1.3 Independent Software Vendors (ISVs)
- 5.2 By Deployment Mode
- 5.2.1 On-Premise
- 5.2.2 Cloud-based
- 5.3 By Organization Size
- 5.3.1 Small and Medium Enterprises (SMEs)
- 5.3.2 Large Enterprises
- 5.4 By End-user Vertical
- 5.4.1 BFSI
- 5.4.2 Healthcare
- 5.4.3 IT and Telecom
- 5.4.4 Government
- 5.4.5 Education
- 5.4.6 Other End-user Verticals
- 5.5 By Geography
- 5.5.1 North America
- 5.5.1.1 United States
- 5.5.1.2 Canada
- 5.5.1.3 Mexico
- 5.5.2 Europe
- 5.5.2.1 Germany
- 5.5.2.2 United Kingdom
- 5.5.2.3 France
- 5.5.2.4 Nordics
- 5.5.2.5 Rest of Europe
- 5.5.3 Asia-Pacific
- 5.5.3.1 China
- 5.5.3.2 Japan
- 5.5.3.3 India
- 5.5.3.4 South Korea
- 5.5.3.5 Rest of Asia-Pacific
- 5.5.4 South America
- 5.5.4.1 Brazil
- 5.5.4.2 Argentina
- 5.5.4.3 Rest of South America
- 5.5.5 Middle East and Africa
- 5.5.5.1 Middle East
- 5.5.5.1.1 GCC (Saudi Arabia, UAE, Qatar)
- 5.5.5.1.2 Turkey
- 5.5.5.1.3 Rest of Middle East
- 5.5.5.2 Africa
- 5.5.5.2.1 South Africa
- 5.5.5.2.2 Nigeria
- 5.5.5.2.3 Rest of Africa
- 5.5.1 North America
6 COMPETITIVE LANDSCAPE
- 6.1 Market Concentration
- 6.2 Strategic Moves
- 6.3 Market Share Analysis
- 6.4 Company Profiles (includes Global level Overview, Market level overview, Core Segments, Financials as available, Strategic Information, Market Rank/Share for key companies, Products and Services, and Recent Developments)
- 6.4.1 Xerox Corporation
- 6.4.2 Ricoh Company, Ltd.
- 6.4.3 HP Inc.
- 6.4.4 Canon Inc.
- 6.4.5 Brother Industries, Ltd.
- 6.4.6 Lexmark International, Inc.
- 6.4.7 Konica Minolta, Inc.
- 6.4.8 Samsung Electronics Co., Ltd.
- 6.4.9 Kyocera Document Solutions Inc.
- 6.4.10 Sharp Corporation
- 6.4.11 Epson (Seiko Epson Corporation)
- 6.4.12 Toshiba Tec Corporation
- 6.4.13 FujiFilm Business Innovation Corp.
- 6.4.14 Dell Technologies Inc.
- 6.4.15 PrintFleet (ECI Software Solutions)
- 6.4.16 PaperCut Software International
- 6.4.17 Quadient SA
- 6.4.18 Arc Document Solutions, Inc.
- 6.4.19 EFI (Electronics For Imaging, Inc.)
- 6.4.20 FlexPrint Managed Print Solutions
- 6.4.21 OKI Electric Industry Co., Ltd.
- 6.4.22 Pitney Bowes Inc.
- 6.4.23 Wipro Ltd.
7 MARKET OPPORTUNITIES AND FUTURE OUTLOOK
- 7.1 White-space and Unmet-need Assessment
 託管列印服務市場:按服務類型、合約期限、定價模式、通路類型和最終用戶行業分類 - 全球市場預測 2026-2032
 2026年全球列印管理軟體市場報告
 託管列印服務市場報告:按類型、部署模式、組織規模、行業和地區分類(2026-2034 年)2026年全球託管列印服務市場報告
 全球託管列印服務市場:市場規模、佔有率和趨勢分析(按部署方式、企業規模、通路、最終用途和地區分類),細分市場預測(2026-2033 年)
 託管列印服務市場 - 全球產業規模、佔有率、趨勢、機會和預測:按部署模式、類型、組織規模、通路類型、最終用戶產業、地區和競爭格局預測,2021-2031 年印表機監控軟體市場按產品類型、設備類型、定價模式、部署類型、應用和分銷管道分類,全球預測(2026-2032年)日本託管列印服務市場報告:按類型、部署類型、組織規模、產業和地區分類(2026-2034 年)
 列印管理軟體市場規模、佔有率、成長及全球產業分析:依類型、應用和地區劃分的洞察與預測(2024-2032 年)
 全球印刷管理軟體市場