


 |
市場調查報告書
商品編碼
1684103
印尼化肥:市場佔有率分析、產業趨勢與統計、成長預測(2025-2030 年)Indonesia Fertilizer - Market Share Analysis, Industry Trends & Statistics, Growth Forecasts (2025 - 2030) |
||||||
※ 本網頁內容可能與最新版本有所差異。詳細情況請與我們聯繫。
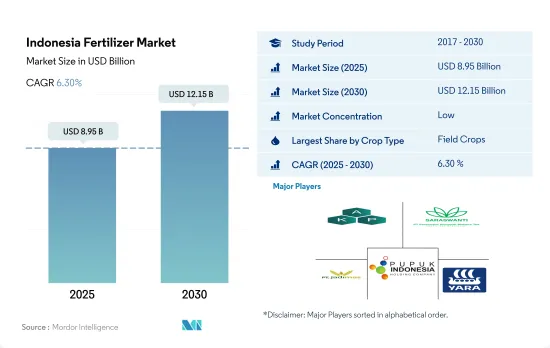
預計 2025 年印尼肥料市場規模將達到 89.5 億美元,預計 2030 年將達到 121.5 億美元,預測期內(2025-2030 年)的複合年成長率為 6.30%。
田間作物佔日本肥料消耗的大部分
- 2022年,田間作物佔印尼肥料市場的92.3%,達39.3億美元。其中水稻是該國的主要田間作物,印尼是繼中國和印度之後的世界第三米生產國。印尼稻米主要種植區為南蘇門答臘省、西爪哇省、中爪哇省、東爪哇省及南蘇拉威西省。
- 在大田作物領域,常規肥料將佔據最高佔有率,到 2022 年將達到 76.0%,其餘 24.0% 為專用肥料。在特殊肥料領域,常規肥料部分預計從 2023 年到 2030 年的複合年成長率為 6.1%。
- 2022 年,園藝作物佔印尼肥料市場的 9.3%。鑑於水果和蔬菜在均衡飲食中的重要性,值得注意的是,2016 年印尼人的水果和蔬菜消費量僅為建議攝取量的 43%。此外,在過去五年中,這種消費量有所下降,現在還不到建議水準的一半。印尼人平均每日水果和蔬菜消費量為173克,遠低於建議攝取量400克,顯示該產業具有成長潛力。
- 2022年,草坪和觀賞作物在印尼肥料市場的佔比不到1.0%,主要原因是種植面積有限,僅佔該國作物總面積的0.03%。
- 受體育場館(尤其是足球場)需求不斷成長的推動,印尼的草坪和觀賞肥料市場呈上升趨勢。預計 2023 年至 2030 年期間該產業的複合年成長率為 6.2%。
印尼肥料市場趨勢
印尼擴大耕地面積以實現自給自足
- 在印度尼西亞,2022年田間作物將佔種植面積的89.9%。水稻、玉米、木薯、大豆和花生是印尼主要種植的田間作物。至2022年,水稻將佔田間作物種植總面積的56.7%。印尼的低地和高地地區均種植水稻,高地種植通常依賴雨養,且施肥量較低。稻米種植主要集中在爪哇島,但蘇門答臘島和蘇拉威西島也蓬勃發展。這三個島嶼的稻米產量約佔全國總產量的 89%。在印度尼西亞,水稻通常生長三個季節:一個雨季作物和兩個旱季作物。總產量的約 45% 來自雨季作物,這些作物在 10 月至 12 月種植,3 月和 4 月收穫。
- 玉米是印尼繼水稻之後種植面積第二大的作物,約佔農田面積的 10.8%。玉米是印尼 1,800 多萬人口的主食,有超過 1,000 萬個農場種植玉米。 2022 年玉米產量集中在各個地區,包括中爪哇省(佔玉米總產量的 16%)、楠榜省(佔玉米總產量的 9%)、南蘇拉威西省(佔玉米總產量的 8%)和北蘇門答臘省(佔玉米總產量的 7%)。
- 儘管印尼是世界上最大的米生產國,但2022年印尼仍將從泰國、越南、印度、巴基斯坦和其他國家進口約50萬噸米。為了提高自給率並抑制進口,印尼正致力於提高生產力,而化肥市場是推動這項進程的動力。
在主要營養元素中,氮是大田作物大量使用的元素。
- 氮、磷和鉀是植物生長必需的關鍵營養素。氮(N)和磷(P)是植物組織必需的蛋白質和核酸的主要成分。另一方面,鉀(K)在提高收穫的植物產品的品質方面發揮著至關重要的作用。在印度尼西亞,水稻、小麥、大豆和玉米是主要田間作物。這些作物的平均施肥量為氮223.8公斤/公頃、磷57.3公斤/公頃和鉀88.0公斤/公頃。
- 在主要養分中,氮的施用量最高,田間作物平均氮肥施用量為223.8公斤/公頃。適當使用氮肥可以提高穀粒品質,促進芽生長,並產生強壯的花蕾。早期施用氮肥還可以改善犁地並提高作物產量。磷是第二重要的常量營養素,2022 年施用率為 57.3 公斤/公頃。磷在穀物發育中起著重要作用,有助於早期根系生長、芽葉形成和穀粒灌漿。
- 2022年,印尼田間作物平均鉀施用率為88.0公斤/公頃。缺鉀症狀首先出現在下部葉片。這是因為鉀很容易從植物體內的老葉子轉移到嫩葉子。症狀表現為葉子從尖端到基部沿著外部葉子的邊緣變黃並發展為壞死(組織死亡)。主要營養成分的缺乏會對植物的健康、生長和產量產生重大影響。由於主要作物收穫面積的擴大,田間作物對基本養分的需求不斷增加。
印尼肥料產業概況
印尼化肥市場較為分散,前五大企業佔39.73%。市場的主要企業有:Asia Kimindo Prima、PT Saraswanti Anugerah Makmur Tbk (SAMF)、PT。 JADI MAS、Pupuk Indonesia (Persero) 和 Yara International ASA(按字母順序排列)。
其他福利
- Excel 格式的市場預測 (ME) 表
- 3 個月的分析師支持
目錄
第 1 章執行摘要和主要發現
第2章 報告要約
第 3 章 簡介
- 研究假設和市場定義
- 研究範圍
- 調查方法
第4章 產業主要趨勢
- 主要作物種植面積
- 田間作物
- 園藝作物
- 平均養分施用量
- 微量營養素
- 田間作物
- 園藝作物
- 主要營養物質
- 田間作物
- 園藝作物
- 次要營養素
- 田間作物
- 園藝作物
- 微量營養素
- 灌溉農田
- 法律規範
- 價值鏈與通路分析
第5章 市場區隔
- 類型
- 複合型
- 直的
- 微量營養素
- 硼
- 銅
- 鐵
- 錳
- 鉬
- 鋅
- 其他
- 氮
- 尿素
- 其他
- 磷酸
- DAP
- MAP
- TSP
- 其他
- 鉀
- MoP
- SoP
- 其他
- 次要營養物質
- 鈣
- 鎂
- 硫
- 形式
- 傳統的
- 特別的
- CRF
- 液體肥料
- SRF
- 水溶性
- 受精方式
- 受精
- 葉面噴布
- 土壤
- 作物類型
- 田間作物
- 園藝作物
- 草坪和觀賞植物
第6章 競爭格局
- 主要策略趨勢
- 市場佔有率分析
- 業務狀況
- 公司簡介
- Asia Kimindo Prima
- Grupa Azoty SA(Compo Expert)
- Haifa Group
- PT Saraswanti Anugerah Makmur Tbk(SAMF)
- PT. JADI MAS
- Pupuk Indonesia(Persero)
- Yara International ASA
第7章:執行長的關鍵策略問題
第 8 章 附錄
- 世界概況
- 概述
- 五力分析框架
- 全球價值鏈分析
- 市場動態(DRO)
- 資訊來源和進一步閱讀
- 圖片列表
- 關鍵見解
- 資料包
- 詞彙表
The Indonesia Fertilizer Market size is estimated at 8.95 billion USD in 2025, and is expected to reach 12.15 billion USD by 2030, growing at a CAGR of 6.30% during the forecast period (2025-2030).
Field crops dominate the consumption of fertilizers in the country
- In 2022, field crops dominated the fertilizer market in Indonesia, representing 92.3% of the market's value, which amounted to USD 3.93 billion. Notably, rice is the primary field crop in the country, with Indonesia ranking as the world's third-largest rice producer, trailing only China and India. Key regions for rice cultivation in Indonesia include South Sumatra, West Java, Central Java, East Java, and South Sulawesi.
- Conventional fertilizers held the highest share in the field crop segment, accounting for 76.0% in 2022, while specialty fertilizers made up the remaining 24.0%. Within the specialty fertilizers category, the conventional segment is projected to record a CAGR of 6.1% between 2023 and 2030.
- Horticultural crops constituted 9.3% of Indonesia's fertilizer market in 2022. Given the importance of fruits and vegetables in a balanced diet, it is worth noting that in 2016, Indonesians consumed only 43% of the recommended intake. Furthermore, over the past five years, this consumption has declined, falling below half of the recommended levels. On average, Indonesians consumed 173 grams of fruits and vegetables per day, significantly lower than the recommended 400 grams, indicating potential for growth in this segment.
- In 2022, turf and ornamental crops made up less than 1.0% of Indonesia's fertilizer market, primarily due to their limited cultivation area, accounting for a mere 0.03% of the country's total crop area.
- The turf and ornamental fertilizer market in Indonesia is witnessing an upward trajectory, driven by rising demand, particularly from sports stadiums like football fields. This segment is projected to witness a CAGR of 6.2% between 2023 and 2030.
Indonesia Fertilizer Market Trends
Indonesia is aiming for the self-sufficiency driving the area under cultivation
- In Indonesia, field crops accounted for 89.9% of the total cultivated area in 2022. Rice, corn, cassava, soybeans, and peanuts are major field crops grown in Indonesia. In 2022, rice accounted for 56.7% of the total area under field crops. Rice is cultivated in both lowland and upland elevations throughout Indonesia, with the upland crop typically being rainfed and receiving only low levels of fertilizer applications. Rice cultivation is heavily concentrated in Java but is also prevalent in Sumatra and Sulawesi. These three islands together contribute about 89% of total national rice production. There are typically three rice growing periods or seasons in Indonesia, a single wet-season crop followed by two dry-season crops. Approximately 45% of total production is usually from the wet season crop, cultivated from October to December and harvested from March through April.
- Corn is the second largely cultivated crop in Indonesia after paddy, occupying about 10.8% of agricultural land. Corn is the staple foodstuff in Indonesia for more than 18 million people and is grown by more than 10 million farm households. Corn production was concentrated in various regions, including Jawa Tengah (16% of total corn production), Lampung (9% of total corn production), Sulawesi Selatan (8% of total corn production), and Sumatera Utara (7% of total corn production) in 2022.
- Despite being the world's largest rice producer, Indonesia imported approximately 500,000 tons of rice in 2022 from countries like Thailand, Vietnam, India, and Pakistan. In a bid to bolster self-sufficiency and curb imports, Indonesia's focus on enhancing productivity is set to propel its fertilizers market.
Among all the primary nutrients, nitrogen is applied in a higher quantity in field crops
- Nitrogen, phosphorus, and potassium are the primary nutrients crucial for plant growth. Nitrogen (N) and phosphorus (P) are key components of proteins and nucleic acids, integral to plant tissues. Meanwhile, potassium (K) plays a pivotal role in enhancing the quality of harvested plant products. In Indonesia, the prominent field crops are rice, wheat, soybean, and corn. On average, these crops receive nutrient application rates of 223.8 kg/ha for nitrogen, 57.3 kg/ha for phosphorus, and 88.0 kg/ha for potassium.
- Out of the primary nutrients, nitrogen sees the highest application rate, averaging 223.8 kg/ha for field crops. Nitrogenous fertilizers, when appropriately used, contribute to improved grain quality, accelerated shoot growth, and the production of robust flower buds. Early-stage nitrogen fertilization also stimulates tillering and boosts crop yields. Phosphorus, with an application rate of 57.3 kg/ha in 2022, ranks second among the primary nutrients. It plays a vital role in the development of cereal crops, aiding in early root growth, tiller formation, and grain filling.
- In 2022, field crops in Indonesia received an average potassium application rate of 88.0 kg/ha. Potassium deficiency symptoms are first visible on the lower leaves, as potassium is easily translocated from older to younger leaves within the plant. These symptoms manifest as yellowing, progressing to necrosis (tissue death) along the outer leaf margins, starting from the tip and moving toward the base. The absence of primary nutrients can significantly impact plant health, growth, and crop yield. Given the expanding harvested area for major food crops, the demand for primary nutrients in field crops is poised to rise.
Indonesia Fertilizer Industry Overview
The Indonesia Fertilizer Market is fragmented, with the top five companies occupying 39.73%. The major players in this market are Asia Kimindo Prima, PT Saraswanti Anugerah Makmur Tbk (SAMF), PT. JADI MAS, Pupuk Indonesia (Persero) and Yara International ASA (sorted alphabetically).
Additional Benefits:
- The market estimate (ME) sheet in Excel format
- 3 months of analyst support
TABLE OF CONTENTS
1 EXECUTIVE SUMMARY & KEY FINDINGS
2 REPORT OFFERS
3 INTRODUCTION
- 3.1 Study Assumptions & Market Definition
- 3.2 Scope of the Study
- 3.3 Research Methodology
4 KEY INDUSTRY TRENDS
- 4.1 Acreage Of Major Crop Types
- 4.1.1 Field Crops
- 4.1.2 Horticultural Crops
- 4.2 Average Nutrient Application Rates
- 4.2.1 Micronutrients
- 4.2.1.1 Field Crops
- 4.2.1.2 Horticultural Crops
- 4.2.2 Primary Nutrients
- 4.2.2.1 Field Crops
- 4.2.2.2 Horticultural Crops
- 4.2.3 Secondary Macronutrients
- 4.2.3.1 Field Crops
- 4.2.3.2 Horticultural Crops
- 4.2.1 Micronutrients
- 4.3 Agricultural Land Equipped For Irrigation
- 4.4 Regulatory Framework
- 4.5 Value Chain & Distribution Channel Analysis
5 MARKET SEGMENTATION (includes market size in Value in USD and Volume, Forecasts up to 2030 and analysis of growth prospects)
- 5.1 Type
- 5.1.1 Complex
- 5.1.2 Straight
- 5.1.2.1 Micronutrients
- 5.1.2.1.1 Boron
- 5.1.2.1.2 Copper
- 5.1.2.1.3 Iron
- 5.1.2.1.4 Manganese
- 5.1.2.1.5 Molybdenum
- 5.1.2.1.6 Zinc
- 5.1.2.1.7 Others
- 5.1.2.2 Nitrogenous
- 5.1.2.2.1 Urea
- 5.1.2.2.2 Others
- 5.1.2.3 Phosphatic
- 5.1.2.3.1 DAP
- 5.1.2.3.2 MAP
- 5.1.2.3.3 TSP
- 5.1.2.3.4 Others
- 5.1.2.4 Potassic
- 5.1.2.4.1 MoP
- 5.1.2.4.2 SoP
- 5.1.2.4.3 Others
- 5.1.2.5 Secondary Macronutrients
- 5.1.2.5.1 Calcium
- 5.1.2.5.2 Magnesium
- 5.1.2.5.3 Sulfur
- 5.2 Form
- 5.2.1 Conventional
- 5.2.2 Speciality
- 5.2.2.1 CRF
- 5.2.2.2 Liquid Fertilizer
- 5.2.2.3 SRF
- 5.2.2.4 Water Soluble
- 5.3 Application Mode
- 5.3.1 Fertigation
- 5.3.2 Foliar
- 5.3.3 Soil
- 5.4 Crop Type
- 5.4.1 Field Crops
- 5.4.2 Horticultural Crops
- 5.4.3 Turf & Ornamental
6 COMPETITIVE LANDSCAPE
- 6.1 Key Strategic Moves
- 6.2 Market Share Analysis
- 6.3 Company Landscape
- 6.4 Company Profiles
- 6.4.1 Asia Kimindo Prima
- 6.4.2 Grupa Azoty S.A. (Compo Expert)
- 6.4.3 Haifa Group
- 6.4.4 PT Saraswanti Anugerah Makmur Tbk (SAMF)
- 6.4.5 PT. JADI MAS
- 6.4.6 Pupuk Indonesia (Persero)
- 6.4.7 Yara International ASA
7 KEY STRATEGIC QUESTIONS FOR FERTILIZER CEOS
8 APPENDIX
- 8.1 Global Overview
- 8.1.1 Overview
- 8.1.2 Porter's Five Forces Framework
- 8.1.3 Global Value Chain Analysis
- 8.1.4 Market Dynamics (DROs)
- 8.2 Sources & References
- 8.3 List of Tables & Figures
- 8.4 Primary Insights
- 8.5 Data Pack
- 8.6 Glossary of Terms
 2025-2029年全球肥料市場
 德國肥料:市場佔有率分析、行業趨勢和統計、成長預測(2025-2030 年)
 2025 年全球起始肥料市場報告2025年硼肥全球市場報告
 全球肥料市場按類型、作物類型、應用類型和地區分類 - 2030 年預測2025年全球複合肥料市場報告
 2030 年微藻類肥料市場預測:按藻類類型、形態、營養成分、應用、最終用戶和地區進行的全球分析2030 年微量營養素肥料市場預測:按微量營養素類型、形式、作物類型、應用和地區進行的全球分析肥料市場規模、佔有率和成長分析(按農業、類型、形式、作物類型和地區)- 2025-2032 年產業預測昆蟲肥料市場規模、佔有率和成長分析(按昆蟲類型、產品類型、應用、分銷管道和地區)- 產業預測 2025-2032