


 |
市場調查報告書
商品編碼
1685737
生物農藥:市場佔有率分析、產業趨勢與統計、成長預測(2025-2030 年)Biopesticides - Market Share Analysis, Industry Trends & Statistics, Growth Forecasts (2025 - 2030) |
||||||
※ 本網頁內容可能與最新版本有所差異。詳細情況請與我們聯繫。
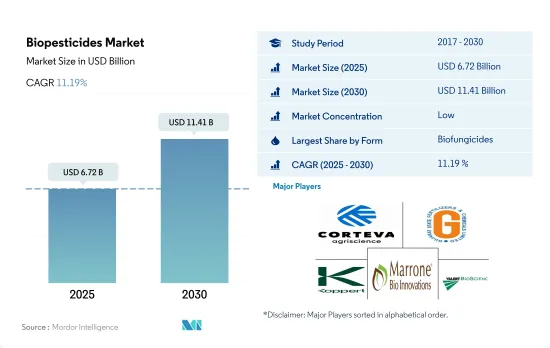
預計 2025 年生物農藥市場規模為 67.2 億美元,到 2030 年將達到 114.1 億美元,預測期內(2025-2030 年)的複合年成長率為 11.19%。
- 生物農藥由動物、植物、細菌和某些礦物質等天然來源製成。它利用自然控制機制,以環保的方式控制害蟲。生物農藥通常具有選擇性,針對特定的害蟲,從而減少對非目標物種和環境的影響。此外,生物農藥一般對人類和動物毒性低,且在環境中分解迅速。
- 生物殺菌劑是最常用的生物農藥。 2022年的市場佔有率為47.6%。芽孢桿菌、木黴菌、鏈黴菌和假單胞菌是農業中商業性使用的微生物種。這些生物殺菌劑可有效對抗腐霉菌、立枯絲核菌、鐮刀菌、核盤菌、串珠黴、灰黴病和白粉病等病原體。
- 2022 年,生物農藥佔全球生物農藥市場的 27.9%。每個季節都有幾種害蟲會對某些作物造成毀滅性的損失,但可以使用有針對性的生物殺蟲劑有效控制它們。例如,棉花是世界各地種植的重要經濟作物。棉花介殼蟲是一種無論在哪個地區都會影響棉花產量的害蟲。蘇力菌是一種具有重要商業性價值的生物殺蟲劑,可以有效控制這種毀滅性的害蟲,這種害蟲可造成 30-90% 的產量損失。
- 生物農藥在控制特定目標害蟲和疾病方面具有有效性,並且不會損害環境和動物,並有望推動全球生物農藥市場的發展。預計 2023 年至 2029 年期間生物農藥市場的複合年成長率為 11.0%。
- 生物農藥利用自然防治機制,以環保的方式控制害蟲。生物農藥通常具有選擇性,針對特定的害蟲,減少對非目標物種和環境的影響。 2022年生物農藥消費最多的地區是亞太地區和北美。
- 有機農業在亞太地區正經歷強勁成長,該地區擁有中國和印度等農業強國。這種成長的動力來自於對永續和健康食品的需求不斷成長,以及對傳統農藥有害影響的認知不斷提高。該地區作物種植面積從 2017 年的 310 萬公頃增加到 2021 年的 360 萬公頃,增加了 15.5%。
- 北美是生物農藥的第二大消費地區,2021 年的佔有率為 38.5%。該地區對有機食品的需求正在迅速成長。 2021年北美地區有機食品人均支出為109.7美元,該地區農民正加速適應新的生物技術。永續農業的趨勢預計將促進該地區生物農藥的使用。
- 政府措施和當地對有機農業的推廣進一步加強了這種永續發展的趨勢。例如,歐盟委員會宣布了一項行動計劃,到2030年將成員國有機種植面積提高到該地區農業用地面積的25.0%。秘魯、阿根廷等南美國家政府當局已禁止使用化學農藥,這推動了南美洲生物農藥市場的發展。
生物農藥市場的全球趨勢
在北美和歐洲,由於人們認知的不斷提高和政府的舉措,有機產量達到了歷史最高水準。
- 有機農業已成為永續糧食系統的主要貢獻者,並已在全球 187 個國家實踐。截至2021年,全球有機農地面積為7,230萬公頃,2018年至2021年間各地區平均成長2.9%。有機種植面積為1,440萬公頃,佔有機農地總面積的19.9%。
- 有機農業最強大的市場是北美和歐洲,這兩個地區佔世界有機種植面積的 41.0%。至2022年,歐洲有機耕地面積將為650萬公頃,相當於全球有機耕地總面積的44.1%。北美和歐洲最重要的有機種植作物是蘋果、草莓、穀物和橄欖。
- 亞太地區的新興國家也正在加入有機農業運動,並在生產和供應新鮮有機農產品方面實現自給自足,以滿足國內需求。有機農業趨勢在亞太地區日益興起,2017 年至 2022 年間,該地區的有機土地面積將增加 18.8%。該地區政府的主要措施也在有機農業擴張趨勢中發揮了關鍵作用。例如,日本的食品、農業和農村基本計畫旨在2030年將有機農場和有機農地的數量增加兩倍。
- 有機農業在世界各地越來越受歡迎,越來越多的國家採用有機農業來實現永續的糧食體系。有機農業的成長源於人們對其益處的認知不斷提高,例如促進土壤健康、減少負面環境影響和生產更健康的食品。
人均有機食品支出的成長主要出現在美國和德國,這得益於消費者對更健康、更永續食品的需求。
- 過去幾年,有機食品市場經歷了顯著成長,全球銷售額預計將從 2012 年的 708 億美元成長到 2020 年的 1,206 億美元。有機食品的趨勢受到多種因素的推動,包括消費者對更健康、更永續的食品選擇的需求不斷成長,以及對傳統農業對環境影響的認知不斷提高。預計未來幾年全球有機食品市場將持續維持成長趨勢。
- 根據有機貿易協會 2021 年的一項調查,當年有機水果和蔬菜的銷售額成長了約 4.5%,佔有機產品總銷售額的 15%。北美在有機產品平均支出方面佔據市場主導地位,2021年美國的人均支出達到186.7美元,是北美國家中最高的。歐洲有機食品市場預計也將強勁成長,其中德國 2021 年的人均有機食品支出最高,達到 75.6 美元。
- 有機食品市場仍由消費者可支配收入較高的已開發國家主導,但有機食品市場在新興國家預計也會成長。例如,亞太地區的工人階級不斷壯大,這使得有機食品更容易取得且價格更便宜,有助於擴大市場。
生物農藥產業概況
生物農藥市場較為分散,前五大公司佔6.03%的市佔率。市場的主要企業是:Corteva Agriscience、Gujarat State Fertilizers & Chemicals Ltd、Koppert Biological Systems Inc.、Marrone Bio Innovations Inc. 和 Valent Biosciences LLC(按字母順序排列)。
其他福利
- Excel 格式的市場預測 (ME) 表
- 3 個月的分析師支持
目錄
第 1 章執行摘要和主要發現
第2章 報告要約
第 3 章 簡介
- 研究假設和市場定義
- 研究範圍
- 調查方法
第4章 產業主要趨勢
- 有機栽培面積
- 有機產品人均支出
- 法律規範
- 阿根廷
- 澳洲
- 巴西
- 加拿大
- 中國
- 埃及
- 法國
- 德國
- 印度
- 印尼
- 伊朗
- 義大利
- 日本
- 墨西哥
- 荷蘭
- 奈及利亞
- 菲律賓
- 俄羅斯
- 南非
- 西班牙
- 泰國
- 土耳其
- 英國
- 美國
- 越南
- 價值鏈與通路分析
第5章 市場區隔
- 形式
- 生物真菌劑
- 生物除草劑
- 生物殺蟲劑
- 其他生物農藥
- 作物類型
- 經濟作物
- 園藝作物
- 耕作作物
- 地區
- 非洲
- 按國家
- 埃及
- 奈及利亞
- 南非
- 非洲其他地區
- 亞太地區
- 按國家
- 澳洲
- 中國
- 印度
- 印尼
- 日本
- 菲律賓
- 泰國
- 越南
- 其他亞太地區
- 歐洲
- 按國家
- 法國
- 德國
- 義大利
- 荷蘭
- 俄羅斯
- 西班牙
- 土耳其
- 英國
- 其他歐洲國家
- 中東
- 按國家
- 伊朗
- 沙烏地阿拉伯
- 其他中東地區
- 北美洲
- 按國家
- 加拿大
- 墨西哥
- 美國
- 北美其他地區
- 南美洲
- 按國家
- 阿根廷
- 巴西
- 南美洲其他地區
- 非洲
第6章 競爭格局
- 主要策略趨勢
- 市場佔有率分析
- 業務狀況
- 公司簡介.
- Andermatt Group AG
- Atlantica Agricola
- Biolchim SPA
- Bioworks Inc.
- Certis USA LLC
- Corteva Agriscience
- Gujarat State Fertilizers & Chemicals Ltd
- Henan Jiyuan Baiyun Industry Co. Ltd
- IPL Biologicals Limited
- Koppert Biological Systems Inc.
- Lallemand Inc.
- Marrone Bio Innovations Inc.
- Seipasa SA
- T Stanes and Company Limited
- Valent Biosciences LLC
第7章:執行長的關鍵策略問題
第 8 章 附錄
- 世界概況
- 概述
- 五力分析框架
- 全球價值鏈分析
- 市場動態(DRO)
- 資訊來源和進一步閱讀
- 圖片列表
- 關鍵見解
- 資料包
- 詞彙表
The Biopesticides Market size is estimated at 6.72 billion USD in 2025, and is expected to reach 11.41 billion USD by 2030, growing at a CAGR of 11.19% during the forecast period (2025-2030).
- Biopesticides are made from natural materials such as animals, plants, bacteria, and certain minerals. They are used to control pests in an environmentally friendly way by harnessing natural mechanisms of control. Biopesticides are often selective, and they target specific pests, thereby reducing the impact on non-target species and the environment. Biopesticides are also typically less toxic to humans and animals, and they break down more quickly in the environment.
- Biofungicides are the most popularly used biopesticides. They held a market share of 47.6% in 2022. Bacillus, Trichoderma, Streptomyces, and Pseudomonas are the most commercially used species of microorganisms in agriculture. These biofungicides effectively act against pathogens, such as Pythium, Rhizoctonia, Fusarium, Sclerotinia, Thielaviopsis, Botrytis, and powdery mildew.
- Bioinsecticides accounted for 27.9% of the global biopesticides market in 2022. There are several pests that cause devastating losses to specific crops in each season, which can be effectively controlled by using target-specific bioinsecticides. For instance, cotton is an important cash crop grown globally. The cotton bollworm pest affects the yield of cotton plants, irrespective of the region. Bacillus thuringiensis , a commercially important bioinsecticide, is known to effectively control this devastating pest that can cause potential yield losses of 30-90%.
- The effectiveness of biopesticides in controlling target-specific pests and diseases with no harm to the environment and animals is expected to drive the global market for biopesticides. The biopesticides market is estimated to register a CAGR of 11.0% between 2023 and 2029.
- Biopesticides are used to control pests in an eco-friendly way by harnessing natural control mechanisms. Biopesticides are often selective and target specific pests, reducing the impact on non-target species and the environment. Asia-Pacific and North America were the most biopesticides-consuming regions in 2022.
- The Asia-Pacific region, which is home to large agricultural countries like China and India, has seen significant growth in organic farming. This growth has been driven by rising demand for sustainable and healthier food options and increased awareness about the harmful effects of conventional pesticides. The organic crop area in the region increased from 3.1 million hectares in 2017 to 3.6 million hectares in 2021, representing a growth of 15.5% during the period.
- North America is the second most biopesticides-consuming region, and it had a share of 38.5% in 2021. The demand for organic food in the region is growing rapidly. The average per capita spending on organic food products in North America was recorded as USD 109.7 in 2021. Farmers of the region are adapting to new biological technologies at a faster pace. The trend toward sustainable agriculture is expected to drive the usage of biopesticides in the region.
- Government initiatives and promotion of organic farming in different regions further intensify this trend of sustainable approaches. For instance, the European Commission has unveiled an action plan to increase the organic area in the member countries to occupy 25.0% of the region's agricultural land area by 2030. Government authorities in South American countries like Peru and Argentina have banned the usage of chemical pesticides, thus driving the South American biopesticides market.
Global Biopesticides Market Trends
Organic production is at an all-time high in North America and Europe, due to the increasing awareness and Government initiatives.
- Organic agriculture has emerged as a significant contributor to sustainable food systems, with 187 countries practicing it globally. As of 2021, there was 72.3 million ha of organic agricultural land worldwide, with an average increase of 2.9% across all regions from 2018 to 2021. Organic arable land accounted for 14.4 million ha, representing 19.9% of the total organic agricultural land.
- The strongest markets for organic farming are North America and Europe, accounting for 41.0% of the global organic arable land. In 2022, Europe had 6.5 million ha of organic arable land, equivalent to 44.1% of the overall organic arable agricultural area. The most significant crops grown organically in North America and Europe are apples, strawberries, cereals, and olives.
- Developing countries in Asia-Pacific are also joining the organic agriculture movement and becoming self-sufficient in producing and providing fresh organic produce to meet their domestic demand. The trend of organic farming is gaining momentum in Asia-Pacific, with the region recording an 18.8% increase in organic arable land from 2017 to 2022. The major initiatives by governments in the region also play a vital role in the growing trend of organic farming. For example, Japan's Basic Plan for Food, Agriculture, and Rural Areas aims to triple the number of organic farmers and lands by 2030.
- Organic agriculture is becoming increasingly popular worldwide, with more countries adopting it to achieve sustainable food systems. The growth in organic agriculture is driven by the increasing awareness of the benefits of organic farming, such as promoting soil health, reducing negative environmental impacts, and producing healthier food.
Per capita spending of organic food majorly observed in United States and Germany, attributed to the consumer demand for healthier and sustainable food
- The organic food market experienced significant growth in the past few years, with global sales reaching USD 120.6 billion in 2020, up from USD 70.8 billion in 2012. The trend toward organic food is being driven by several factors, such as increasing consumer demand for healthier, more sustainable food options and a growing awareness of the environmental impact of conventional agriculture. The global organic food market is expected to continue its growth trend over the coming years.
- According to a survey conducted by the Organic Trade Association in 2021, sales of organic fruits and vegetables increased by around 4.5% in the same year, accounting for 15% of the overall organic sales. North America dominates the market in terms of average spending on organic products, with per capita spending in the United States reaching USD 186.7 in 2021, the highest among all North American countries. Europe is also expected to experience significant growth in the organic food market, with Germany accounting for the highest per capita spending of USD 75.6 in 2021.
- While the organic food market is still dominated by developed countries with high consumer disposable incomes, it is also expected to grow in developing nations. For example, the increasing number of working-class people in the Asia-Pacific region may contribute to the market's expansion due to the growing availability and affordability of organic food products.
Biopesticides Industry Overview
The Biopesticides Market is fragmented, with the top five companies occupying 6.03%. The major players in this market are Corteva Agriscience, Gujarat State Fertilizers & Chemicals Ltd, Koppert Biological Systems Inc., Marrone Bio Innovations Inc. and Valent Biosciences LLC (sorted alphabetically).
Additional Benefits:
- The market estimate (ME) sheet in Excel format
- 3 months of analyst support
TABLE OF CONTENTS
1 EXECUTIVE SUMMARY & KEY FINDINGS
2 REPORT OFFERS
3 INTRODUCTION
- 3.1 Study Assumptions & Market Definition
- 3.2 Scope of the Study
- 3.3 Research Methodology
4 KEY INDUSTRY TRENDS
- 4.1 Area Under Organic Cultivation
- 4.2 Per Capita Spending On Organic Products
- 4.3 Regulatory Framework
- 4.3.1 Argentina
- 4.3.2 Australia
- 4.3.3 Brazil
- 4.3.4 Canada
- 4.3.5 China
- 4.3.6 Egypt
- 4.3.7 France
- 4.3.8 Germany
- 4.3.9 India
- 4.3.10 Indonesia
- 4.3.11 Iran
- 4.3.12 Italy
- 4.3.13 Japan
- 4.3.14 Mexico
- 4.3.15 Netherlands
- 4.3.16 Nigeria
- 4.3.17 Philippines
- 4.3.18 Russia
- 4.3.19 South Africa
- 4.3.20 Spain
- 4.3.21 Thailand
- 4.3.22 Turkey
- 4.3.23 United Kingdom
- 4.3.24 United States
- 4.3.25 Vietnam
- 4.4 Value Chain & Distribution Channel Analysis
5 MARKET SEGMENTATION (includes market size in Value in USD and Volume, Forecasts up to 2030 and analysis of growth prospects)
- 5.1 Form
- 5.1.1 Biofungicides
- 5.1.2 Bioherbicides
- 5.1.3 Bioinsecticides
- 5.1.4 Other Biopesticides
- 5.2 Crop Type
- 5.2.1 Cash Crops
- 5.2.2 Horticultural Crops
- 5.2.3 Row Crops
- 5.3 Region
- 5.3.1 Africa
- 5.3.1.1 By Country
- 5.3.1.1.1 Egypt
- 5.3.1.1.2 Nigeria
- 5.3.1.1.3 South Africa
- 5.3.1.1.4 Rest of Africa
- 5.3.2 Asia-Pacific
- 5.3.2.1 By Country
- 5.3.2.1.1 Australia
- 5.3.2.1.2 China
- 5.3.2.1.3 India
- 5.3.2.1.4 Indonesia
- 5.3.2.1.5 Japan
- 5.3.2.1.6 Philippines
- 5.3.2.1.7 Thailand
- 5.3.2.1.8 Vietnam
- 5.3.2.1.9 Rest of Asia-Pacific
- 5.3.3 Europe
- 5.3.3.1 By Country
- 5.3.3.1.1 France
- 5.3.3.1.2 Germany
- 5.3.3.1.3 Italy
- 5.3.3.1.4 Netherlands
- 5.3.3.1.5 Russia
- 5.3.3.1.6 Spain
- 5.3.3.1.7 Turkey
- 5.3.3.1.8 United Kingdom
- 5.3.3.1.9 Rest of Europe
- 5.3.4 Middle East
- 5.3.4.1 By Country
- 5.3.4.1.1 Iran
- 5.3.4.1.2 Saudi Arabia
- 5.3.4.1.3 Rest of Middle East
- 5.3.5 North America
- 5.3.5.1 By Country
- 5.3.5.1.1 Canada
- 5.3.5.1.2 Mexico
- 5.3.5.1.3 United States
- 5.3.5.1.4 Rest of North America
- 5.3.6 South America
- 5.3.6.1 By Country
- 5.3.6.1.1 Argentina
- 5.3.6.1.2 Brazil
- 5.3.6.1.3 Rest of South America
- 5.3.1 Africa
6 COMPETITIVE LANDSCAPE
- 6.1 Key Strategic Moves
- 6.2 Market Share Analysis
- 6.3 Company Landscape
- 6.4 Company Profiles (includes Global Level Overview, Market Level Overview, Core Business Segments, Financials, Headcount, Key Information, Market Rank, Market Share, Products and Services, and Analysis of Recent Developments).
- 6.4.1 Andermatt Group AG
- 6.4.2 Atlantica Agricola
- 6.4.3 Biolchim SPA
- 6.4.4 Bioworks Inc.
- 6.4.5 Certis USA LLC
- 6.4.6 Corteva Agriscience
- 6.4.7 Gujarat State Fertilizers & Chemicals Ltd
- 6.4.8 Henan Jiyuan Baiyun Industry Co. Ltd
- 6.4.9 IPL Biologicals Limited
- 6.4.10 Koppert Biological Systems Inc.
- 6.4.11 Lallemand Inc.
- 6.4.12 Marrone Bio Innovations Inc.
- 6.4.13 Seipasa SA
- 6.4.14 T Stanes and Company Limited
- 6.4.15 Valent Biosciences LLC
7 KEY STRATEGIC QUESTIONS FOR AGRICULTURAL BIOLOGICALS CEOS
8 APPENDIX
- 8.1 Global Overview
- 8.1.1 Overview
- 8.1.2 Porter's Five Forces Framework
- 8.1.3 Global Value Chain Analysis
- 8.1.4 Market Dynamics (DROs)
- 8.2 Sources & References
- 8.3 List of Tables & Figures
- 8.4 Primary Insights
- 8.5 Data Pack
- 8.6 Glossary of Terms
 生物農藥市場:全球產業分析、市場規模、佔有率、成長、趨勢與未來預測(2025-2032)
 美國生物防治劑:市場佔有率分析、產業趨勢與統計、成長預測(2025-2030 年)
 全球生物農藥市場研究報告 - 產業分析、規模、佔有率、成長、趨勢及 2025 至 2033 年預測
 2025 年生物防治全球市場報告
 生物殺線蟲劑市場 - 全球產業規模、佔有率、趨勢、機會和預測,按類型、形式、作物類型、治療方式、感染、地區和競爭進行細分,2020 年至 2030 年預測
 生物農藥市場 - 全球產業規模、佔有率、趨勢、機會和預測,按類型、按作物類型、按應用、按配方、按地區和競爭進行細分,2020-2030 年
 全球生物農藥市場按類型、作物類型、配方、原料、使用方法和地區分類 - 預測至 2029 年
 2025-2029 年全球生物農藥市場
 2025 年全球生物農藥市場報告
 2030 年農業驅蟲劑市場預測:按類型、害蟲類型、作物類型、配方、作用方式、最終用戶和地區進行的全球分析