


 |
市場調查報告書
商品編碼
1685746
美國生物防治劑:市場佔有率分析、產業趨勢與統計、成長預測(2025-2030 年)United States Biopesticides - Market Share Analysis, Industry Trends & Statistics, Growth Forecasts (2025 - 2030) |
||||||
價格
※ 本網頁內容可能與最新版本有所差異。詳細情況請與我們聯繫。
簡介目錄
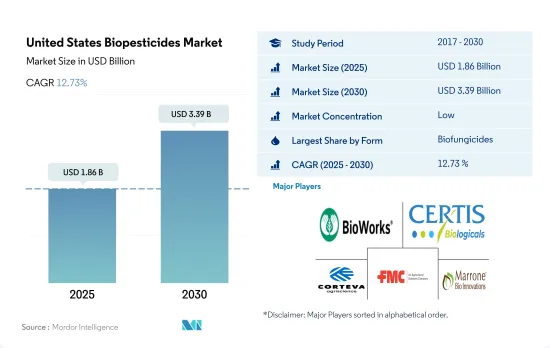
預計 2025 年美國生物農藥市場規模為 18.6 億美元,到 2030 年將達到 33.9 億美元,預測期內(2025-2030 年)的複合年成長率為 12.73%。
- 生物農藥是用來控制由病原真菌引起的植物疾病的物質。生物農藥來自微生物或植物來源。預計2022年該類生物農藥的市場規模將達6.509億美元,同年市場佔有率為49.5%,成為消費量最大的生物農藥類型。
- 預計2022年美國生物農藥市值將達4.039億美元,佔30.7%,成為第二大生物農藥消費量國。
- 生物農藥來自生物來源,包括真菌和細菌等微生物,甚至植物抽取物,能夠對抗影響作物生長發育的有害昆蟲。這些生物農藥在所有作物類型的施用量平均為 2.8 公斤/公頃。在生物農藥中,細菌殺蟲劑蘇力菌是農業中使用最廣泛的殺蟲劑,因為它在孢子形成階段透過產生蛋白質來控制害蟲具有巨大的潛力。
- 生物除草劑是微生物、植物抽取物或其他植物毒素的衍生物,透過抑制雜草生長或抑制雜草種子發芽來控制與作物競爭的雜草。 2022年生物除草劑市場價值為1.089億美元,同年消費量為7,500噸。
- 其他生物農藥包括生物來源的產品,例如殺線蟲劑、殺鼠劑、殺蟎劑和殺軟體動物劑。到2022年,這些生物農藥將佔據11.5%的佔有率,位居生物殺菌劑和生物殺蟲劑之後的第三位。
美國生物農藥市場趨勢
由於國家法規的實施,有機種植面積增加,尤其是連作作物。
- 2021年,美國有機農業面積為62.3萬公頃。過去二十年來,美國的有機農業取得了顯著成長,這主要歸功於具體法律法規的實施。加州是美國有機認證農場最多的州,2021 年有 3,061 個有機農場。賓州有超過 1,125 個有機認證農場。 2019 年,有近 15,548,000 個經過認證的有機農場運作作物,有 7,139,000 個農場經營牧場和草場。包括苗圃和溫室在內的作物銷售額達到近 58 億美元。
- 該國的有機農業以種植作物為主。 2021年,其占有機農地總面積的約71.8%。穀類生產是該國農業的主要支柱。主要穀物有玉米、小麥、稻米、小米等。有機產品的消費在美國消費者中越來越流行,他們擴大選擇有機食品,因為它們具有多種健康益處。
- 有機園藝作物的總種植面積正在增加,從 2017 年的 112,900 公頃增加到 2021 年的 156,100 公頃。就 2021 年國內產量而言,前五的水果和蔬菜是蘋果(31.1%)、草莓(9.5%)、橘子(6.9%)、羅馬生菜(6.7%)和馬鈴薯(6.2%)。在貿易方面,進口量最大的產品是香蕉(53.1%)、酪梨(7.7%)、芒果(5.8%)、藍莓(5.0%)和南瓜(4.3%),出口量最大的產品是蘋果(80.0%)、梨子(14.4%)、櫻桃(4.0%)、洋蔥乾(1.5%)。
對有機農產品的需求不斷增加,尤其是在水果和蔬菜領域,人均有機食品支出也在增加
- 美國是世界最大的有機產品消費國。根據《營養日誌雜誌》(NBJ,2021)報道,截至 2020 年,該國有機食品總銷售額達 516 億美元。美國是北美地區人均有機產品支出最高的國家,2021年為186.7美元。
- 自有機食品零售業誕生以來,有機新鮮水果和蔬菜一直是主導的有機食品類別。 2020年,這些有機產品的零售額價值200億美元,顯示對有機農產品的需求不斷增加。過去二十年來,對有機新鮮水果和蔬菜的需求穩定成長。有機食品銷售的成長是由於消費者意識的增強,尤其是高所得族群。需求量最大的有機食品類別包括雞蛋、乳製品、水果和蔬菜等主食。
- 不同人群和地區的人們對有機食品的偏好各不相同。 18-29 歲的年輕人比 65 歲以上的老年人更有可能想要有機產品(超過 50%)。收入和地區也起著一定的作用,42% 的收入低於 30,000 美元的人想要有機產品,而 49% 的收入超過 75,000 美元的人想要有機產品。
- 美國的人均有機產品支出正在增加,2017 年至 2021 年的複合年成長率為 5.2%。對有機產品的需求不斷成長,為美國有機生產商創造了機會,使其能夠進入國內和國際高價值市場。有機產品的價格溢價是低收入消費者消費有機食品的主要限制因素之一。
美國生物防治產業概況
美國生物農藥市場分散,前五大公司佔6.02%的市佔率。該市場的主要企業有:Bioworks Inc.、Certis USA LLC、Corteva Agriscience、FMC Corporation 和 Marrone Bio Innovations Inc.。
其他福利
- Excel 格式的市場預測 (ME) 表
- 3個月的分析師支持
目錄
第1章執行摘要和主要發現
第2章 報告要約
第3章 引言
- 研究假設和市場定義
- 研究範圍
- 調查方法
第4章 產業主要趨勢
- 有機種植區
- 有機產品人均支出
- 法律規範
- 美國
- 價值鍊和通路分析
第5章市場區隔
- 形式
- 生物防治劑
- 生物除草劑
- 生物防治劑
- 其他生物防治劑
- 作物類型
- 經濟作物
- 園藝作物
- 耕地作物
第6章 競爭格局
- 重大策略舉措
- 市場佔有率分析
- 商業狀況
- 公司簡介.
- Andermatt Group AG
- Bioworks Inc.
- Certis USA LLC
- Corteva Agriscience
- FMC Corporation
- Indogulf BioAg LLC(Biotech Division of Indogulf Company)
- Lallemand Inc.
- Marrone Bio Innovations Inc.
- Terramera Inc.
- Valent Biosciences LLC
第7章:CEO面臨的關鍵策略問題
第 8 章 附錄
- 世界概況
- 概述
- 五力分析框架
- 全球價值鏈分析
- 市場動態(DRO)
- 資訊來源及延伸閱讀
- 圖片列表
- 關鍵見解
- 資料包
- 詞彙表
簡介目錄
Product Code: 46900
The United States Biopesticides Market size is estimated at 1.86 billion USD in 2025, and is expected to reach 3.39 billion USD by 2030, growing at a CAGR of 12.73% during the forecast period (2025-2030).
- Biofungicides are substances that are used to control plant diseases caused by pathogenic fungi. Biofungicides may be of microbial or botanical origin. The market for these biofungicides was valued at USD 650.9 million in 2022 and is the most consumed biopesticide type, with a market share of 49.5% in the same year.
- The market for bioinsecticides in the United States was valued at USD 403.9 million in 2022 and accounted for a share of 30.7%, the second most consumed among biopesticides.
- Bioinsecticides are of biological origin, including microorganisms like fungi, bacteria, or even plant extracts that can work against harmful insects that affect the growth and development of crops. On average, these bioinsecticides are applied at the rate of 2.8 kg/hectare in all the crop types. Among bioinsecticides, the bacterial insecticide Bacillus Thuringiensisis the most predominantly used insecticide in agriculture due to its immense potential to control pests by producing proteins during the sporulation phase.
- Bioherbicides are the derivatives of either microbe, plant extracts, or any other phytotoxins used to control the weeds that compete for growth with the crops by suppressing their growth or germinating weed seeds. The market for biological herbicides was valued at USD 108.9 million in 2022, with a volume consumption of 7.5 thousand metric tons in the same year.
- Other biopesticides include products like nematicides, rodenticides, acaricides, and molluscicides, which are of biological origin. These biological pesticides accounted for a share of 11.5% in 2022, occupying the third place after biofungicides and bioinsecticides.
United States Biopesticides Market Trends
Increase in organic area, particularly in row crops, due to country's laws and regulations
- In 2021, the area under organic agricultural farming in the United States was 623 thousand hectares. Organic agriculture in the United States has increased significantly in the previous 20 years, mostly due to the introduction of particular laws and regulations. The number of organic farms and ranches in California was 3,061 in 2021, the largest number of certified organic farms in the United States. There were over 1,125 certified organic farms in Pennsylvania. Nearly 15,548 thousand certified organic farms in operation used cropland in 2019, while 7,139 thousand farms operated pastureland and rangeland. The sales value of crops, including those from nurseries and greenhouses, amounted to nearly USD 5.8 billion.
- Row crops dominated organic farming in the nation. In 2021, they accounted for about 71.8% of all organic cropland. The production of cereal crops predominates the country's agricultural sector. The main cereals include maize, wheat, rice, and millet. The consumption of organic products has become popular among US consumers who increasingly choose to eat organic foods because of their various health benefits.
- There is an increasing trend in the overall organic horticultural crop cultivation area, from 112.9 thousand hectares in 2017 to 156.1 thousand hectares in 2021. Regarding domestic production in 2021, the top five fruits and vegetables were apples (31.1%), strawberries (9.5%), oranges (6.9%), romaine lettuce (6.7%), and potatoes (6.2%). In the case of trade, the most imported produce was bananas (53.1%), avocados (7.7%), mangoes (5.8%), blueberries (5.0%), and squashes (4.3%), while the most exported were apples (80.0%), pears (14.4%), cherries (4.0%), dried onions (1.5%), and potatoes (0.2%).
Growing demand for organic produce especially in the fruits and vegetables sector, rise in per capita spending on organic food
- The United States is one of the largest organic product consumers in the world. As of 2020, the total sales of organic food products in the country accounted for USD 51.6 billion, according to the Nutrition Business Journal (NBJ, 2021). The United States had the largest per capita spending on organic products in the North American region, worth USD 186.7 in 2021.
- Organic fresh fruits and vegetables have been the leading category of organic food since the establishment of the organic food retail industry. In 2020, retail sales for these organic products were valued at USD 20.0 billion, showing a growing demand for organic produce. The demand for organic fresh fruits and vegetables has steadily risen over the past two decades. Organic food sales are rising due to growing consumer awareness, especially among high-income consumers. The most in-demand organic categories include basic foods like eggs, dairy, fruits, and vegetables.
- Organic food preferences vary by demographic and region. Younger people aged between 18 and 29 are more likely to seek organic products (over 50%) compared to older people aged 65 and above. Income and region also play a role, with 42% of those with under USD 30,000 income and 49% of those with over USD 75.0 thousand seeking organic products.
- The per capita spending on organic products is increasing in the country, recording a CAGR of 5.2% between 2017 and 2021. The growing demand for organic products is creating opportunities for US organic producers to tap into high-value markets both domestically and abroad. The price premium associated with organic products is one of the major limiting factors for organic food consumption for low-income consumers.
United States Biopesticides Industry Overview
The United States Biopesticides Market is fragmented, with the top five companies occupying 6.02%. The major players in this market are Bioworks Inc., Certis USA LLC, Corteva Agriscience, FMC Corporation and Marrone Bio Innovations Inc. (sorted alphabetically).
Additional Benefits:
- The market estimate (ME) sheet in Excel format
- 3 months of analyst support
TABLE OF CONTENTS
1 EXECUTIVE SUMMARY & KEY FINDINGS
2 REPORT OFFERS
3 INTRODUCTION
- 3.1 Study Assumptions & Market Definition
- 3.2 Scope of the Study
- 3.3 Research Methodology
4 KEY INDUSTRY TRENDS
- 4.1 Area Under Organic Cultivation
- 4.2 Per Capita Spending On Organic Products
- 4.3 Regulatory Framework
- 4.3.1 United States
- 4.4 Value Chain & Distribution Channel Analysis
5 MARKET SEGMENTATION (includes market size in Value in USD and Volume, Forecasts up to 2030 and analysis of growth prospects)
- 5.1 Form
- 5.1.1 Biofungicides
- 5.1.2 Bioherbicides
- 5.1.3 Bioinsecticides
- 5.1.4 Other Biopesticides
- 5.2 Crop Type
- 5.2.1 Cash Crops
- 5.2.2 Horticultural Crops
- 5.2.3 Row Crops
6 COMPETITIVE LANDSCAPE
- 6.1 Key Strategic Moves
- 6.2 Market Share Analysis
- 6.3 Company Landscape
- 6.4 Company Profiles (includes Global Level Overview, Market Level Overview, Core Business Segments, Financials, Headcount, Key Information, Market Rank, Market Share, Products and Services, and Analysis of Recent Developments).
- 6.4.1 Andermatt Group AG
- 6.4.2 Bioworks Inc.
- 6.4.3 Certis USA LLC
- 6.4.4 Corteva Agriscience
- 6.4.5 FMC Corporation
- 6.4.6 Indogulf BioAg LLC (Biotech Division of Indogulf Company)
- 6.4.7 Lallemand Inc.
- 6.4.8 Marrone Bio Innovations Inc.
- 6.4.9 Terramera Inc.
- 6.4.10 Valent Biosciences LLC
7 KEY STRATEGIC QUESTIONS FOR AGRICULTURAL BIOLOGICALS CEOS
8 APPENDIX
- 8.1 Global Overview
- 8.1.1 Overview
- 8.1.2 Porter's Five Forces Framework
- 8.1.3 Global Value Chain Analysis
- 8.1.4 Market Dynamics (DROs)
- 8.2 Sources & References
- 8.3 List of Tables & Figures
- 8.4 Primary Insights
- 8.5 Data Pack
- 8.6 Glossary of Terms
02-2729-4219
+886-2-2729-4219
 生物農藥市場:全球產業分析、市場規模、佔有率、成長、趨勢與未來預測(2025-2032)
 歐洲生物防治化學品:市場佔有率分析、產業趨勢與統計、成長預測(2025-2030 年)
 生物農藥:市場佔有率分析、產業趨勢與統計、成長預測(2025-2030 年)
 全球生物農藥市場研究報告 - 產業分析、規模、佔有率、成長、趨勢及 2025 至 2033 年預測
 2025 年生物防治全球市場報告
 生物殺線蟲劑市場 - 全球產業規模、佔有率、趨勢、機會和預測,按類型、形式、作物類型、治療方式、感染、地區和競爭進行細分,2020 年至 2030 年預測
 生物農藥市場 - 全球產業規模、佔有率、趨勢、機會和預測,按類型、按作物類型、按應用、按配方、按地區和競爭進行細分,2020-2030 年
 全球生物農藥市場按類型、作物類型、配方、原料、使用方法和地區分類 - 預測至 2029 年
 2025-2029 年全球生物農藥市場
 2025 年全球生物農藥市場報告
▼