


 |
市場調查報告書
商品編碼
1685815
飼料酸味劑:市場佔有率分析、產業趨勢與統計、成長預測(2025-2030 年)Feed Acidifiers - Market Share Analysis, Industry Trends & Statistics, Growth Forecasts (2025 - 2030) |
||||||
價格
※ 本網頁內容可能與最新版本有所差異。詳細情況請與我們聯繫。
簡介目錄
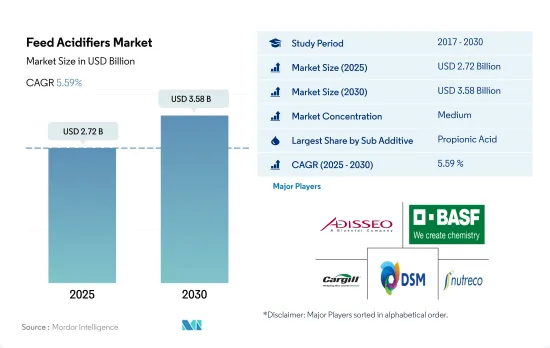
飼料酸味劑市場規模預計在 2025 年為 27.2 億美元,預計到 2030 年將達到 35.8 億美元,預測期內(2025-2030 年)的複合年成長率為 5.59%。
- 飼料酸味劑是動物飼料的重要組成部分,可促進生長和代謝,增加飼料攝取量,抵抗有害病原體,同時減少對抗生素的依賴。 2022年,飼料酸味劑將佔全球飼料添加劑市場的7%,成為全球最重要的飼料添加劑之一。
- 亞太地區是飼料酸味劑最大的區域市場,2022 年佔市場佔有率的 31.3%。北美和歐洲緊隨其後,市場佔有率分別為 26.1% 和 23%。亞太地區所佔佔有率較高是由於添加劑的普遍存在和動物數量龐大。美國是雞肉和牛肉等多種肉類的最大生產國和出口國之一,這使得北美成為最大的飼料生產國之一。該地區廣泛採用飼料酸味劑作為抗生素的替代品來生產高品質飼料。
- 丙酸是最廣泛使用的飼料酸味劑,佔 2022 年全球飼料酸味劑市場的最大佔有率,價值 8 億美元。這是因為它具有抗菌特性,能夠以低濃度抑制黴菌和某些細菌的生長。以金額為準,其次是富馬酸和乳酸。
- 預計其他飼料酸味劑領域將以類似的速度成長,預測期內複合年成長率為 5.6%,這主要歸因於酸化劑能夠增加牲畜飼料攝取量和牲畜生產力。
- 人們對飼料添加劑的有效利用的認知不斷提高、商業性農業的趨勢日益上升以及酸化劑充當抗生素的能力預計將推動全球飼料酸化劑市場在預測期內以 5.6% 的複合年成長率成長。
- 全球飼料酸味劑市場預計將成為全球主要飼料添加劑市場之一,到 2022 年將佔全球飼料添加劑市場的 7%。飼料酸味劑作為抗生素的替代品,透過促進動物生長和新陳代謝,提高對細菌等有害病原體的抵抗力,已經變得越來越重要。
- 乳酸因其易於獲取而佔據 2022 年全球飼料酸味劑市場金額的最大佔有率,為 34.4%。然而,丙酸預計將成為成長最快的市場,預測期內複合年成長率為 5.7%。
- 2022 年,亞太地區是全球最大的飼料酸味劑市場地區,市值達 7.282 億美元。該地區較高的市場佔有率歸因於高滲透率和2022年約5億噸的飼料產量。
- 美國成為全球飼料酸味劑市場最大的國家,2022 年佔 18.3% 的市場佔有率,金額約 4 億美元。這一市場地位主要歸功於大規模商業性畜牧養殖和國家注重在畜牧養殖場引進新生產方法。預計日本和墨西哥在預測期內將實現成長,由於這些國家的投資增加,複合年成長率將達到 6.3%。
- 全球人口的成長、飼料產量的增加以及對酸味劑作為抗生素替代品的認知的不斷提高,預計將推動飼料酸味劑市場的發展,預計預測期內的複合年成長率為 5.6%。
飼料酸味劑市場的全球趨勢
市場對動物性蛋白質和雞蛋等家禽產品的需求不斷成長,加上對家禽業的投資不斷增加,導致家禽數量不斷增加。
- 近年來,吃雞人口大幅增加,主要原因是日常飲食中對雞肉和雞蛋的需求不斷增加。在美國,豬肉等其他肉類價格的上漲推動了人們轉向雞肉製品的轉變。 2017年至2021年間,歐洲雞蛋消費量也將成長4.6%,到2021年達到6,135噸。
- 亞太地區是最大的家禽生產地區,預計 2022 年產量將比 2017 年增加 6.6%。雞肉產量增加的原因是,非洲豬瘟爆發後對動物性蛋白質的需求增加,導致豬肉供應減少。中國佔世界雞肉產量的40%,飼養蛋雞超過9億隻,其最大的蛋雞養殖中心每年可孵化出6000萬隻雞雛。
- 預測期內(2023-2029 年),中東地區的雞肉產量也預計將成長。沙烏地阿拉伯的 Almarai 等公司正在大力投資該產業,斥資 11.2 億美元建立新農場以擴大生產。
- 預計家禽產品需求的上升和家禽業投資的增加將推動飼料產量的成長。預計這將在預測期內推動全球市場對飼料添加劑的需求。隨著這些發展,家禽業將在未來幾年內實現顯著成長。
隨著消費者對水產品的需求不斷增加,亞太地區和南美洲的政府也採取舉措,增加養殖魚類的飼料產量。
- 水產養殖業的成長導致飼料需求激增,進而推動了配合飼料產量的成長。 2022年,複合飼料產量與前一年同期比較%,而魚飼料產量在2017年至2022年間增加了46.3%。魚飼料消費量的增加是由於需要維持和改善水產品的性能並提高生產力以滿足日益成長的海鮮需求。
- 由於亞太地區魚類消費量和產量高,魚飼料在 2022 年佔飼料酸味劑市場的 73.2%。繼魚之後,蝦子和其他海洋物種最為普遍,其中歐洲國家和美國從其他地區大量進口蝦子。為了滿足日益成長的水產品需求,各國均致力於擴大水產養殖產量。例如,印度已將漁業部的預算撥款從 2020 年的 1.141 億美元增加到 2021 年的 1.688 億美元,以提高產量,預計這將導致預測期內飼料需求增加。
- 由於水產養殖業的擴張,南美洲的飼料產量也在增加,到 2022 年將達到 510 萬噸,比 2017 年增加 46.4%。該地區是主要的水產品消費區之一,水產品需求的增加推動了水產養殖產量的成長。
- 隨著水產養殖業不斷成長以滿足日益成長的需求,該行業的發展及其擴張重點預計將推動飼料產量的成長。預計預測期內水生生物飼料產量的增加將有助於水產養殖業的成長。
飼料酸味劑產業概況
飼料酸味劑市場呈現中度整合態勢,前五大公司合計佔有41.05%的市佔率。市場的主要企業是:安迪蘇、BASFSE、嘉吉公司、帝斯曼營養產品股份公司和 SHV(Nutreco NV)(按字母順序排列)。
其他福利
- Excel 格式的市場預測 (ME) 表
- 3 個月的分析師支持
目錄
第 1 章執行摘要和主要發現
第2章 報告要約
第 3 章 簡介
- 研究假設和市場定義
- 研究範圍
- 調查方法
第4章 產業主要趨勢
- 動物數量
- 家禽
- 反芻動物
- 豬
- 飼料生產
- 水產養殖
- 家禽
- 反芻動物
- 養豬業
- 法律規範
- 澳洲
- 巴西
- 加拿大
- 中國
- 法國
- 德國
- 印度
- 印尼
- 義大利
- 日本
- 墨西哥
- 荷蘭
- 菲律賓
- 俄羅斯
- 南非
- 韓國
- 西班牙
- 泰國
- 土耳其
- 英國
- 美國
- 越南
- 價值鏈與通路分析
第5章 市場區隔
- 副添加劑
- 富馬酸
- 乳酸
- 丙酸
- 其他酸味劑
- 動物
- 水產養殖
- 亞動物
- 魚
- 蝦
- 其他養殖物種
- 家禽
- 按亞動物
- 肉雞
- 圖層
- 其他鳥類
- 反芻動物
- 按亞動物
- 肉牛
- 乳牛
- 其他反芻動物
- 豬
- 其他動物
- 水產養殖
- 地區
- 非洲
- 按國家
- 埃及
- 肯亞
- 南非
- 非洲其他地區
- 亞太地區
- 按國家
- 澳洲
- 中國
- 印度
- 印尼
- 日本
- 菲律賓
- 韓國
- 泰國
- 越南
- 其他亞太地區
- 歐洲
- 按國家
- 法國
- 德國
- 義大利
- 荷蘭
- 俄羅斯
- 西班牙
- 土耳其
- 英國
- 其他歐洲國家
- 中東
- 按國家
- 伊朗
- 沙烏地阿拉伯
- 其他中東地區
- 北美洲
- 按國家
- 加拿大
- 墨西哥
- 美國
- 北美其他地區
- 南美洲
- 按國家
- 阿根廷
- 巴西
- 智利
- 南美洲其他地區
- 非洲
第6章 競爭格局
- 重大策略舉措
- 市場佔有率分析
- 業務狀況
- 公司簡介.
- Adisseo
- Alltech, Inc.
- BASF SE
- Borregaard AS
- Cargill Inc.
- DSM Nutritional Products AG
- Impextraco NV
- Kemin Industries
- SHV(Nutreco NV)
- Yara International ASA
第7章:執行長的關鍵策略問題
第 8 章 附錄
- 世界概況
- 概述
- 五力分析框架
- 全球價值鏈分析
- 全球市場規模和 DRO
- 資訊來源和進一步閱讀
- 圖表清單
- 關鍵見解
- 資料包
- 詞彙表
簡介目錄
Product Code: 47984
The Feed Acidifiers Market size is estimated at 2.72 billion USD in 2025, and is expected to reach 3.58 billion USD by 2030, growing at a CAGR of 5.59% during the forecast period (2025-2030).
- Feed acidifiers are an important component of animal feed, promoting growth and metabolism, increasing feed intake, and protecting against harmful pathogens while reducing the reliance on antibiotics. In 2022, feed acidifiers represented 7% of the global feed additives market, making them one of the most significant types of feed additives worldwide.
- Asia-Pacific was the largest regional market for feed acidifiers, accounting for 31.3% of the market in 2022. North America and Europe followed closely, with market shares of 26.1% and 23%, respectively. The higher share of Asia-Pacific was attributed to the higher penetration rates of additives and a greater animal population. The United States is one of the largest producers and exporters of different meats, such as poultry and beef meat, which has helped North America become one of the largest feed manufacturers. The adoption of feed acidifiers is high in the region as an alternative to antibiotics for producing high-quality feed.
- Propionic acid was the most widely used feed acidifier, accounting for the largest share of the global feed acidifiers market in 2022, valued at USD 0.8 billion. This was due to its antimicrobial properties and ability to inhibit the growth of mold and some bacteria at low concentrations. Its share was followed by fumaric acid and lactic acid in terms of value.
- The other feed acidifiers segment is expected to grow at a similar rate with a CAGR of 5.6% during the forecast period, primarily due to the acidifiers' ability to increase animal feed intake and the productivity of animals.
- The increasing awareness of the beneficial usage of feed additives, the growing trend of commercial farming, and the ability of acidifiers to function as antibiotics are expected to drive the global feed acidifiers market with a CAGR of 5.6% during the forecast period.
- The global feed acidifiers market emerged as one of the significant feed additive markets worldwide, accounting for 7% of the global feed additives market in 2022. Feed acidifiers gained importance in promoting animal growth and metabolism and resistance to harmful pathogens such as bacteria, thereby serving as an alternative to antibiotics.
- Lactic acid had the largest market share of 34.4% in the global feed acidifiers market value in 2022, owing to its easier availability. However, propionic acid is expected to emerge as the fastest-growing market, registering a CAGR of 5.7% during the forecast period, mainly due to product innovations and growing market penetration.
- Asia-Pacific was the largest region in the world for the feed acidifiers market in 2022, accounting for a market value of USD 728.2 million. This region's higher market share can be attributed to its higher penetration rate and feed production volume, which was around 0.5 billion metric tons in 2022.
- The United States emerged as the largest country globally for the feed acidifiers market, accounting for 18.3% of the market share in 2022, which was nearly USD 0.4 billion in value. This market position is mainly due to extensive commercial animal cultivation and the country's focus on implementing new production practices in animal farms. Both Japan and Mexico are expected to grow and register a CAGR of 6.3% during the forecast period due to increasing investments in these countries.
- The global population increase, increase in feed production, and the growing awareness of acidifiers as an alternative to antibiotics are expected to drive the feed acidifiers market, registering a CAGR of 5.6% during the forecast period.
Global Feed Acidifiers Market Trends
High demand for animal protein and poultry products such as eggs with increasing investment in poultry sector is increasing poultry population
- The poultry population has significantly increased in recent years, primarily due to the growing demand for chicken meat and eggs in daily diets. The shift toward poultry products has been driven in the United States by the increasing prices of other meat, such as pig meat. The consumption of eggs in Europe also increased by 4.6% between 2017 and 2021, reaching 6,135 metric ton in 2021.
- Asia-Pacific is the largest producer of poultry birds, with production increasing by 6.6% in 2022 from 2017. The rise in poultry production was due to the growing demand for animal protein following the outbreak of African Swine Fever, which reduced the pork meat supply. China, which accounts for 40% of global poultry production, has more than 900 million stock-laying hens, and the largest layer poultry farming center can hatch 60 million chicks annually.
- The Middle East is also expected to witness growth in poultry production in the forecast period (2023-2029). Companies such as Almarai in Saudi Arabia have invested heavily in the industry, with the company having spent USD 1.12 billion on establishing new farms to expand production.
- The increasing demand for poultry products and rising investments in the poultry industry are expected to boost feed production. This, in turn, is expected to drive the demand for feed additives in the global market during the forecast period. Due to these developments, the poultry industry is poised for significant growth in the coming years.
The growing demand for seafood consumption in Asia-Pacific and South America, and government initiatives is increasing the feed production for aquaculture species
- The demand for feed is rapidly increasing due to the growth of aquaculture, which is driving the growth of compound feed production. In 2022, compound feed production increased by 13.1% from the previous year, and fish feed production increased by 46.3% between 2017 and 2022. The rise in consumption of fish feed is driven by the need to maintain and improve the performance of aquatic animals and increase productivity to meet the growing demand for seafood.
- Fish feed accounted for 73.2% of the feed acidifiers market in 2022, as fish is highly consumed and produced in the Asia-Pacific region. Fish was followed by shrimp and other aquatic species, with shrimp being highly imported by European countries and the United States from other regions. Countries are focusing on increasing aquaculture production to meet the growing demand for seafood. For instance, India increased its budget allocation to the Department of Fisheries from USD 114.1 million in 2020 to USD 168.8 million in 2021 to increase production, which is expected to boost the demand for feed during the forecast period.
- South America is also experiencing an increase in feed production, which rose by 46.4% in 2022 from 2017 to reach 5.1 million metric ton, in line with the expansion of aquaculture farming. The region is one of the major seafood-consuming regions, and the increasing demand for seafood is driving the growth of aquaculture production.
- As aquaculture continues to increase to meet the growing demand, the development of the industry and a focus on its expansion are expected to fuel the growth of feed production. This increase in feed production for aquatic species is expected to aid in the growth of the aquaculture segment during the forecast period.
Feed Acidifiers Industry Overview
The Feed Acidifiers Market is moderately consolidated, with the top five companies occupying 41.05%. The major players in this market are Adisseo, BASF SE, Cargill Inc., DSM Nutritional Products AG and SHV (Nutreco NV) (sorted alphabetically).
Additional Benefits:
- The market estimate (ME) sheet in Excel format
- 3 months of analyst support
TABLE OF CONTENTS
1 EXECUTIVE SUMMARY & KEY FINDINGS
2 REPORT OFFERS
3 INTRODUCTION
- 3.1 Study Assumptions & Market Definition
- 3.2 Scope of the Study
- 3.3 Research Methodology
4 KEY INDUSTRY TRENDS
- 4.1 Animal Headcount
- 4.1.1 Poultry
- 4.1.2 Ruminants
- 4.1.3 Swine
- 4.2 Feed Production
- 4.2.1 Aquaculture
- 4.2.2 Poultry
- 4.2.3 Ruminants
- 4.2.4 Swine
- 4.3 Regulatory Framework
- 4.3.1 Australia
- 4.3.2 Brazil
- 4.3.3 Canada
- 4.3.4 China
- 4.3.5 France
- 4.3.6 Germany
- 4.3.7 India
- 4.3.8 Indonesia
- 4.3.9 Italy
- 4.3.10 Japan
- 4.3.11 Mexico
- 4.3.12 Netherlands
- 4.3.13 Philippines
- 4.3.14 Russia
- 4.3.15 South Africa
- 4.3.16 South Korea
- 4.3.17 Spain
- 4.3.18 Thailand
- 4.3.19 Turkey
- 4.3.20 United Kingdom
- 4.3.21 United States
- 4.3.22 Vietnam
- 4.4 Value Chain & Distribution Channel Analysis
5 MARKET SEGMENTATION (includes market size in Value in USD and Volume, Forecasts up to 2030 and analysis of growth prospects)
- 5.1 Sub Additive
- 5.1.1 Fumaric Acid
- 5.1.2 Lactic Acid
- 5.1.3 Propionic Acid
- 5.1.4 Other Acidifiers
- 5.2 Animal
- 5.2.1 Aquaculture
- 5.2.1.1 By Sub Animal
- 5.2.1.1.1 Fish
- 5.2.1.1.2 Shrimp
- 5.2.1.1.3 Other Aquaculture Species
- 5.2.2 Poultry
- 5.2.2.1 By Sub Animal
- 5.2.2.1.1 Broiler
- 5.2.2.1.2 Layer
- 5.2.2.1.3 Other Poultry Birds
- 5.2.3 Ruminants
- 5.2.3.1 By Sub Animal
- 5.2.3.1.1 Beef Cattle
- 5.2.3.1.2 Dairy Cattle
- 5.2.3.1.3 Other Ruminants
- 5.2.4 Swine
- 5.2.5 Other Animals
- 5.2.1 Aquaculture
- 5.3 Region
- 5.3.1 Africa
- 5.3.1.1 By Country
- 5.3.1.1.1 Egypt
- 5.3.1.1.2 Kenya
- 5.3.1.1.3 South Africa
- 5.3.1.1.4 Rest of Africa
- 5.3.2 Asia-Pacific
- 5.3.2.1 By Country
- 5.3.2.1.1 Australia
- 5.3.2.1.2 China
- 5.3.2.1.3 India
- 5.3.2.1.4 Indonesia
- 5.3.2.1.5 Japan
- 5.3.2.1.6 Philippines
- 5.3.2.1.7 South Korea
- 5.3.2.1.8 Thailand
- 5.3.2.1.9 Vietnam
- 5.3.2.1.10 Rest of Asia-Pacific
- 5.3.3 Europe
- 5.3.3.1 By Country
- 5.3.3.1.1 France
- 5.3.3.1.2 Germany
- 5.3.3.1.3 Italy
- 5.3.3.1.4 Netherlands
- 5.3.3.1.5 Russia
- 5.3.3.1.6 Spain
- 5.3.3.1.7 Turkey
- 5.3.3.1.8 United Kingdom
- 5.3.3.1.9 Rest of Europe
- 5.3.4 Middle East
- 5.3.4.1 By Country
- 5.3.4.1.1 Iran
- 5.3.4.1.2 Saudi Arabia
- 5.3.4.1.3 Rest of Middle East
- 5.3.5 North America
- 5.3.5.1 By Country
- 5.3.5.1.1 Canada
- 5.3.5.1.2 Mexico
- 5.3.5.1.3 United States
- 5.3.5.1.4 Rest of North America
- 5.3.6 South America
- 5.3.6.1 By Country
- 5.3.6.1.1 Argentina
- 5.3.6.1.2 Brazil
- 5.3.6.1.3 Chile
- 5.3.6.1.4 Rest of South America
- 5.3.1 Africa
6 COMPETITIVE LANDSCAPE
- 6.1 Key Strategic Moves
- 6.2 Market Share Analysis
- 6.3 Company Landscape
- 6.4 Company Profiles (includes Global Level Overview, Market Level Overview, Core Business Segments, Financials, Headcount, Key Information, Market Rank, Market Share, Products and Services, and Analysis of Recent Developments).
- 6.4.1 Adisseo
- 6.4.2 Alltech, Inc.
- 6.4.3 BASF SE
- 6.4.4 Borregaard AS
- 6.4.5 Cargill Inc.
- 6.4.6 DSM Nutritional Products AG
- 6.4.7 Impextraco NV
- 6.4.8 Kemin Industries
- 6.4.9 SHV (Nutreco NV)
- 6.4.10 Yara International ASA
7 KEY STRATEGIC QUESTIONS FOR FEED ADDITIVE CEOS
8 APPENDIX
- 8.1 Global Overview
- 8.1.1 Overview
- 8.1.2 Porter's Five Forces Framework
- 8.1.3 Global Value Chain Analysis
- 8.1.4 Global Market Size and DROs
- 8.2 Sources & References
- 8.3 List of Tables & Figures
- 8.4 Primary Insights
- 8.5 Data Pack
- 8.6 Glossary of Terms
02-2729-4219
+886-2-2729-4219
 亞太地區酸味劑市場佔有率分析、產業趨勢與統計、成長預測(2025-2030 年)
 歐洲飼料酸味劑:市場佔有率分析、行業趨勢和統計數據、成長預測(2025-2030 年)
 飼料酸味劑市場:未來預測(2025-2030)
 2025 年全球飼料酸味劑市場報告
 飼料酸味劑市場規模、佔有率、成長分析,按類型、形式、化合物、牲畜、地區 - 產業預測,2024-2031 年
 飼料酸化劑市場:按化合物、形式、牲畜、類型分類 - 2025-2030 年全球預測
 全球飼料酸化劑市場 - 2024-2031
 飼料酸化劑市場-2018-2028年全球產業規模、佔有率、趨勢、機會和預測,按副添加劑(富馬酸、乳酸、丙酸)、動物(水產養殖、家禽、反芻動物、豬)和地區細分, 競賽