


 |
市場調查報告書
商品編碼
1687088
歐洲資料中心 -市場佔有率分析、產業趨勢與統計、成長預測(2025-2030)Europe Data Center - Market Share Analysis, Industry Trends & Statistics, Growth Forecasts (2025 - 2030) |
||||||
※ 本網頁內容可能與最新版本有所差異。詳細情況請與我們聯繫。
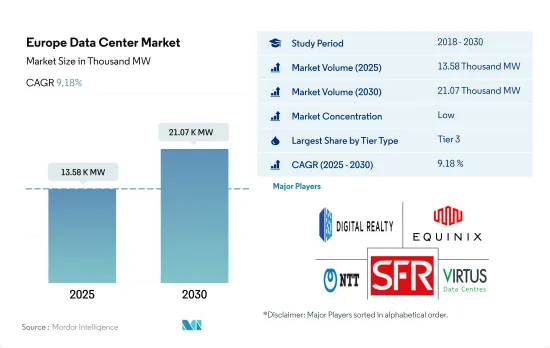
預計 2025 年歐洲資料中心市場規模為 13,580 千瓦,到 2030 年將達到 21,070 千瓦,複合年成長率為 9.18%。
預計主機託管收益將在 2025 年達到 181.083 億美元,到 2030 年將達到 350.337 億美元,預測期內(2025-2030 年)的複合年成長率為 14.11%。
2023 年, 層級 3資料中心將佔據大部分佔有率,並預計在整個預測期內佔據主導地位。
- 層級 3 細分市場因其特性而具有巨大優勢,目前佔據歐洲大部分市場佔有率。這些層級具有高度的冗餘度以及多個電源和冷卻路徑。這些資料中心的運轉率約為 99.982%,每年的停機時間為 1.6 小時。邊緣和雲端連接的日益普及預計將推動這一領域的成長。
- 英國擁有全國最多的層級 3資料中心,其中斯勞和大倫敦佔據了最大佔有率。其他主要地點包括法國、德國和愛爾蘭。都柏林是愛爾蘭唯一一個擁有超過 98% 的層級 3資料中心設施的地區,其中北都柏林和南都柏林佔據了最大佔有率。預計層級 3 部分將從 2023 年的 7,979.69 兆瓦成長到 2029 年的 12,110.18 兆瓦,複合年成長率為 7.20%。
- 預計在預測期內, 層級 4 部分的最高複合年成長率將達到 15.51%。各個已開發國家都致力於採用層級 4 認證,以獲得所有組件完全容錯和冗餘的好處。這就是為什麼開發中地區也採用層級 4 區域的原因。例如,傳統 FLAP 市場之外的層級城市市場預計將從最初的低起始點實現最快的容量成長。特別是巴塞隆納、米蘭和羅馬等大都市市場,預計未來四年資料中心容量將增加三倍。
- 目前,第 1層級和第 2 層類型的成長率最低,因為超過 70% 的流量在伺服器之間移動。現代應用程式需要更多資料在資料中心內以更快的速度傳輸,並且對延遲變得更加敏感。
FLAP-D 大都會市場(包括法蘭克福、倫敦/斯隆、阿姆斯特丹、巴黎和都柏林)的數位化應用正在推動市場需求
- 最大的資料中心市場由 FLAP-D 大都會市場(包括法蘭克福、倫敦/斯洛伐克、阿姆斯特丹、巴黎和都柏林)覆蓋。隨著數位服務和電力管理的日益普及,這些國家的主機託管設施正在不斷擴張。 2022年8月,大倫敦政府宣布計畫改變資料中心開發的申請流程,以便透過更好的能源管理法規解決和緩解西倫敦的電力危機。
- 倫敦的土地價格約為每平方英尺150美元。由於倫敦地價高昂,預計該行業將把投資轉移到其他地價較低的城市。例如,阿姆斯特丹在 FLAP-D資料中心市場中建造設施的土地成本最低,為每平方英尺 38 美元。西班牙市場有許多第三方資料中心計劃正在建設中,其中馬德里和巴塞隆納正在開發設施。
- 在可再生能源方面,在 FLAP-D 市場,可再生能源主要來自太陽能、風能、水能、海洋/波浪能和生質能源。例如,2022年4月,法國政府公佈了基於2030年國家投資計畫的可再生能源創新計劃策略,投資額超過10億美元。
- FLAP-D資料中心樞紐缺乏土地和熟練勞動力,並受到新興地區的威脅。預計義大利、波蘭、比利時和瑞典等國家未來幾年將實現成長。就海底電纜連接而言,瑞典資料中心市場是北歐地區連接最緊密的市場之一。該國正在採用資料中心區域供熱的概念。
歐洲資料中心市場趨勢
OTT 訂閱量、手機遊戲和社群媒體的普及推動資料中心市場
- 到 2025 年,智慧型手機預計將佔據歐洲近 85% 的連線佔有率。西歐擁有世界上最大的行動資料消費地區之一,而中歐和東歐則落後於全球平均。 2021年,西歐行動裝置的每月流量將達到Terabyte。由於智慧型手機和行動遊戲 OTT 訂閱量的增加,平均資料量不斷上升,進一步推動了對遊戲和視訊內容直播的資料處理和儲存設施的需求。在丹麥市場,2021 年消費者在影片上的總支出與 2020 年相比成長了 11.8%。 2021 年丹麥視訊市場規模將達到 45.91 億丹麥克朗(6.078 億歐元)以上。
- OTT 服務的持續趨勢正在推動歐洲國家每部智慧型手機的資料通訊增加。例如,在丹麥,OTT訂閱數量在2016年達到210萬,預計到2021年將達到570萬。瑞士的社群媒體用戶數為754萬,2021年至2022年間增加了44萬,成長率為6.2%。資料消費量的增加、使用智慧型手機的時間的增加以及所有終端用戶數位化的提高,導致每部智慧型手機的資料通訊增加。
- 2021 年新冠疫情爆發後,資料消費量顯著增加,由於該地區的遠距工作文化,更多用戶轉向智慧型手機。根據報告,透過網際網路交換業者 DE-CIX 交換的資料資料從 2020 年的 32 Exabyte增加到 2021 年的 38 Exabyte以上。這些統計數據表明,該地區每部智慧型手機的資料流量正在大幅成長。
歐洲用戶在 App Store 和 Google Play 上的支出增加,無現金交易推動了對資料中心的需求
- 2021年,行動科技和服務將創造歐洲GDP的約4.6%,經濟價值達到7,450億歐元以上。歐洲智慧型手機的平均壽命為3年,年銷售量約2.11億支。
- 在歐洲,2021 年有 4.74 億人訂閱了行動服務。到 2025 年,這一數字預計將成長到 4.8 億。超過三分之二的區域營運商已經建造5G網路,大多數歐洲國家已經推出5G商用服務。預計2025年歐洲將擁有3.11億個5G連接,普及率達44%。 2021年,歐洲用戶在App Store和Google Play的支出達到183億美元。透過細分客戶在應用程式內收費、訂閱和付費應用程式方面的支出,該預測表明年度總收入將比 2020 年成長 22.8%。 2021 年,歐洲支出約佔全球行動應用收入的 14%,達到 1,316 億美元。
- 瑞士的網路普及率從 2016 年的 89% 上升到 2021 年的 96%,而智慧型手機用戶數量從 2016 年的 690 萬增加到 2021 年的 790 萬。如此廣泛的應用刺激了數位付款服務的發展,在新冠疫情期間,數位支付服務的使用量增加。瑞士越來越多的人使用無現金付款。只有35%的瑞士公民仍然喜歡用現金付款,這表明越來越多的人選擇無現金付款。這些因素支撐了歐洲市場智慧型手機的使用日益成長,從而導致資料和儲存容量需求不斷增加。
歐洲資料中心產業概況
歐洲資料中心市場較為分散,前五大公司佔了28.90%的市場。該市場的主要企業包括 Digital Realty Trust Inc.、Equinix Inc.、NTT Ltd、SOCIETE FRANCAISE DU RADIOTELEPHONE-SFR 和 Virtus Data Centres Properties Ltd (STT GDC)。
其他福利
- Excel 格式的市場預測 (ME) 表
- 3個月的分析師支持
目錄
第1章執行摘要和主要發現
第2章 報告要約
第3章 引言
- 研究假設和市場定義
- 研究範圍
- 調查方法
第4章 市場展望
- 負載能力
- 占地面積
- 主機代管收入
- 安裝的機架數量
- 機架空間利用率
- 海底電纜
第5章 產業主要趨勢
- 智慧型手機用戶數量
- 每部智慧型手機的資料流量
- 行動資料速度
- 寬頻資料速度
- 光纖連接網路
- 法律規範
- 奧地利
- 比利時
- 丹麥
- 法國
- 德國
- 愛爾蘭
- 義大利
- 荷蘭
- 挪威
- 波蘭
- 俄羅斯
- 西班牙
- 瑞典
- 瑞士
- 英國
- 價值鍊和通路分析
第6章市場區隔
- 資料中心規模
- 大規模
- 超大規模
- 中等規模
- 超大規模
- 小規模
- 層級類型
- 1層級和2級
- 層級
- 層級
- 吸收量
- 未使用
- 使用
- 按主機託管類型
- 超大規模
- 零售
- 批發的
- 按最終用戶
- BFSI
- 雲
- 電子商務
- 政府
- 製造業
- 媒體與娛樂
- 電信
- 其他
- 國家
- 法國
- 德國
- 愛爾蘭
- 荷蘭
- 挪威
- 西班牙
- 瑞士
- 英國
- 其他歐洲國家
第7章競爭格局
- 市場佔有率分析
- 商業狀況
- 公司簡介.
- CyrusOne Inc.
- Data4
- Digital Realty Trust Inc.
- Equinix Inc.
- Global Switch Holdings Limited
- Leaseweb Global BV
- NTT Ltd
- SOCIETE FRANCAISE DU RADIOTELEPHONE-SFR
- Stack Infrastructure Inc.
- Telehouse(KDDI Corporation)
- Vantage Data Centers LLC
- Virtus Data Centres Properties Ltd(STT GDC)
第8章:CEO面臨的關鍵策略問題
第9章 附錄
- 世界概況
- 概述
- 五力分析框架
- 全球價值鏈分析
- 全球市場規模和DRO
- 資訊來源及延伸閱讀
- 圖表清單
- 關鍵見解
- 資料包
- 詞彙表
The Europe Data Center Market size is estimated at 13.58 thousand MW in 2025, and is expected to reach 21.07 thousand MW by 2030, growing at a CAGR of 9.18%. Further, the market is expected to generate colocation revenue of USD 18,108.3 Million in 2025 and is projected to reach USD 35,033.7 Million by 2030, growing at a CAGR of 14.11% during the forecast period (2025-2030).
Tier 3 data center accounted for majority share in terms of volume in 2023, and is expected to dominate through out the forecasted period
- The tier 3 segment currently has a majority of share in the European region due to the major advantage of its features. These tiers have a high redundancy level and multiple paths for power and cooling. These data centers have an uptime of around 99.982%, translating into a downtime of 1.6 hours per year. The increasing adoption of edge and cloud connectivity is expected to boost the segment's growth.
- The United Kingdom hosts the maximum number of tier 3 data centers in the country, with Slough and Greater London holding a major share. The other major locations are France, Germany, Ireland, and other countries. Dublin is the only region that hosts more than 98% of the tier 3 data center facilities in Ireland, with North and South Dublin holding a major share. The tier 3 segment is expected to grow from 7,979.69 MW in 2023 to 12,110.18 MW in 2029, with a CAGR of 7.20%.
- The tier 4 segment is expected to record the highest CAGR of 15.51% during the forecast period. Various developed countries are focusing on adopting Tier 4 certifications to get the advantage of complete fault tolerance and redundancy for every component. Thus, even the developing regions are adopting the tier 4 zone. For instance, the tier 2 metro markets, outside the traditional FLAP markets, are set to see the fastest capacity growth from a low initial starting point. In particular, the Barcelona, Milan, and Rome metro markets are expected to triple the amount of data center power over the next four years.
- Tier 1 & 2 types showcase the least majority growth as more than 70% of all traffic today moves from server to server. Modern applications require significantly more data to travel within a data center at faster speeds and are more particular about latency.
Adoption of digitization in FLAP-D metro markets (including Frankfurt, London/Slough, Amsterdam, Paris, and Dublin) increases the market demand
- The largest data center markets are covered by FLAP-D metro markets (including Frankfurt, London/Slough, Amsterdam, Paris, and Dublin). With the increasing adoption of digital services and power management, these countries are expanding their colocation facilities. In August 2022, the Greater London Authority announced plans to change the application process for data center development to tackle and ease the West London power crisis with better electricity management regulations.
- The land price in London is around USD 150 per sq. ft. The higher land cost in London is expected to shift investments to other cities in the industry with lower land prices. For instance, Amsterdam has a lower land price for building facilities in the FLAP-D data center market, which is USD 38 per sq. ft. The Spanish market has many third-party DC projects under construction, with facilities being developed in Madrid and Barcelona.
- In terms of renewable energy, in the FLAP-D market, renewable energy is majorly produced from solar, wind, hydroelectricity, marine and wave energy, and bioenergy. For instance, in April 2022, the French government announced a strategy for renewable energy innovation projects as per its 2030 national investment plan, with an investment of over USD 1 billion.
- As the FLAP-D data center hubs observe a lack of land availability and skilled workforce, they are under threat from emerging regions. Countries like Italy, Poland, Belgium, and Sweden are expected to showcase growth in the future. Sweden's data center market is one of the most connected locations in the Nordic region regarding subsea cable connectivity. The country has adopted the district heating concept for data centers.
Europe Data Center Market Trends
Increasing usage of OTT subscriptions and mobile gaming along with social media penetration increases the data center market
- By 2025, smartphones are expected to account for nearly 85% of connections in Europe. Western Europe is home to some of the world's biggest consumers of mobile data, while Central and Eastern Europe lag behind the global average. In 2021, in Western European, the traffic from mobile devices reached 4,189,615 terabytes per month. The growing average data volume due to rising OTT subscriptions for smartphones and mobile gaming is further driving the demand for data processing and storage facilities for live-streaming games and video content. The Danish market saw an 11.8% growth in total consumer spending on video in 2021 compared to 2020. The Danish video market represented a value of more than DKK 4,591 million (EUR 607.8 million) in 2021.
- The ongoing trend of OTT services is increasing data traffic per smartphone in European countries. For instance, in Denmark, OTT subscriptions reached 2.1 million in 2016 to 5.7 million in 2021. The number of social media users in Switzerland was 7.54 million, increasing by 440,000 between 2021 and 2022, indicating a 6.2% growth. Factors such as increased data consumption, time spent on smartphones, and growth of digitalization across all end users are leading to the rise in data traffic per smartphone.
- A major increase in data consumption was observed in 2021 after the COVID-19 pandemic, with more users switching to smartphones due to the remote working culture in the region. The data exchanged through the internet exchange operator, DE-CIX, reported an increase in data throughput from 32 exabytes in 2020 to more than 38 exabytes in 2021. Such statistics suggest the significant growth of data traffic per smartphone in the region.
Increasing spending by European users on the App Store and Google Play along with cashless transactions increases the Data Center demand
- In 2021, mobile technologies and services generated around 4.6% of the GDP in Europe, a contribution that amounted to more than EUR 745 billion of the economic value. The average lifespan of a smartphone in Europe is three years, with annual sales of almost 211 million units.
- In Europe, 474 million individuals were subscribers to mobile services in 2021. By 2025, this number is projected to increase to 480 million. Over two-thirds of regional operators have built 5G networks, and most European nations have implemented commercial 5G services. There may be 311 million 5G connections in Europe by 2025, representing a 44% adoption rate. The year 2021 witnessed USD 18.3 billion in spending by European users on the App Store and Google Play. Based on customer spending for in-app purchases, subscriptions, and premium apps, this prediction represented a 22.8% rise in yearly gross income from 2020. European spending accounted for approximately 14% of global mobile app revenue in 2021, which reached USD 131.6 billion.
- The internet penetration in Switzerland increased from 89% in 2016 to 96% in 2021, while at the same time, the number of smartphone users increased from 6.9 million in 2016 to 7.9 million in 2021. Owing to such extensive use, digital payment services were promoted, and their application increased due to the COVID-19 pandemic. More people in Switzerland are using cashless transactions. Only 35% of Swiss citizens still prefer cash as a form of payment, indicating that people are increasingly choosing cashless transactions, while the rest favor using a card or an app to pay. Such factors indicate the rising use of smartphones in the European market, resulting in a constant increase in data and necessitating a growing amount of storage space.
Europe Data Center Industry Overview
The Europe Data Center Market is fragmented, with the top five companies occupying 28.90%. The major players in this market are Digital Realty Trust Inc., Equinix Inc., NTT Ltd, SOCIETE FRANCAISE DU RADIOTELEPHONE - SFR and Virtus Data Centres Properties Ltd (STT GDC) (sorted alphabetically).
Additional Benefits:
- The market estimate (ME) sheet in Excel format
- 3 months of analyst support
TABLE OF CONTENTS
1 EXECUTIVE SUMMARY & KEY FINDINGS
2 REPORT OFFERS
3 INTRODUCTION
- 3.1 Study Assumptions & Market Definition
- 3.2 Scope of the Study
- 3.3 Research Methodology
4 MARKET OUTLOOK
- 4.1 It Load Capacity
- 4.2 Raised Floor Space
- 4.3 Colocation Revenue
- 4.4 Installed Racks
- 4.5 Rack Space Utilization
- 4.6 Submarine Cable
5 Key Industry Trends
- 5.1 Smartphone Users
- 5.2 Data Traffic Per Smartphone
- 5.3 Mobile Data Speed
- 5.4 Broadband Data Speed
- 5.5 Fiber Connectivity Network
- 5.6 Regulatory Framework
- 5.6.1 Austria
- 5.6.2 Belgium
- 5.6.3 Denmark
- 5.6.4 France
- 5.6.5 Germany
- 5.6.6 Ireland
- 5.6.7 Italy
- 5.6.8 Netherlands
- 5.6.9 Norway
- 5.6.10 Poland
- 5.6.11 Russia
- 5.6.12 Spain
- 5.6.13 Sweden
- 5.6.14 Switzerland
- 5.6.15 United Kingdom
- 5.7 Value Chain & Distribution Channel Analysis
6 MARKET SEGMENTATION (INCLUDES MARKET SIZE IN VOLUME, FORECASTS UP TO 2030 AND ANALYSIS OF GROWTH PROSPECTS)
- 6.1 Data Center Size
- 6.1.1 Large
- 6.1.2 Massive
- 6.1.3 Medium
- 6.1.4 Mega
- 6.1.5 Small
- 6.2 Tier Type
- 6.2.1 Tier 1 and 2
- 6.2.2 Tier 3
- 6.2.3 Tier 4
- 6.3 Absorption
- 6.3.1 Non-Utilized
- 6.3.2 Utilized
- 6.3.2.1 By Colocation Type
- 6.3.2.1.1 Hyperscale
- 6.3.2.1.2 Retail
- 6.3.2.1.3 Wholesale
- 6.3.2.2 By End User
- 6.3.2.2.1 BFSI
- 6.3.2.2.2 Cloud
- 6.3.2.2.3 E-Commerce
- 6.3.2.2.4 Government
- 6.3.2.2.5 Manufacturing
- 6.3.2.2.6 Media & Entertainment
- 6.3.2.2.7 Telecom
- 6.3.2.2.8 Other End User
- 6.4 Country
- 6.4.1 France
- 6.4.2 Germany
- 6.4.3 Ireland
- 6.4.4 Netherlands
- 6.4.5 Norway
- 6.4.6 Spain
- 6.4.7 Switzerland
- 6.4.8 United Kingdom
- 6.4.9 Rest of Europe
7 COMPETITIVE LANDSCAPE
- 7.1 Market Share Analysis
- 7.2 Company Landscape
- 7.3 Company Profiles (includes Global Level Overview, Market Level Overview, Core Business Segments, Financials, Headcount, Key Information, Market Rank, Market Share, Products and Services, and Analysis of Recent Developments).
- 7.3.1 CyrusOne Inc.
- 7.3.2 Data4
- 7.3.3 Digital Realty Trust Inc.
- 7.3.4 Equinix Inc.
- 7.3.5 Global Switch Holdings Limited
- 7.3.6 Leaseweb Global BV
- 7.3.7 NTT Ltd
- 7.3.8 SOCIETE FRANCAISE DU RADIOTELEPHONE - SFR
- 7.3.9 Stack Infrastructure Inc.
- 7.3.10 Telehouse (KDDI Corporation)
- 7.3.11 Vantage Data Centers LLC
- 7.3.12 Virtus Data Centres Properties Ltd (STT GDC)
- 7.4 LIST OF COMPANIES STUDIED
8 KEY STRATEGIC QUESTIONS FOR DATA CENTER CEOS
9 APPENDIX
- 9.1 Global Overview
- 9.1.1 Overview
- 9.1.2 Porter's Five Forces Framework
- 9.1.3 Global Value Chain Analysis
- 9.1.4 Global Market Size and DROs
- 9.2 Sources & References
- 9.3 List of Tables & Figures
- 9.4 Primary Insights
- 9.5 Data Pack
- 9.6 Glossary of Terms
 資料中心市場規模、佔有率及成長分析(按組件、資料中心類型、公司規模、層級、資料中心規模、垂直產業和地區)-2025 年至 2032 年產業預測
 資料中心 -市場佔有率分析、產業趨勢與統計、成長預測(2025-2030)
 美國現有和即將建成的資料中心組合
 量子資料中心市場(按解決方案、量子組件、冷卻技術、公司規模和最終用戶分類)- 2025-2030 年全球預測
 在軌資料中心市場 - 全球與區域分析:未來發展、生態系統、挑戰
 2025年資料中心IT資產處置全球市場報告2025年資料中心維修全球市場報告2030 年資料中心網路市場預測:按資料中心類型、網路類型、部署模式、技術、最終用戶和地區進行的全球分析2025 年至 2033 年資料中心市場報告(按組件、類型、企業規模、最終用戶和地區)2025 年託管資料中心服務全球市場報告