


 |
市場調查報告書
商品編碼
1687205
作物保護 -市場佔有率分析、產業趨勢與統計、成長預測(2025-2030 年)Agrochemicals - Market Share Analysis, Industry Trends & Statistics, Growth Forecasts (2025 - 2030) |
||||||
※ 本網頁內容可能與最新版本有所差異。詳細情況請與我們聯繫。
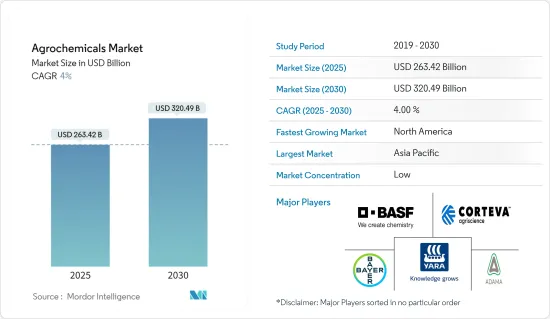
預計 2025 年農業化學品市場規模為 2,634.2 億美元,到 2030 年將達到 3,204.9 億美元,預測期內(2025-2030 年)的複合年成長率為 4%。
世界各地人口不斷成長,富裕程度不斷提高,消費模式也正在改變。我們不僅需要增加產量來滿足需求,還需要確保滿足日益富裕的人口的營養需求。此外,對更健康飲食的需求正在推動全球穀物、水果和蔬菜消費量的增加。因此,農民、聯邦政府和工業界齊心協力提高作物產量,以滿足世界糧食供應的需求。在這樣做的同時,我們會格外小心,避免對人類安全或生態平衡造成任何不利影響。
例如,根據國際貨幣基金組織的數據,2021年印度總人口估計約為13.9億人。根據聯合國糧農組織預測,2021年全球將有11.7%的人口面臨嚴重的糧食不安全狀況。耕地面積減少、病蟲害造成的作物損失造成浪費,對保障糧食及營養安全構成嚴峻挑戰。根據美國農業部統計,自2000年以來,美國農地總面積逐年減少。預計到2021年,美國農地總面積將減少近5,000萬英畝,至8.953億英畝。這些因素都在增加對農藥的需求,並促進農業生產。
農藥的使用主要是由於大豆、玉米和棉花等基因改造作物的廣泛應用。農藥使用量的增加促使世界需要取得和生產更多的惰性成分。
此外,昆蟲害蟲、植物寄生線蟲和真菌疾病不斷進化並侵襲植物,導致產量下降。此外,最近的趨勢是出現了對現有農藥產生抗藥性的害蟲和昆蟲,這導致了含有新活性成分的農藥的開發,從而增加了疾病的發生。例如,根腫病是十字花科植物(如油菜)的一種嚴重的土壤傳播疾病。對於油菜籽來說,根部會形成腫脹和碎石,最終導致植物過早死亡。今年,亞伯達發現了約 300 個新的根腫病田地,加拿大最大的油菜種植省曼尼托巴省和薩斯喀徹爾也開始出現病例。加拿大約有 3,000 塊田地感染了根腫病,可能會對該國的菜籽產業造成毀滅性的影響。然而,此病害對作物造成的損害十分廣泛,對重要的經濟作物造成了巨大的損失。這使得開發新的殺菌劑成為必要,並迫使農民增加殺菌劑和殺蟲劑等農藥的使用。
然而,監管限制和環境問題是限制農業化學成分使用的主要因素。政府對某些成分使用的規定或限制可能會限制作物保護中成分的可用性和使用。例如,2021年12月,墨西哥政府通過法令,逐步淘汰國內使用Glyphosate類農藥產品。隨著消費者對農藥對人類和環境健康影響的認知不斷提高,預計未來幾年將有更多的農藥被淘汰。
農業化學品市場趨勢
肥料是成長最快的產品類型
全球糧食消費率的成長速度幾乎是國內生產力的10倍。儘管大宗商品價格下跌導致經濟成長放緩,但大多數國家的食品需求仍在成長。預計到 2050 年,全球糧食需求將增加一倍以上,這主要受到人口成長、收入增加、都市化加快以及區域飲食結構向高價值生鮮食品和加工食品消費轉變的影響。這將為農民創造新的機會,並促進農業肥料的成長。
根據糧農組織預測,到 2050 年,世界人口將達到 90 億。人口成長帶來了巨大的糧食需求,而農業用地減少則帶來了重大挑戰。例如,2021年,英國約有1723萬公頃土地被歸類為農業用地,低於2020年的1727萬公頃。隨著農業用地面積的減少,預計可用土地上將需要生產更多的農產品。
然而,隨著人口成長對糧食安全的需求不斷成長,以及中產階級不斷壯大對食物多樣性的需求不斷成長,農作物產量必然增加,這又推動了農民對肥料的需求。
此外,肥料對於提高田地生產力和獲得產量至關重要。肥料對於作物的生長至關重要,可以提高作物的性能並產生顯著的效果。充足的植物營養供應對於植物的健康生長和生產至關重要。營養需求因作物和土壤而異。這些營養需求可以透過使用化學肥料來有效滿足。例如,尿素為土壤提供46%的氮,而印楝餅等有機肥料僅提供2-5%的氮,而氮是植物生長發育所必需的元素。因此,有效利用投入對於提高有限土地的生產力至關重要,而肥料是作物生產的關鍵投入,從而推動肥料市場的發展。
據糧農組織稱,2019-2020年農業對氮磷鉀肥料的使用量增加了3.02%。 2019年使用最多的肥料是氮肥,用量為41.7萬噸。氮肥是非洲消耗量最大的肥料。根據國際肥料協會的數據,2019年NPK總消費量為660.5萬噸。然而,使用量仍遠低於全球平均水平,儘管近期使用量和產量都有所增加,但仍遠低於區域政府和政府間組織設定的目標。例如,根據非洲肥料組織的報告,2020年,地圖上共有14家肥料生產廠。截至2020年,非洲共有151家肥料廠,除了87家加工廠、15家有機工廠和製造工廠外,還有35家新建工廠。馬拉威只有兩家化肥加工廠,尚比亞有四家,而莫三比克有五家,其中一家是在2020年這個歷史性時期建立的。因此,隨著作物產量的增加,化肥市場也在成長,而且隨著有機肥料越來越受到永續發展的青睞,預計化肥市場將進一步成長。
此外,加拿大供應了全球超過 11% 的化肥。近年來,加拿大政府也採取了多項措施,推動該國永續化肥生產。目前,加拿大的目標是改善其化肥生產和消費狀況,同時保持與環境的和諧。例如,2022年7月,加拿大農業和農業食品部長宣布向位於亞伯達卡加利的Sulvaris公司投資1,685,858加元,進一步開發Sulvaris的碳控制技術,該技術利用有機碳生產高效肥料。
亞太地區是最大的市場領域
中國佔全球農藥市場的最大佔有率。由於耕地面積減少,中國有機氮、磷、鉀肥的消費量正在下降。例如,根據中國綠色食品發展中心的數據,2021年中國約有984萬公頃農地獲得有機認證,低於2019年的1,390萬公頃。水果和蔬菜的種植面積正在增加,而穀物的種植面積正在減少。
此外,澳洲統計局報告稱,農民每年花費 1.8 億美元用於農場病蟲害防治,以提高產量並促進該國農業部門的成長。此外,根據《安全有效農藥應用》(SEPA)的數據,澳洲正式註冊的農藥超過8,000種,其中約75%用於農業。澳洲政府投入巨資進行研發,以提高農業生產效率和病蟲害管理。例如,2020年,澳洲政府向澳洲植物健康組織提供了60萬美元,以解決在全國研討會上發現的國內研發的關鍵差距。
同樣,印度米和小麥等穀物作物的大量產量是支持市場成長的主要因素。印度的殺蟲劑使用量一直在穩定增加。截至 2022 年 6 月,幾家主要農業化學品和作物保護公司的收益清楚地表明了該國和該地區農業化學品市場的成長。
印度政府一直採取有利措施來增加印度農藥的供應和利用率。根據糧農組織預測,到2022年,印度將佔全球農藥消費量的15.3%(氮)、19%(磷)和14.4%(鉀)。印度雖然是世界第二大氮肥生產國、第三大磷肥生產國,但其化肥供需缺口持續擴大。這導致對進口肥料的依賴增加。
此外,UPL 是印度領先的農業化學品和作物保護公司,截至 2022 年 6 月,其營業額超過 1,640 億印度盧比(19.8 億美元)。位居第二的是BASF印度公司,銷售額約 1,300 億印度盧比(15.7 億美元)。資料顯示,光是八個邦的農藥消費量就佔印度農藥消費量的 70.0% 以上。隨著對環境和永續性的日益重視,該地區各國政府正在實施清潔生產和生態友善農業措施,這可能會減少該國合成農藥的使用。然而,各國政府正在鼓勵使用微生物農藥,預計未來幾年其使用量將迅速成長。
農化業概況
全球作物保護化學品市場細分,主要參與企業包括拜耳作物科學股份公司、安道麥農業解決方案公司、雅苒國際公司、BASF公司、科迪華農業科學公司、紐發姆公司等。新產品發布、併購和合作是這些主要企業採用的主要策略。市場參與企業正專注於投資創新、合作和擴張以增加市場佔有率。
其他福利
- Excel 格式的市場預測 (ME) 表
- 3個月的分析師支持
目錄
第1章 引言
- 研究假設和市場定義
- 研究範圍
第2章調查方法
第3章執行摘要
第4章 市場動態
- 市場概覽
- 市場促進因素
- 人口成長導致糧食需求增加
- 採用永續的農業方法
- 需要提高土地生產力
- 市場限制
- 環境和監管限制
- 成本上升及產品開發困難
- 產業吸引力-波特五力分析
- 供應商的議價能力
- 買家的議價能力
- 新進入者的威脅
- 替代品的威脅
- 競爭對手之間的競爭強度
第5章市場區隔
- 產品類型
- 肥料
- 農藥
- 佐劑
- 植物生長調節劑
- 應用
- 以作物為基礎
- 糧食
- 豆類和油籽
- 水果和蔬菜
- 非作物
- 草坪和觀賞草
- 其他非農作物
- 以作物為基礎
- 地區
- 北美洲
- 美國
- 加拿大
- 墨西哥
- 北美其他地區
- 歐洲
- 西班牙
- 英國
- 法國
- 德國
- 俄羅斯
- 義大利
- 其他歐洲國家
- 亞太地區
- 中國
- 印度
- 日本
- 澳洲
- 其他亞太地區
- 南美洲
- 巴西
- 阿根廷
- 南美洲其他地區
- 非洲
- 南非
- 其他非洲國家
- 北美洲
第6章競爭格局
- 最受歡迎的策略
- 市場佔有率分析
- 公司簡介
- Bayer Crop Science AG
- BASF SE
- Corteva Agriscience AG
- Archer-Daniels-Midland(ADM)
- FMC Corporation
- Adama Agricultural Solutions
- Potash Corporation of Saskatchewan
- Nufarm Ltd
- Nutrien Ltd
- Yara International ASA
第7章 市場機會與未來趨勢
The Agrochemicals Market size is estimated at USD 263.42 billion in 2025, and is expected to reach USD 320.49 billion by 2030, at a CAGR of 4% during the forecast period (2025-2030).
The rising population across the world, accompanied by rising affluence, is shifting consumption patterns. There is a need not just to increase production to meet demand but also to ensure that the nutritional needs of an increasingly affluent population are met. Moreover, the demand for healthy diets has increased the consumption of cereals, fruits, and vegetables across the world. This has resulted in integration among growers, federal governments, and industries to improve crop yield to meet global food supply requirements. While all this is done, proper care is applied so as not to cause any adverse effects on human safety and ecological balance.
For instance, according to the IMF, in 2021, the estimated total population in India amounted to approximately 1.39 billion people. According to the FAO, in 2021, 11.7% of the global population experienced severe food insecurity. Shrinking arable land and loss of crops due to pest attacks lead to wastage, posing a critical challenge to ensuring food and nutritional security. According to the US Department of Agriculture, from 2000 onwards, the total land area in the US farms has decreased annually. The total farmland area has decreased by almost 50 million acres, reaching 895.3 million acres as of 2021. Such factors are raising the demand for agrochemicals, which boosts agricultural output.
Agrochemical usage is mainly driven by the growing application of genetically modified crops, such as soybean, maize, and cotton. The increasing application of agrochemicals has increased the need for the availability and production of more inert ingredients in the world.
Moreover, insect pests, plant parasitic nematodes, and fungal diseases continuously evolve and attack plants, leading to decreased yields. Furthermore, the incidence of resistant pests and insects against the existing crop protection chemicals in recent years is leading to the development of new active ingredient agrochemicals, increasing disease incidences. For instance, clubroot is a serious soil-borne disease of cruciferous plants, such as canola. In canola, swellings or galls form on the roots, which can ultimately cause premature death of the plant. About 300 new fields a year in Alberta have been found to have clubroot, and cases have started to spring up in Manitoba and Saskatchewan, Canada's largest canola growers. There are about 3,000 fields infected with clubroot in Canada, which could devastate the Canadian canola industry. However, there is rampant crop damage due to disease incidence, causing enormous losses to economically important crops. This created the need to develop new fungicides and compelled farmers to adopt an intensified application of agrochemicals such as fungicides and insecticides.
However, regulatory restrictions and environmental concerns are the major factors that can restrain the use of raw materials in agrochemicals. Government regulations and restrictions on using certain raw materials can limit their availability and use in crop protection. For instance, in December 2021, the Government of Mexico passed a decree to eliminate the use of glyphosate-based pesticide products in the country. More pesticides are projected to be eliminated in the coming years amid rising consumer awareness about the impact of pesticides on human and environmental health.
Agrochemicals Market Trends
Fertilizer is the Largest Growing Product Type
The global food consumption rate rises almost ten times faster than local production. The demand for food is growing in most countries despite the slowdown induced by the decline in commodity prices. The global demand for food is projected to more than double by 2050, driven by population growth, rising incomes, rapid urbanization, and changes in regional diets toward greater consumption of higher-value fresh and processed foods. That, in turn, creates new opportunities for farmers and propels the growth of fertilizers in agriculture.
According to FAO, the world population is projected to reach 9 billion by 2050. The increasing population creates a huge demand for food products to feed the population, which is turning into a major challenge with the decreasing farmland. For instance, in 2021, approximately 17.23 million hectares of land in the United Kingdom was classified as the utilized agricultural area, which decreased from 17.27 million hectares in 2020. The shrinking area under agriculture is anticipated to demand more produce from the available land.
However, the increasing need for food security within an expanding population and greater demand from a rising middle class for food variety necessitate the need to boost crop yields, thus driving the demand for fertilizers among farmers.
Additionally, fertilizers are essential in obtaining high yields as these are necessary to increase productivity in the field. Fertilizers are vital to crop growth, showing improved performance and noticeable results. Supplying adequate plant nutrients is essential for healthy growth as well as the production capacity of plants. The nutrient demand varies with crops and soil. These nutrient demands can be effectively fulfilled through the use of chemicals. For instance, urea provides 46% nitrogen to the soil, whereas organic fertilizers like neem cake could provide only 2-5% nitrogen, an essential element for plant growth and development. Thus, to increase productivity from the limited land, the efficient use of inputs is mandatory, driving the fertilizers market as fertilizers are an important input in crop production.
According to the FAO, the NPK fertilizer agricultural use increased by 3.02% in 2019-2020. Nitrogen was the most used fertilizer in 2019, accounting for 417 thousand metric tons. Nitrogen fertilizers are the most consumed fertilizer in Africa. According to the International Fertilizers Association, the total NPK consumption in 2019 accounted for 6,605 thousand metric tons. However, usage remains well below the global average and significantly beneath the targets set by regional governments and intergovernmental organizations despite recent growth in both sales and production. For instance, according to the Africa Fertilizers Organization report, 14 fertilizer manufacturing plants were mapped in 2020. There were 151 fertilizer plants in Africa in 2020, including 87 processing plants, 15 organic plants, and 35 new facilities apart from the manufacturing plants. Malawi accounts for only two fertilizer processing plants, and Zambia has four, whereas Mozambique has five processing plants, one of which was established during the historic period in 2020. Thus, with the increased crop production, the fertilizer market has grown and is anticipated to grow further, with a preference for organic fertilizers for sustainable development.
Furthermore, more than 11% of the world's fertilizers are supplied by Canada. In the past few years, the Canadian government has also taken several steps to promote sustainable fertilizer production in the country. Under current circumstances, Canada aims to improve fertilizer production and consumption scenario while maintaining environmental harmony. For instance, in July 2022, Canada's Minister of Agriculture and Agri-Food announced a CAD 1,685,858 investment in Sulvaris in Calgary, Alberta, for the further development of Sulvaris' carbon control technology, which produces high-efficiency fertilizers made with organic carbon.
Asia-Pacific is the Largest Segment in the Market
China accounts for the largest share of the agrochemicals market globally. Due to the decreasing cropland area, Chinese consumption of organic N, P, and K fertilizers is decreasing. For instance, according to the China Green Food Development Center, in 2021, approximately 9.84 million hectares of farmland had been certified as organic farmland in China, which has decreased from 13.9 million hectares in 2019. The cropland area under fruits and vegetables is increasing, while the area under cereals is decreasing.
Furthermore, according to the Australian Bureau of Statistics, farmers reportedly spend USD 180 million each year controlling pest infestation in their farms to produce more and enhance the country's sector growth. Also, according to Safe and Effective Pesticide Applications (SEPA), more than 8000 pesticide products are formally registered for use in Australia, and around 75% of these are used for agricultural purposes. The Australian government heavily invests in research and development to increase crop production efficiency and pest management. For instance, the Australian government provided Plant Health Australia with USD 600,000 in 2020 to address critical gaps in national research and development identified in a national workshop.
Similarly, the large production of cereal crops, like rice and wheat, in India is the major factor supporting the market's growth. The use of pesticides is rising steadily in India. Revenues of a few leading pesticides and agrochemical companies as of June 2022 were a clear indication of the growth of the agrochemical market in the country and the region.
The government of India has been constantly adopting practices that have been advantageous in augmenting the accessibility and utilization of agrochemicals in India. According to FAO, in 2022. India accounts for 15.3% of the World's consumption of (N), 19 % (P), and 14.4% (K), owing to the large production of cereal crops, like rice and wheat in India. In spite of ranking as the second-largest nitrogenous fertilizer producer and third-largest phosphatic fertilizer producer in the world, the demand-supply gap of fertilizers in India is increasing continuously. It is leading to increased dependency on fertilizer imports.
In addition, UPL is the leading pesticides and agrochemical company in India based on net sales worth over INR 164 billion (USD 1.98 billion) as of June 2022. The company was followed by BASF India, which ranked in second place with net sales of roughly INR 130 billion (USD 1.57 billion). Data reveals that only eight states account for more than 70.0% of the total pesticide consumption in India. With a growing emphasis on the environment and sustainability, various governments in the region are enforcing clean production and environment-friendly agriculture policies, which may lead to a decline in synthetic pesticide usage in the country. However, the government has encouraged the use of microbial pesticides, which are projected to grow rapidly in the coming years.
Agrochemicals Industry Overview
The global agrochemicals market is fragmented, with major players including Bayer Crop Science AG, Adama Agricultural Solutions, Yara International ASA, BASF SE, Corteva Agriscience, and Nufarm. New product launches, mergers and acquisitions, and partnerships are the major strategies adopted by these leading companies in the market. Market players are focusing on investments in innovation, collaborations, and expansions to increase their market share.
Additional Benefits:
- The market estimate (ME) sheet in Excel format
- 3 months of analyst support
TABLE OF CONTENTS
1 INTRODUCTION
- 1.1 Study Assumptions and Market Definition
- 1.2 Scope of the Study
2 RESEARCH METHODOLOGY
3 EXECUTIVE SUMMARY
4 MARKET DYNAMICS
- 4.1 Market Overview
- 4.2 Market Drivers
- 4.2.1 Increasing Demand for Food Due to High Population Growth
- 4.2.2 Adoption of Sustainable Farming Practices
- 4.2.3 Need for Increased Land Productivity
- 4.3 Market Restraints
- 4.3.1 Environmental and Regulatory Constraints
- 4.3.2 Increased Cost and Difficulty with Product Development
- 4.4 Industry Attractiveness - Porter's Five Forces Analysis
- 4.4.1 Bargaining Power of Suppliers
- 4.4.2 Bargaining Power of Buyers
- 4.4.3 Threat of New Entrants
- 4.4.4 Threat of Substitute Products
- 4.4.5 Intensity of Competitive Rivalry
5 MARKET SEGMENTATION
- 5.1 Product Type
- 5.1.1 Fertilizers
- 5.1.2 Pesticides
- 5.1.3 Adjuvants
- 5.1.4 Plant Growth Regulators
- 5.2 Application
- 5.2.1 Crop-based
- 5.2.1.1 Grains and Cereals
- 5.2.1.2 Pulses and Oilseeds
- 5.2.1.3 Fruits and Vegetables
- 5.2.2 Non-crop-based
- 5.2.2.1 Turf and Ornamental Grass
- 5.2.2.2 Other Non-crop-based
- 5.2.1 Crop-based
- 5.3 Geography
- 5.3.1 North America
- 5.3.1.1 United States
- 5.3.1.2 Canada
- 5.3.1.3 Mexico
- 5.3.1.4 Rest of North America
- 5.3.2 Europe
- 5.3.2.1 Spain
- 5.3.2.2 United Kingdom
- 5.3.2.3 France
- 5.3.2.4 Germany
- 5.3.2.5 Russia
- 5.3.2.6 Italy
- 5.3.2.7 Rest of Europe
- 5.3.3 Asia-Pacific
- 5.3.3.1 China
- 5.3.3.2 India
- 5.3.3.3 Japan
- 5.3.3.4 Australia
- 5.3.3.5 Rest of Asia Pacific
- 5.3.4 South America
- 5.3.4.1 Brazil
- 5.3.4.2 Argentina
- 5.3.4.3 Rest of South America
- 5.3.5 Africa
- 5.3.5.1 South Africa
- 5.3.5.2 Rest of Africa
- 5.3.1 North America
6 COMPETITIVE LANDSCAPE
- 6.1 Most Adopted Strategies
- 6.2 Market Share Analysis
- 6.3 Company Profiles
- 6.3.1 Bayer Crop Science AG
- 6.3.2 BASF SE
- 6.3.3 Corteva Agriscience AG
- 6.3.4 Archer-Daniels-Midland (ADM)
- 6.3.5 FMC Corporation
- 6.3.6 Adama Agricultural Solutions
- 6.3.7 Potash Corporation of Saskatchewan
- 6.3.8 Nufarm Ltd
- 6.3.9 Nutrien Ltd
- 6.3.10 Yara International ASA
7 MARKET OPPORTUNITIES AND FUTURE TRENDS
 2025年全球鹵代農藥市場報告
 南美作物保護市場 -市場佔有率分析、行業趨勢和統計、成長預測(2025-2030 年)非洲農藥 -市場佔有率分析、產業趨勢與統計、成長預測(2025-2030 年)
 全球農業化學品市場研究報告 - 產業分析、規模、佔有率、成長、趨勢和預測 2025 年至 2033 年2025 年全球作物保護市場報告
 2025-2033 年日本農業化學品市場報告(按肥料類型、農藥類型、作物類型和地區)Fluacrypyrim 市場:按形式和應用分類 - 2025 年至 2030 年全球預測農藥市場:按作物類型、類型和特性分類 - 2025-2030 年全球預測全球農藥市場-2024年至2029年預測全球農業化學品市場研究報告 - 2024 年至 2032 年產業分析、規模、佔有率、成長、趨勢與預測