


 |
市場調查報告書
商品編碼
1687702
美國有機肥料:市場佔有率分析、行業趨勢和成長預測(2025-2030)United States Organic Fertilizer - Market Share Analysis, Industry Trends & Statistics, Growth Forecasts (2025 - 2030) |
||||||
※ 本網頁內容可能與最新版本有所差異。詳細情況請與我們聯繫。
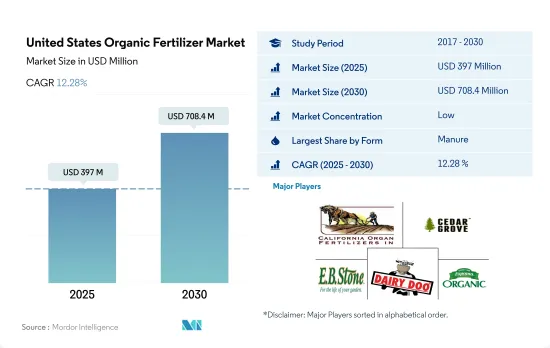
預計 2025 年美國有機肥料市場規模為 3.97 億美元,到 2030 年將達到 7.084 億美元,預測期內(2025-2030 年)的複合年成長率為 12.28%。
- 化肥是美國消費量最大的有機肥料,2022年佔比最大,為46.7%。堆肥由分解的植物或動物物質,或糞便等植物或動物廢棄物製成,一般富含有機質。由動物或植物廢棄物製成的堆肥、農田堆肥和綠肥通常用於農業。
- 堆肥施用是有機農場和非有機農場的常見做法。眾所周知,堆肥可以增加土壤中的有機質和碳含量,並增強作物對養分的吸收,進而提高糧食產量。
- 其他有機肥料包括魚糞、蝙蝠糞、魚乳劑、蚯蚓堆肥和糖蜜,這些肥料在 2021 年佔 11.9%,是第二大消費量有機肥料。其他有機肥雖然營養豐富,但由於價格昂貴,使用量不如糞肥,在一定程度上阻礙了市場的發展。但隨著農民經濟狀況的改善,需求可能會增加。
- 對餐食肥料的需求主要來自經過認證的有機生產商和正在轉變為有機的農場。美國是世界上最大的牛肉生產國,2020 年約佔 20.4%。這顯示該國生產餐廚垃圾肥的空間很大,這使得有機農民更容易取得和使用這種肥料。
- 2022年美國油餅市場價值為210萬美元,同年消費量為6,316.6噸。油餅含有豐富的有機養分,其中氮含量為2.0~8.0%,磷含量為0~2.0%,鉀含量為0~2.0%。
美國有機肥料市場趨勢
由於國家法規,有機種植面積,特別是連作作物的面積正在增加。
- 2021年,美國有機農業面積為62.3萬公頃。過去二十年來,美國的有機農業取得了顯著成長,這主要歸功於具體法律法規的實施。 2021年加州有機農場和牧場數量為3061個,是美國獲得認證的有機農場最多的州。賓州有超過 1,125 個經過認證的有機農場。 2019 年,有近 15,548,000 個經過認證的有機農場運作作物,有 7,139,000 個農場經營牧場和草場。包括苗圃和溫室在內的作物銷售額達到近 58 億美元。
- 該國的有機農業以種植作物為主。 2021年,其占有機農地總面積的約71.8%。糧食生產是該國農業的主導產業。主要穀物有玉米、小麥、稻米、小米等。有機產品的消費在美國消費者中越來越流行,他們擴大選擇有機食品,因為它們具有多種健康益處。
- 有機園藝作物的總種植面積正在增加,從 2017 年的 112,900 公頃增加到 2021 年的 156,100 公頃。就 2021 年國內產量而言,前五的水果和蔬菜是蘋果(31.1%)、草莓(9.5%)、橘子(6.9%)、羅馬生菜(6.7%)和馬鈴薯(6.2%)。在貿易方面,進口量最大的產品是香蕉(53.1%)、酪梨(7.7%)、芒果(5.8%)、藍莓(5.0%)和南瓜(4.3%),出口量最大的產品是蘋果(80.0%)、梨子(14.4%)、櫻桃(4.0%)、洋蔥乾(1.5%)。
對有機農產品的需求不斷增加,尤其是在水果和蔬菜領域,人均有機食品支出也在增加
- 美國是世界最大的有機產品消費國。根據《營養日誌雜誌》(NBJ,2021)通報,2020 年,中國有機食品總銷售額達 516 億美元。美國是北美地區人均有機產品支出最高的國家,2021年為186.7美元。
- 自有機食品零售業誕生以來,有機新鮮水果和蔬菜一直是主導的有機食品類別。 2020年,這些有機產品的零售額達到200億美元,顯示對有機農產品的需求不斷成長。過去二十年來,對有機新鮮水果和蔬菜的需求穩定成長。有機食品銷售的成長是由於消費者意識的增強,尤其是高所得族群。需求量最大的有機食品類別包括雞蛋、乳製品、水果和蔬菜等主食。
- 不同人群和地區的人們對有機食品的偏好各不相同。 18-29 歲的年輕人比 65 歲以上的老年人更有可能想要有機產品(超過 50%)。收入和地區也起著一定的作用,42% 的收入低於 30,000 美元的人想要有機產品,而 49% 的收入超過 75,000 美元的人想要有機產品。
- 美國的人均有機產品支出正在增加,預計 2017 年至 2021 年的複合年成長率為 5.2%。對有機產品的需求不斷成長,為美國有機生產商創造了機會,使其能夠進入國內和國際高價值市場。有機產品的價格溢價是低收入消費者消費有機食品的主要限制因素之一。
美國有機肥產業概況
美國有機肥市場分散,前五大公司佔21.10%的市佔率。市場的主要企業有:California Organic Fertilizers Inc.、Cedar Grove Composting Inc.、EB Stone & Sons Inc.、Morgan Composting Inc. 和 The Espoma Company(按字母順序排列)。
其他福利
- Excel 格式的市場預測 (ME) 表
- 3個月的分析師支持
目錄
第1章執行摘要和主要發現
第2章 報告要約
第3章 引言
- 研究假設和市場定義
- 研究範圍
- 調查方法
第4章 產業主要趨勢
- 有機種植區
- 有機產品人均支出
- 法律規範
- 美國
- 價值鍊和通路分析
第5章市場區隔
- 形式
- 肥料
- 餐食基肥料
- 油餅
- 其他有機肥料
- 作物類型
- 經濟作物
- 園藝作物
- 田間作物
第6章競爭格局
- 重大策略舉措
- 市場佔有率分析
- 商業狀況
- 公司簡介.
- Atlas Organics Inc.
- California Organic Fertilizers Inc.
- Cascade Agronomics LLC
- Cedar Grove Composting Inc.
- EB Stone & Sons Inc.
- Morgan Composting Inc.
- Sustane Natural Fertilizer Inc.
- The Espoma Company
- The Rich Lawn Company LLC
- Walts Organic Fertilizers Co.
第7章:CEO面臨的關鍵策略問題
第 8 章 附錄
- 世界概況
- 概述
- 五力分析框架
- 全球價值鏈分析
- 市場動態(DRO)
- 資訊來源及延伸閱讀
- 圖片列表
- 關鍵見解
- 資料包
- 詞彙表
The United States Organic Fertilizer Market size is estimated at 397 million USD in 2025, and is expected to reach 708.4 million USD by 2030, growing at a CAGR of 12.28% during the forecast period (2025-2030).
- Manures are the most consumed organic fertilizer in the United States, accounting for a maximum share of 46.7% in 2022. Manures can be of plant or animal origin or a decomposed form of plant or animal waste like excreta, which is generally rich in organic matter. Animal or plant waste compost manure, farmyard manure, and green manure are the common types used in agriculture.
- The application of manure fertilizers is generally observed in organic and non-organic farms. It is known to increase organic matter and carbon content in the soil, which would increase the nutrient uptake of the crop and, thus, the grain yield.
- The other organic fertilizers include fish guano, bat guano, fish emulsion, vermicompost, and molasses and are the second most consumed organic fertilizers, accounting for a share of 11.9% in 2021. Despite the rich nutrient properties, other organic fertilizers are less commonly used than manures due to their higher prices, which is slightly hindering the market. However, the demand may increase with the increasing affordability of farmers.
- The demand for meal-based fertilizers majorly comes from certified organic growers and farms under organic conversion. The United States is the largest producer of beef in the world, which accounted for around 20.4% in 2020. This indicates the higher scope for meal-based fertilizer production in the country, leading to easy availability and accessibility for organic farmers.
- The United States oilcake market was valued at USD 2.1 million in 2022, with a volume consumption of 6,316.6 metric tons in the same year. Oilcake is a rich source of organic nutrients containing 2.0-8.0% nitrogen, 0-2.0% phosphorous, and 0-2.0% potassium content.
United States Organic Fertilizer Market Trends
Increase in organic area, particularly in row crops, due to country's laws and regulations
- In 2021, the area under organic agricultural farming in the United States was 623 thousand hectares. Organic agriculture in the United States has increased significantly in the previous 20 years, mostly due to the introduction of particular laws and regulations. The number of organic farms and ranches in California was 3,061 in 2021, the largest number of certified organic farms in the United States. There were over 1,125 certified organic farms in Pennsylvania. Nearly 15,548 thousand certified organic farms in operation used cropland in 2019, while 7,139 thousand farms operated pastureland and rangeland. The sales value of crops, including those from nurseries and greenhouses, amounted to nearly USD 5.8 billion.
- Row crops dominated organic farming in the nation. In 2021, they accounted for about 71.8% of all organic cropland. The production of cereal crops predominates the country's agricultural sector. The main cereals include maize, wheat, rice, and millet. The consumption of organic products has become popular among US consumers who increasingly choose to eat organic foods because of their various health benefits.
- There is an increasing trend in the overall organic horticultural crop cultivation area, from 112.9 thousand hectares in 2017 to 156.1 thousand hectares in 2021. Regarding domestic production in 2021, the top five fruits and vegetables were apples (31.1%), strawberries (9.5%), oranges (6.9%), romaine lettuce (6.7%), and potatoes (6.2%). In the case of trade, the most imported produce was bananas (53.1%), avocados (7.7%), mangoes (5.8%), blueberries (5.0%), and squashes (4.3%), while the most exported were apples (80.0%), pears (14.4%), cherries (4.0%), dried onions (1.5%), and potatoes (0.2%).
Growing demand for organic produce especially in the fruits and vegetables sector, rise in per capita spending on organic food
- The United States is one of the largest organic product consumers in the world. In 2020, the total sales of organic food products in the country accounted for USD 51.6 billion, according to the Nutrition Business Journal (NBJ, 2021). The United States had the largest per capita spending on organic products in the North American region, worth USD 186.7 in 2021.
- Organic fresh fruits and vegetables have been the leading categories of organic food since the establishment of the organic food retail industry. In 2020, retail sales for these organic products were valued at USD 20.0 billion, showing a growing demand for organic produce. The demand for organic fresh fruits and vegetables has steadily risen over the past two decades. Organic food sales are rising due to growing consumer awareness, especially among high-income consumers. The most in-demand organic categories include basic foods like eggs, dairy, fruits, and vegetables.
- Organic food preferences vary by demographic and region. Younger people aged between 18 and 29 are more likely to seek organic products (over 50%) compared to older people aged 65 and above. Income and region also play a role, with 42% of those with under USD 30,000 income and 49% of those with over USD 75.0 thousand seeking organic products.
- The per capita spending on organic products is increasing in the country, recording a projected CAGR of 5.2% between 2017 and 2021. The growing demand for organic products is creating opportunities for US organic producers to tap into high-value markets both domestically and abroad. The price premium associated with organic products is one of the major limiting factors for organic food consumption for low-income consumers.
United States Organic Fertilizer Industry Overview
The United States Organic Fertilizer Market is fragmented, with the top five companies occupying 21.10%. The major players in this market are California Organic Fertilizers Inc., Cedar Grove Composting Inc., EB Stone & Sons Inc., Morgan Composting Inc. and The Espoma Company (sorted alphabetically).
Additional Benefits:
- The market estimate (ME) sheet in Excel format
- 3 months of analyst support
TABLE OF CONTENTS
1 EXECUTIVE SUMMARY & KEY FINDINGS
2 REPORT OFFERS
3 INTRODUCTION
- 3.1 Study Assumptions & Market Definition
- 3.2 Scope of the Study
- 3.3 Research Methodology
4 KEY INDUSTRY TRENDS
- 4.1 Area Under Organic Cultivation
- 4.2 Per Capita Spending On Organic Products
- 4.3 Regulatory Framework
- 4.3.1 United States
- 4.4 Value Chain & Distribution Channel Analysis
5 MARKET SEGMENTATION (includes market size in Value in USD and Volume, Forecasts up to 2030 and analysis of growth prospects)
- 5.1 Form
- 5.1.1 Manure
- 5.1.2 Meal Based Fertilizers
- 5.1.3 Oilcakes
- 5.1.4 Other Organic Fertilizer
- 5.2 Crop Type
- 5.2.1 Cash Crops
- 5.2.2 Horticultural Crops
- 5.2.3 Row Crops
6 COMPETITIVE LANDSCAPE
- 6.1 Key Strategic Moves
- 6.2 Market Share Analysis
- 6.3 Company Landscape
- 6.4 Company Profiles (includes Global Level Overview, Market Level Overview, Core Business Segments, Financials, Headcount, Key Information, Market Rank, Market Share, Products and Services, and Analysis of Recent Developments).
- 6.4.1 Atlas Organics Inc.
- 6.4.2 California Organic Fertilizers Inc.
- 6.4.3 Cascade Agronomics LLC
- 6.4.4 Cedar Grove Composting Inc.
- 6.4.5 EB Stone & Sons Inc.
- 6.4.6 Morgan Composting Inc.
- 6.4.7 Sustane Natural Fertilizer Inc.
- 6.4.8 The Espoma Company
- 6.4.9 The Rich Lawn Company LLC
- 6.4.10 Walts Organic Fertilizers Co.
7 KEY STRATEGIC QUESTIONS FOR AGRICULTURAL BIOLOGICALS CEOS
8 APPENDIX
- 8.1 Global Overview
- 8.1.1 Overview
- 8.1.2 Porter's Five Forces Framework
- 8.1.3 Global Value Chain Analysis
- 8.1.4 Market Dynamics (DROs)
- 8.2 Sources & References
- 8.3 List of Tables & Figures
- 8.4 Primary Insights
- 8.5 Data Pack
- 8.6 Glossary of Terms
 2025年全球有機肥料市場報告
 中國有機肥料:市場佔有率分析、產業趨勢與統計、成長預測(2025-2030 年)北美有機肥料:市場佔有率分析、行業趨勢和成長預測(2025-2030)
 2021 - 2031 年有機肥料市場規模及預測、全球及地區佔有率、趨勢及成長機會分析報告涵蓋範圍:依來源、形態、作物類型及地理分類2025 年綠肥全球市場報告
 有機肥料市場:依來源、形式、應用、地區分類到 2030 年綠肥市場預測:按類型、作物類型、土壤類型、分銷管道、應用、最終用戶和地區進行的全球分析有機磷殺蟲劑市場按產品類型、成分、作物類型、應用、地區、機會和預測,2018 - 2032 年
 全球有機肥料市場:按來源、作物類型、形式和應用分類 - 2025-2030 年預測有機農藥市場規模、佔有率、成長分析,按產品類型、形式、應用、地區 - 產業預測 2024-2031