


 |
市場調查報告書
商品編碼
1687723
北美有機肥料:市場佔有率分析、行業趨勢和成長預測(2025-2030)North America Organic Fertilizer - Market Share Analysis, Industry Trends & Statistics, Growth Forecasts (2025 - 2030) |
||||||
※ 本網頁內容可能與最新版本有所差異。詳細情況請與我們聯繫。
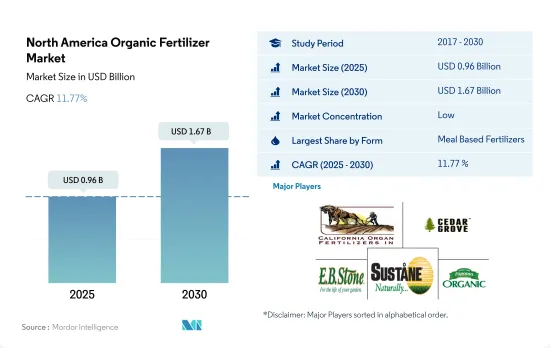
北美有機肥料市場規模預計在 2025 年為 9.6 億美元,預計到 2030 年將達到 16.7 億美元,預測期內(2025-2030 年)的複合年成長率為 11.77%。
- 有機肥料已成為植物生長可靠永續的營養來源,與合成肥料相比具有多種優勢,導致2017年至2022年間有機肥料使用量增加了56.5%。這些肥料易於獲取,成本效益高,並提供植物生長所需的中等濃度的關鍵元素,同時最大限度地減少了合成肥料的缺點。採用率的增加可能是由於營養物質逐漸釋放到土壤溶液中,從而保持土壤肥力和營養平衡,促進植物正常生長。
- 血粉、骨粉和海帶粉等膳食肥料是北美最常用的有機肥料。佔2022年市場佔有率的49.1%。這些肥料因其營養價值而受歡迎:血粉富含氮,骨粉富含磷和鈣,海帶粉 NPK 含量低但富含礦物質。
- 堆肥是第二大有機肥料,可以改善土壤的物理化學性質,例如土壤結構和保水能力。但堆肥的養分含量很低,無法提供作物所需的全部養分。為了解決這個問題,農民開始使用其他有機肥料,如油餅和魚糞。
- 自新冠疫情爆發以來,由於有機農業的普及和消費者對有機產品的興趣增加,北美的有機肥料使用量預計將進一步增加。這些肥料為維持土壤肥力、提高作物產量和確保糧食安全提供了永續且環保的解決方案。
- 北美有機肥料市場目前由美國主導,佔2022年市場價值的約40.7%。這種主導地位很大程度上歸功於該國大量的有機種植面積,2022年佔北美有機作物總作物面積的39.6%。墨西哥則位居第二,佔2022年該地區有機肥料市值的33.4%。墨西哥的有機作物總面積也在增加,預計到2028年將達到61萬公頃,增加10.9%。
- 2022 年,加拿大約佔該地區有機肥料市場總量的 25.5%。加拿大最近獲得了農業和農業食品部的投資,以支持有機產業的永續性和擴張,這將推動加拿大有機肥料市場的發展,預計 2023 年至 2029 年期間的複合年成長率為 11.4%。
- 北美以外地區(包括哥斯大黎加、古巴、牙買加和瓜地馬拉等國家)的有機種植面積從2017年到2022年成長了10.3%,到2022年達到5,500公頃。咖啡、糖、可可和香辛料等經濟作物是這些國家的主要種植作物,佔2022年有機種植面積的93.6%。
- 北美有機肥料市場受到有機作物日益成長的需求和永續農業的需求的推動。隨著越來越多的國家和公司投資有機農業領域,預計未來幾年市場將會成長。
北美有機肥料市場趨勢
美國等主要國家對有機農產品的需求正在成長,政府的支持也有助於增加有機農產品的種植面積。
- 根據FibL統計的資料,2021年北美有機種植面積達到創紀錄的150萬公頃。該地區的有機種植面積從2017年到2022年增加了13.5%。在北美國家中,美國佔據主導地位,有62.3萬公頃的農地進行有機種植,其中加州、緬因州和紐約州是實施有機種植的主要州。
- 緊隨美國之後的是墨西哥,2021年有機農業面積達531,100公頃。墨西哥是全球前20大有機食品生產國之一。根據世界咖啡大師的資料,墨西哥是世界上最大的有機咖啡出口國。這裡是全國有機咖啡生產面積最大、有機咖啡種植者數量最多的地區。該國主要的有機食品生產州包括恰帕斯州、瓦哈卡州、米卻肯州、奇瓦瓦州和格雷羅州,2021年這些州的有機種植面積佔全國的80.0%。全國有機農業協會等組織正在該國推廣有機農業,預計將激勵更多農民從事有機農業。除了資金支持,墨西哥政府也支持有助於推廣有機農業的研發活動。
- 加拿大作物作物面積將從2017年的40萬公頃增加到2021年的45萬公頃。 2021年將佔種植面積的最大佔有率,達42萬公頃。加拿大政府宣布,將於2021年向有機發展基金提供297,330美元,用於支持有機農民。這些努力有望增加該地區有機種植的面積。
國內外市場對有機農產品的需求不斷成長,人均有機食品支出不斷增加
- 2021年北美人均有機食品支出為109.7美元。美國的人均支出是北美國家中最高的,2021年平均支出為186.7美元。 2021年,美國有機產品銷售額超過630億美元。美國有機食品協會的數據顯示,2021與前一年同期比較有機食品銷售額達575億美元,較去年同期成長2.0%。有機水果和蔬菜佔有機產品總銷售額的15.0%,2021年銷售額達210億美元。
- 根據加拿大有機聯盟報告的資料,2020 年加拿大有機食品銷售額達到 81 億美元。加拿大是全球第六大有機產品市場,據報道,其有機產品供應未能滿足國內需求。 2021年有機食品人均支出為142.6美元。政府加大對零售商的支持力度預計將提高該國有機產品的供應量、可近性和可負擔性。有機塔爾德協會估計,加拿大有機產品市場將在 2021 年至 2026 年間成長,複合年成長率為 6.3%。
- 2021年,墨西哥有機產品市場規模為6,300萬美元,全球排名第35。預計墨西哥在 2021 年至 2026 年期間的複合年成長率為 7.2%。然而,該國 2021 年的人均有機產品支出為 0.49 美元,與該地區的其他國家相比較低。隨著越來越多的公司進入墨西哥市場,預計該國對有機產品的需求將會增加。
北美有機肥料產業概況。
北美有機肥市場分散,前五大公司佔8.74%的市佔率。市場的主要企業有:California Organic Fertilizers Inc.、Cedar Grove Composting Inc.、EBStone & Sons Inc.、Sustane Natural Fertilizer Inc. 和 The Espoma Company(按字母順序排列)。
其他福利
- Excel 格式的市場預測 (ME) 表
- 3個月的分析師支持
目錄
第1章執行摘要和主要發現
第2章 報告要約
第3章 引言
- 研究假設和市場定義
- 研究範圍
- 調查方法
第4章 產業主要趨勢
- 有機種植區
- 有機產品人均支出
- 法律規範
- 加拿大
- 墨西哥
- 美國
- 價值鍊和通路分析
第5章市場區隔
- 形式
- 肥料
- 餐食基肥料
- 油餅
- 其他有機肥料
- 作物類型
- 經濟作物
- 園藝作物
- 田間作物
- 國家
- 加拿大
- 墨西哥
- 美國
- 北美其他地區
第6章 競爭格局
- 關鍵策略趨勢
- 市場佔有率分析
- 商業狀況
- 公司簡介.
- BioFert Manufacturing Inc.
- California Organic Fertilizers Inc.
- Cascade Agronomics LLC
- Cedar Grove Composting Inc.
- EBStone & Sons Inc.
- Morgan Composting Inc.
- Sustane Natural Fertilizer Inc.
- The Espoma Company
- The Rich Lawn Company LLC
- Walts Organic Fertilizers Co.
第7章:CEO面臨的關鍵策略問題
第 8 章 附錄
- 世界概況
- 概述
- 五力分析框架
- 全球價值鏈分析
- 市場動態(DRO)
- 資訊來源及延伸閱讀
- 圖片列表
- 關鍵見解
- 資料包
- 詞彙表
The North America Organic Fertilizer Market size is estimated at 0.96 billion USD in 2025, and is expected to reach 1.67 billion USD by 2030, growing at a CAGR of 11.77% during the forecast period (2025-2030).
- Organic fertilizers emerged as a reliable and sustainable source of nutrients for plant growth, offering several advantages over synthetic fertilizers, leading to the increased usage of organic fertilizers by 56.5% between 2017 and 2022. These fertilizers are easily accessible, cost-effective, and provide a moderate concentration of vital elements required for plant growth while minimizing the drawbacks associated with synthetic fertilizers. The rise in adoption can be attributed to the gradual release of nutrients into the soil solution, which helps maintain soil fertility and nutrient balance, leading to proper plant growth.
- Meal-based fertilizers, such as blood meal, bone meal, and kelp meal, are the most consumed organic fertilizers in North America. They accounted for 49.1% of the market share in 2022. These fertilizers are popular due to their high nutrient content, with blood meal being rich in nitrogen, bone meal being high in phosphorus and calcium, and kelp meal being low in NPK but rich in minerals.
- Manures are the second largest organic fertilizers that improve the physiochemical properties of the soil, such as its structure and water-holding capacity. However, manures cannot provide all the necessary nutrients required for crops, as their nutrient content is significantly low. Farmers increasingly turn to other organic fertilizers, such as oilcake and fish guano, to address this issue.
- The growing adoption of organic farming and consumer interest in organic products following the COVID-19 pandemic is expected to drive further growth in the usage of organic fertilizers in North America. These fertilizers offer a sustainable and environmentally-friendly solution for maintaining soil fertility, improving crop yields, and ensuring food security.
- The North American organic fertilizers market is currently dominated by the United States, which accounted for approximately 40.7% of the market value in 2022. This domination is largely due to the country's large organic cultivation area, which accounted for 39.6% of the total North American organic crop area in 2022. In second place is Mexico, which accounted for 33.4% of the region's organic fertilizers market value in 2022. Mexico's total organic crop area is also increasing, with a projected growth of 10.9% to reach 610.0 thousand hectares by 2028.
- Canada accounted for approximately 25.5% of the total organic fertilizer market value in the region in 2022. The country has recently received an investment from the Ministry of Agriculture and Agri-Food to support the sustainability and expansion of its organics sector, which is anticipated to drive the Canadian organic fertilizer market and record a CAGR of 11.4% between 2023 and 2029
- The Rest of North America, which includes countries like Costa Rica, Cuba, Jamaica, and Guatemala, saw an increase in organic acreage by 10.3% between 2017 and 2022, reaching 5.5 thousand hectares in 2022. Cash crops such as coffee, sugar, cocoa, and spices are the major crops grown in these countries, and they accounted for 93.6% of total organic acreage in 2022.
- The North American organic fertilizer market is driven by the increasing demand for organic crops and the need for sustainable agriculture practices. As more countries and companies invest in the organic agriculture sector, the market is expected to grow in the coming years.
North America Organic Fertilizer Market Trends
Organic produce demand grows in major countries like the United States, increasing cultivation area with government support
- The area under organic cultivation of crops in North America was recorded at 1.5 million hectares in 2021, according to the data provided by FibL statistics. The organic area in the region increased by 13.5% between 2017 and 2022. Among the North American countries, the United States was dominant, with 623.0 thousand hectares of agricultural land under organic farming, with California, Maine, and New York being the major states practicing agriculture.
- The United States is followed by Mexico, with 531.1 thousand hectares of area under organic farming in 2021. Mexico is among the top 20 organic food producers in the world. Mexico is the largest exporter of organic coffee in the world, according to Global Coffee Masters data. The country has the largest area under organic coffee production and even in terms of the number of organic coffee producers in the country. The major organic food-producing states in the country include Chiapas, Oaxaca, Michoacan, Chihuahua, and Guerrero, which accounted for 80.0% of the total organic area in the country in 2021. Organizations such as National Association for Organic Agriculture promote organic agriculture in the country, which is expected to motivate more farmers to take up organic agriculture. In addition to financial assistance, the Mexican government supports research and development activities to help promote organic agriculture.
- Canada's area under organic crop cultivation increased from 0.40 million hectares in 2017 to 0.45 million hectares in 2021. Row crops occupied the maximum area with 0.42 million hectares in 2021. The Canadian government announced a sum of USD 297,330 in 2021 as Organic Development Fund to support organic farmers. These initiatives are expected to increase the organic area in the region.
Growing demand for organic produce in domestic and international markets, rise in per capita spending on organic food
- North America's average per capita spending on organic food products was USD 109.7 in 2021. The per capita spending in the United States is the highest among the North American countries, with average spending of USD 186.7 in 2021. The sales of organic products in the United States crossed USD 63.00 billion in 2021. Organic Tarde Association accounted for a 2.0% increase over the previous year, with organic food sales at USD 57.5 billion in 2021. Organic fruits and vegetables accounted for 15.0% of the total organic product sales, valued at USD 21.0 billion in 2021.
- Organic food sales in Canada reached a value of USD 8.10 billion in 2020, as per the data reported by the Organic Federation of Canada. It is reported that Canada is the 6th largest market in the world for Organic products, with the supply of organic products failing to keep up with the demand in the country. The average spending on organic food per person was USD 142.6 in 2021. Increasing government support to retailers is expected to increase the availability, accessibility, and affordability of organic products in the country. Organic Tarde Association estimated the organic products market in Canada to grow and register a CAGR of 6.3% between 2021 and 2026.
- In 2021, Mexico registered a market size of USD 63.0 million for organic products with a global rank of 35. It is estimated to grow and register a CAGR of 7.2% between 2021 and 2026. However, the per capita spending on organic products in the country is less than in other countries in the region, with a value of USD 0.49 in 2021. More players entering the market in Mexico are expected to increase the demand for organic products in the country.
North America Organic Fertilizer Industry Overview
The North America Organic Fertilizer Market is fragmented, with the top five companies occupying 8.74%. The major players in this market are California Organic Fertilizers Inc., Cedar Grove Composting Inc., E.B.Stone & Sons Inc., Sustane Natural Fertilizer Inc. and The Espoma Company (sorted alphabetically).
Additional Benefits:
- The market estimate (ME) sheet in Excel format
- 3 months of analyst support
TABLE OF CONTENTS
1 EXECUTIVE SUMMARY & KEY FINDINGS
2 REPORT OFFERS
3 INTRODUCTION
- 3.1 Study Assumptions & Market Definition
- 3.2 Scope of the Study
- 3.3 Research Methodology
4 KEY INDUSTRY TRENDS
- 4.1 Area Under Organic Cultivation
- 4.2 Per Capita Spending On Organic Products
- 4.3 Regulatory Framework
- 4.3.1 Canada
- 4.3.2 Mexico
- 4.3.3 United States
- 4.4 Value Chain & Distribution Channel Analysis
5 MARKET SEGMENTATION (includes market size in Value in USD and Volume, Forecasts up to 2030 and analysis of growth prospects)
- 5.1 Form
- 5.1.1 Manure
- 5.1.2 Meal Based Fertilizers
- 5.1.3 Oilcakes
- 5.1.4 Other Organic Fertilizer
- 5.2 Crop Type
- 5.2.1 Cash Crops
- 5.2.2 Horticultural Crops
- 5.2.3 Row Crops
- 5.3 Country
- 5.3.1 Canada
- 5.3.2 Mexico
- 5.3.3 United States
- 5.3.4 Rest of North America
6 COMPETITIVE LANDSCAPE
- 6.1 Key Strategic Moves
- 6.2 Market Share Analysis
- 6.3 Company Landscape
- 6.4 Company Profiles (includes Global Level Overview, Market Level Overview, Core Business Segments, Financials, Headcount, Key Information, Market Rank, Market Share, Products and Services, and Analysis of Recent Developments).
- 6.4.1 BioFert Manufacturing Inc.
- 6.4.2 California Organic Fertilizers Inc.
- 6.4.3 Cascade Agronomics LLC
- 6.4.4 Cedar Grove Composting Inc.
- 6.4.5 E.B.Stone & Sons Inc.
- 6.4.6 Morgan Composting Inc.
- 6.4.7 Sustane Natural Fertilizer Inc.
- 6.4.8 The Espoma Company
- 6.4.9 The Rich Lawn Company LLC
- 6.4.10 Walts Organic Fertilizers Co.
7 KEY STRATEGIC QUESTIONS FOR AGRICULTURAL BIOLOGICALS CEOS
8 APPENDIX
- 8.1 Global Overview
- 8.1.1 Overview
- 8.1.2 Porter's Five Forces Framework
- 8.1.3 Global Value Chain Analysis
- 8.1.4 Market Dynamics (DROs)
- 8.2 Sources & References
- 8.3 List of Tables & Figures
- 8.4 Primary Insights
- 8.5 Data Pack
- 8.6 Glossary of Terms
 2025年全球有機肥料市場報告
 中國有機肥料:市場佔有率分析、產業趨勢與統計、成長預測(2025-2030 年)美國有機肥料:市場佔有率分析、行業趨勢和成長預測(2025-2030)
 2021 - 2031 年有機肥料市場規模及預測、全球及地區佔有率、趨勢及成長機會分析報告涵蓋範圍:依來源、形態、作物類型及地理分類2025 年綠肥全球市場報告
 有機肥料市場:依來源、形式、應用、地區分類到 2030 年綠肥市場預測:按類型、作物類型、土壤類型、分銷管道、應用、最終用戶和地區進行的全球分析有機磷殺蟲劑市場按產品類型、成分、作物類型、應用、地區、機會和預測,2018 - 2032 年
 全球有機肥料市場:按來源、作物類型、形式和應用分類 - 2025-2030 年預測有機農藥市場規模、佔有率、成長分析,按產品類型、形式、應用、地區 - 產業預測 2024-2031