


|
市場調查報告書
商品編碼
1655857
供應商永續性:Ciena 在網路設備供應商中引領綠色發展,而晶片、光纖和中國供應商則落後Vendor Sustainability: Ciena Leads the Green Charge among NEPs; Chip, Fiber, and Chinese Vendors Lag |
|||||||
本報告涵蓋電信領域主要供應商的能源消耗、再生能源使用和碳足跡。
視覺
本報告是對先前兩份有關電信永續性的報告的後續:2023 年的 "供應商需要綠色證書才能贏得電信業務" 和 2024 年的 "隨著氣候變遷迅速惡化,營運商邁出實現永續發展的小步" 。
刊載組織
|
|
目錄
摘要
簡介
分析
刊載供應商概要
2023年的永續性報告:調查結果
- 能源消費
- 能源強度
- 溫室效應氣體的排放
領導企業·追隨者企業
總論
附錄
This brief report addresses energy consumption, use of renewables, and carbon emissions among key vendors to the telecommunications operator (telco) sector. MTN Consulting views climate change as an urgent crisis that is being ignored by too many of the world's wealthiest countries & companies. This report is part of our ongoing coverage of the issue, and an attempt to call greater attention to the subject.
VISUALS
This Brief is a follow-up to two pioneering reports published by MTN Consulting on sustainability in telecom: the 2023 study, "Vendors need green credentials to win telco business," and 2024's "Operators take baby steps towards sustainability as climate change worsens rapidly". The former report analyzed the role of vendors' climate practices in the carbon footprint of their key customers, the telcos. It also provided a framework for understanding the data and the relevant industry organizations and standards (e.g. GRI, SBTi, CDP, TCFD, JAC, GHG Protocol, GeSI, and SASB/ISSB). In the latter report, MTN Consulting reported on a disappointing lack of progress among telcos in their carbon footprints. Telco emissions were basically flat in 2023 YoY. That report's analysis considered only Scope 1 & Scope 2 emissions, and used the "market-based" standard for Scope 2 calculations. This approach should bias the numbers downwards, as it allows companies to reduce reported emissions based on things like renewable energy credits, but the results were nonetheless disappointing for the climate.
Since we did not include Scope 3 in our analysis, which capture upstream and downstream emissions, it's important to examine how vendors (i.e. the "upstream" for telcos) are progressing in their sustainability programs. Unfortunately, the news is not good. For a large sample of 26 vendors selling to telcos, total emissions (Scope 1 + Scope 2 market-based + Scope 3, or "S1-3m") amounted to 481 million metric tons of CO2-equivalent in 2023, down just 3% YoY. Relative to revenues, S1-3m emissions were 254.7 metric tons per US$1M in revenues in 2023, from 271.9 in 2022. Use of renewables rose a bit in 2023, to 68%, from 61% in 2022. All three results indicate some progress, but very slow. The progress is certainly not in line with the urgency of the climate crisis, or the stated carbon neutrality goals of telcos & much of the tech sector. One factor is that there are a few companies in the telco supply chain with notoriously high carbon footprints. Nearly all companies in China fall into this bucket, including top 5 Telco NI vendors Huawei, ZTE, and China Comservice. In addition, cabling & connectivity vendors like Corning and CommScope are behind the times in the march to green energy, as are chip companies further upstream such as Intel. More needs to be done, and quickly, in order for telecom to begin to be part of the solution rather than part of the problem.
That said, there are some leaders in the sector, based upon a relatively high level of renewable energy and low carbon emissions relative to revenues. Within the group of 26 , the leaders are: Accenture, Alphabet, Ciena, IBM, and Oracle. Notably, only one of these - Ciena - is a traditional "network equipment provider" or NEP. In general, NEPs tend to consume more energy and have higher carbon footprints than software & services specialists. Two other NEPs, Ericsson and Nokia, should get honorable mention, as they are making good progress and are relatively transparent in their reports.
Organizations mentioned:
|
|
Table of Contents
Summary
Introduction
Analysis
Overview of the vendors included
Results from 2023 sustainability reports
- Energy consumption
- Energy intensity
- Greenhouse gas emissions
Leaders and laggards
Conclusion
Appendix
List of Figures
- Figure 1: Total energy consumption in 2023, TWh
- Figure 2: Energy intensity, 2023 (MWh per $1M in revenues)
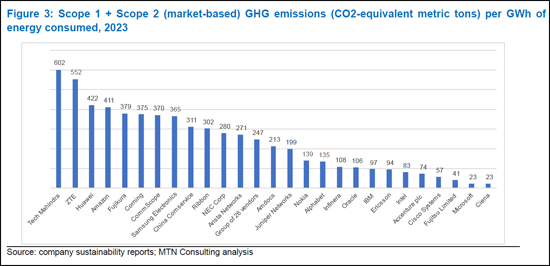
- Figure 3: Scope 1 + Scope 2 (market-based) GHG emissions (CO2-equivalent metric tons) per GWh of energy consumed, 2023
- Figure 4: Renewable energy as a percentage of total consumption, 2023
- Figure 5: Scope 1, 2 (market-based) and Scope 3 emissions, per US$1M in revenue, 2023
 全球永續原料市場 - 2025-2032
 全球水作為燃料市場研究報告 - 產業分析、規模、佔有率、成長、趨勢和預測 2025 年至 2033 年ESG 與永續發展領域的全球人工智慧市場 - 2025 至 2032 年到 2025 年全球 ESG、永續性和氣候技術市場十大成長機會
 永續性:市場佔有率分析、行業趨勢和統計、成長預測(2025-2030 年)
 先進生物為基礎永續材料的全球市場(2025年~2035年)
 隨著氣候變遷迅速惡化,企業邁出永續發展的第一步
 生物基建築材料市場機會、成長動力、產業趨勢分析及 2024 - 2032 年預測
 產品管理市場:按產品、組織規模和最終用戶分類 - 2025-2030 年全球預測中國的永續發展