


 |
市場調查報告書
商品編碼
1616875
寡核甘酸合成市場:Oligonucleotide Synthesis Market by Application Area, Type of Product Synthesized, Type of Oligonucleotide Synthesized, Scale of Operation, Therapeutic Area, End-Users, Company Size and Regions: Industry Trends and Global Forecasts, Till 2035 |
||||||
全球寡核甘酸合成市場規模預計將從目前的 48 億美元成長到 2035 年的 135 億美元,到 2035 年的預測期間複合年增長率為 9.9%。
寡核甘酸是製藥業成長最快的領域之一。這些分子廣泛應用於生物製藥和生物技術領域,用於研究、基因檢測、法醫分析和其他分析方法等各種應用。研究人員目前正在研究寡核甘酸作為治療多種疾病適應症的藥理學方法的潛力。此外,值得注意的是,不同地區的近300個臨床試驗已註冊,以評估各種寡核甘酸的治療目的。隨著寡核甘酸製造業的進步,許多自動化寡核甘酸合成儀正在被納入大規模生產中,用於寡核甘酸治療藥物的開發和製造。這些合成儀可以有效執行分子合成、保護基去除、純化、脫鹽和冷凍乾燥等步驟。然而,與寡核甘酸製造相關的挑戰包括開發時間長、缺乏純化技術、缺乏專業知識以及開發商的監管和合規問題,促使藥物開發公司將關鍵任務外包。目前,超過 110 家寡核甘酸合成提供者為研究、診斷和治療應用提供客製化寡核甘酸合成、寡核甘酸修飾和寡核甘酸純化服務。基於寡核甘酸的藥物管道的增長、有希望的臨床試驗結果以及該領域的廣泛研究活動預計將為預測期內的定制/合約服務提供者提供有利的市場成長機會。
該報告調查了全球寡核甘酸合成市場,並按應用領域、合成產品類型、合成寡核甘酸類型、業務規模、治療領域、最終用戶、公司規模提供了市場概述,並提供了區域趨勢以及進入市場的公司簡介。
目錄
第1章 前言
第 2 章執行摘要
第3章 簡介
第4章市場狀況:寡核甘酸製造(研究與診斷應用)
第5章市場狀況:寡核甘酸製造商(治療應用)
第6章企業競爭力分析:寡核甘酸製造(研究與診斷應用)
第7章企業競爭力分析:寡核甘酸製造商(治療應用)
第8章 公司簡介:寡核甘酸製造商(研究和診斷應用)
第9章 公司簡介:寡核甘酸製造商(治療應用)
第 10 章:製造與採購決策的決策架構
第11章 各大藥企的舉措
第12章 夥伴關係與合作
第 13 章最近的擴展
第14章 潛在合作夥伴分析
第15章 臨床試驗分析
第16章能力分析
第17章需求分析
第18章市場規模評估與機會分析
第19章 COVID-19大流行對寡核甘酸合成市場的影響
第20章 SWOT分析
第21章研究分析
第22章高階主管洞察
- 章節概述
- Hanugen Therapeutics
- Axolabs
- IBA Life Sciences
- BianoScience
第23章 結論
第24章附錄1:表格數據
第25章 附錄2:公司與組織名單
OLIGONUCLEOTIDE SYNTHESIS MARKET: OVERVIEW
As per Roots Analysis, the global oligonucleotide synthesis market is estimated to grow from USD 4.8 billion in the current year to USD 13.5 billion by 2035, at a CAGR of 9.9% during the forecast period, till 2035.
The market sizing and opportunity analysis has been segmented across the following parameters:
Application Area
- Research and Diagnostics
- Therapeutics
Type of Product Synthesized
- Active Pharmaceutical Ingredients
- Finished Dosage Forms
Type of Oligonucleotide Synthesized
- Antisense
- DNA
- siRNA
- Other Oligonucleotides
Scale of Operation
- Clinical
- Commercial
Therapeutic Area
- Cardiovascular Disorders
- Genetic Disorders
- Liver Disorders
- Rare Diseases
- Other Disorders
End-users
- Pharmaceutical/Biopharmaceutical Companies
- Academic And Research Institutes
- Hospitals
Company Size
- Small
- Mid-sized
- Large and Very Large
Key Geographical Regions
- North America
- Europe
- Asia-Pacific
- Rest of the World
OLIGONUCLEOTIDE SYNTHESIS MARKET: GROWTH AND TRENDS
Oligonucleotides are one of the fastest growing segments in the pharmaceutical industry. These molecules are extensively utilized in biopharmaceutical and biotechnology fields for various applications, including research, genetic testing, forensic analysis, and other analytical methods. Currently, researchers are investigating the potential of oligonucleotides as a pharmacological approach for the treatment of a myriad of disease indications. In addition, it is worth noting that close to 300 clinical trials have been registered across different geographical regions to evaluate various oligonucleotides for therapeutic purposes. As the oligonucleotide manufacturing industry advances, numerous automatic oligo synthesizers are being incorporated into large scale production for developing and producing oligonucleotide therapeutics. These synthesizers can execute steps, such as molecule synthesis, removal of protecting groups, purification, desalting and lyophilization, with increased efficiency. However, the challenges associated with oligonucleotide production, including extended timelines, lack of purification techniques, lack of expertise, and regulatory and compliance-related issues among the developers, have driven drug developers to outsource key operations. At present, over 110 oligonucleotide synthesis providers offer custom oligonucleotide synthesis, oligonucleotide modification and oligonucleotide purification services, which are intended for research, diagnostic and therapeutic applications. The growing oligonucleotide-based drugs pipeline, encouraging clinical trial results and extensive research activity in the domain, is likely to present lucrative market growth opportunities for custom / contract service providers, during the forecast period.
OLIGONUCLEOTIDE SYNTHESIS MARKET: KEY INSIGHTS
The report delves into the current state of the oligonucleotide synthesis market and identifies potential growth opportunities within the industry. Some key findings from the report include:
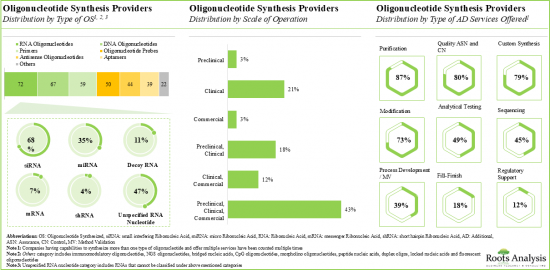
1. Presently, over 110 synthesis providers claim to have the necessary capabilities to offer oligonucleotide synthesis services; the majority of these firms are based in North America.
2. Stakeholders in this domain synthesize various types of oligonucleotides, across different scales of operations; close to 90% of the players offer purification services.
3. In pursuit of building a competitive edge in this field, stakeholders are actively upgrading their existing capabilities and adding new competencies in order to enhance their respective portfolios.
4. Close to 300 clinical trials (with over 75,000 enrolled patients) have been registered to investigate oligonucleotide based-therapeutic products, across different geographies.
5. Since 2017, several deals have been inked between various stakeholders engaged in this domain; acquisitions emerged as the most common type of partnership model.
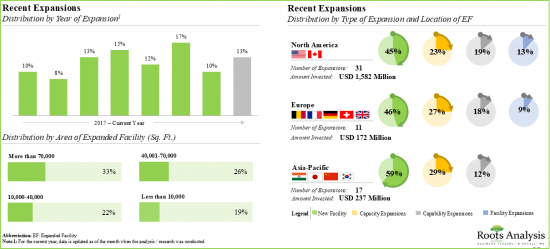
6. To keep pace with the growing demand for oligonucleotides, companies have made elaborate investments to expand their existing capacities and capabilities; this trend is most pronounced in the US and China.
7. Several big pharma players have undertaken various initiatives, including partnerships, expansions and funding initiatives; 48% of such initiatives were focused on the development and manufacturing of RNAi oligonucleotides.
8. The global, installed oligonucleotide synthesis capacity is spread across various geographies; interestingly, more than 75% of the total capacity is installed at the facilities owned by large and very large players.
9. Given the growing complexity of APIs, the demand for oligonucleotides has upsurged; by 2035, it is anticipated to reach around 2,200 kilograms, across clinical and commercial scales.
10. Considering the wide array of applications of oligonucleotides and the continuous research efforts of stakeholders in this domain, the adoption of these modalities is poised to witness steady growth in the foreseeable future.
11. Driven by the increasing number of chronic indications (requiring novel personalized therapies) and ongoing research on oligonucleotide-based therapeutics, this market is anticipated to grow at a CAGR of 9.9%, till 2035.
12. Over 40% of the market is expected to be captured by revenues generated from manufacturing drugs for rare diseases; further, oligonucleotide synthesis market in China is likely to grow at a faster pace.
OLIGONUCLEOTIDE SYNTHESIS MARKET: KEY SEGMENTS
Currently, the Oligonucleotide Finished Dosage Form holds the Largest Share of the Oligonucleotide Synthesis Market
Based on the type of product synthesized, the market is segmented into active pharmaceutical ingredients and finished dosage forms. It is worth highlighting that the majority of the current oligonucleotide synthesis market is captured by oligonucleotide finished dosage form and this trend is likely to remain same in the coming decade.
Antisense Oligonucleotide is Likely to Dominate the Oligonucleotide Synthesis Market During the Forecast Period
Based on the type of oligonucleotide synthesized, the market is segmented into antisense, DNA, siRNA and other oligonucleotides. It is worth highlighting that siRNA and antisense oligonucleotides-based therapies are likely to grow at a relatively higher CAGR, during the forecast period. This can be attributed to the rising number of approved siRNA and antisense oligonucleotides-based therapies for various rare diseases, genetic disorders and other disorders.
By Scale of Operation, Commercial Scale is Likely to Capture the Larger Share of the Oligonucleotide Synthesis Market During the Forecast Period
Based on scales of operation, the market is segmented into clinical and commercial scale. It is worth highlighting that the commercial scale manufacturing will be the primary driver of the overall market in the coming decade.
Currently, Pharmaceutical and Biopharmaceutical Companies hold the Largest Share within the Oligonucleotide Synthesis Market
Based on end user, the market is segmented into pharmaceutical and biopharmaceutical companies, academic and research institutes, and hospitals. It is worth highlighting that the revenues generated from manufacturing of oligonucleotides by pharmaceutical and biopharmaceutical companies is expected to grow substantially in the coming decade as compared to other end-users.
By Company Size, Mid-Sized Companies are Likely to Grow at a Relatively Higher Pace During the Forecast Period
Based on company size, the market is segmented into small, mid-sized, and large and very large companies. It is worth highlighting that the majority of the current oligonucleotide synthesis market is captured by large and very large players.
Rare Diseases Segment Accounts for the Largest Share for the Oligonucleotide Synthesis Market
Based on therapeutic areas, the market is segmented into cardiovascular disorders, genetic disorders, liver disorders, rare diseases and other disorders. While rare diseases account for a relatively higher market share, it is worth highlighting that cardiovascular disorders segment is expected to witness substantial market growth in the coming years.
North America Accounts for the Largest Share of the Market
Based on key geographical regions, the market is segmented into North America, Europe, Asia-Pacific and Rest of the World. It is worth highlighting that over the years, the market in Asia-Pacific is expected to grow at a higher CAGR.
Example Players in the Oligonucleotide Synthesis Market
- Agilent Technologies
- Ajinomoto Bio-Pharma Services
- CordenPharma
- Creative Biolabs
- Ella Biotech
- Eurofins Genomics
- Future synthesis
- Integrated DNA Technologies
- Kaneka Eurogentec
- LGC Biosearch Technologies
- Microsynth
- Nitto Avecia
- Merck
- Ribo Biotechnology
- STA Pharmaceutical
- Sumitomo Chemical
- Thermo Fisher Scientific
- TriLink Biotechnologies
Primary Research Overview
The opinions and insights presented in this study were influenced by discussions conducted with multiple stakeholders. The research report features detailed transcripts of interviews held with the following industry stakeholders:
- Founder and Managing Director, BianoGMP
- Co-Founder and Managing Director, Hanugen Therapeutics
- Chief Scientific Officer and Managing Director, IBA Life Sciences
- Chief Scientific Officer, Axolabs
- Business Officer, SBS Genetech
- Chem Lab Manager, Aptagen
- Global Corporate Sales and Business Development, Invitek Diagnostics
OLIGONUCLEOTIDE SYNTHESIS MARKET: RESEARCH COVERAGE
- The report features an in-depth analysis of the oligonucleotide synthesis market, focusing on key market segments, including application area, type of product synthesized, type of oligonucleotide synthesized, scale of operation, therapeutic area, end-users, company size and key geographical regions.
- The report analyzes various factors such as drivers, restraints, opportunities, and challenges affecting the market growth.
- A comprehensive evaluation of companies involved in oligonucleotide synthesis, considering various parameters, such as year of establishment, company size (in terms of employee count), location of headquarters, location of oligonucleotide synthesis facilities, scale of operation (preclinical, clinical and commercial), type of oligonucleotide synthesized (antisense oligonucleotides, aptamers, DNA oligonucleotides, oligonucleotide probes, primers, RNA oligonucleotides and others), type of product synthesized (oligonucleotide API and finished dosage form / drug product), application area (research, diagnostic and therapeutic) and type of additional services offered (process development / method validation, analytical testing, custom synthesis, sequencing, modification, purification, fill-finish, quality assurance and control, and regulatory support).
- A comprehensive competitive analysis of oligonucleotide synthesis providers, examining factors such as supplier strength (in terms of years of experience), service strength and number of oligonucleotide synthesis facilities.
- In-depth profiles of key industry players engaged in oligonucleotide synthesis services, focusing on company overviews, financial information (if available), service portfolio, recent developments and an informed future outlook.
- An insightful framework for the make-or-buy decision, emphasizing the key indicators and factors that affect sponsors and developers in determining whether to outsource oligonucleotide manufacturing or develop the means to carry it in-house.
- Examination of completed, ongoing, and planned clinical studies based on parameters like trial registration year, trial status, trial phase, enrolled patient population, type of sponsor, most active industry players (in terms of number of trials conducted), study design, therapeutic area and key geographical regions.
- An analysis of partnerships established in this sector, since 2014, based on several parameters, such as year of partnership, type of partnership, type of oligonucleotide, therapeutic area, application area and the most active players (in terms of the number of partnerships signed). It also provides the regional distribution of the companies involved in these agreements.
- An examination of the different expansion efforts made by oligonucleotide synthesis providers in this field to enhance their manufacturing capabilities, since 2015. This analysis considers various factors, including the year of expansion, type of expansion, scale of operation, application area, amount invested, area of facility and location of expanded facility.
- Assessment of the various oligonucleotide-focused manufacturing initiatives undertaken by big pharma players, based on several relevant parameters, such as number of initiatives, year of initiative, type of initiative, type of initiative, scale of operation, type of oligonucleotide manufactured, and amount invested.
- Estimation of global oligonucleotides manufacturing capacity, derived from data provided by various industry stakeholders in the public domain. This analysis emphasizes the distribution of the available capacity on the basis of company size (small, mid-sized, and large and very large firms) and key geographical regions (North America, Europe and, Asia-Pacific and Rest of the World).
- Informed estimates of the annual clinical demand for oligonucleotide therapeutics (in terms of target patient population in ongoing and planned clinical trials of oligonucleotide therapeutics). It also includes the commercial demand for oligonucleotides, taking into account the top 12 oligonucleotide-based therapies and phase III drugs, based on various relevant parameters, such as target patient population, dosing frequency and dose strength of the abovementioned products.
KEY QUESTIONS ANSWERED IN THIS REPORT
- How many companies are currently engaged in this market?
- Which are the leading companies in this market?
- What kind of partnership models are commonly adopted by industry stakeholders?
- What kinds of expansion initiatives have been undertaken by industry stakeholders?
- What is the current annual demand for oligonucleotides?
- What are the factors that are likely to influence the evolution of this market?
- What is current and future market size?
- What is the CAGR of this market?
- How is the current and future market opportunity likely to be distributed across key market segments?
REASONS TO BUY THIS REPORT
- The report provides a comprehensive market analysis, offering detailed revenue projections of the overall market and its specific sub-segments. This information is valuable to both established market leaders and emerging entrants.
- Stakeholders can leverage the report to gain a deeper understanding of the competitive dynamics within the market. By analyzing the competitive landscape, businesses can make informed decisions to optimize their market positioning and develop effective go-to-market strategies.
- The report offers stakeholders a comprehensive overview of the market, including key drivers, barriers, opportunities, and challenges. This information empowers stakeholders to stay abreast of market trends and make data-driven decisions to capitalize on growth prospects.
ADDITIONAL BENEFITS
- Complimentary PPT Insights Packs
- Complimentary Excel Data Packs for all Analytical Modules in the Report
- 10% Free Content Customization
- Detailed Report Walkthrough Session with Research Team
- Free Updated report if the report is 6-12 months old or older
TABLE OF CONTENTS
1. PREFACE
- 1.1. Scope of the Report
- 1.2. Research Methodology
- 1.3. Key Questions Answered
- 1.4. Chapter Outlines
2. EXECUTIVE SUMMARY
- 2.1. Chapter Overview
3. INTRODUCTION
- 3.1. Context and Background
- 3.2. Overview of Oligonucleotide-based Products
- 3.3. Types of Oligonucleotides
- 3.3.1. Antisense Oligonucleotides
- 3.3.2. Aptamers
- 3.3.3. miRNA
- 3.3.4. shRNA
- 3.3.5. siRNA
- 3.3.6. Other Oligonucleotides
- 3.4. Custom Synthesis of Oligonucleotides
- 3.4.1. Process Development and Characterization
- 3.4.2. Analytical Method Development
- 3.4.3. Method Validation and Testing
- 3.4.4. Quality Control and Quality Assurance
- 3.4.5. Challenges Associated with Custom Synthesis of Oligonucleotides
- 3.5. Chemical Modification of Oligonucleotides
- 3.5.1. Backbone Modification
- 3.5.2. Sugar Ring Modification
- 3.6. Purification of Oligonucleotides
- 3.6.1. Desalting
- 3.6.2. Cartridge Purification
- 3.6.3. Polyacrylamide Gel Electrophoresis (PAGE)
- 3.6.4. High Performance Liquid Chromatography (HPLC)
- 3.7. Outsourcing Oligonucleotide Manufacturing
- 3.7.1. Need for Outsourcing
- 3.7.2. Commonly Outsourced Operations
- 3.7.3. Advantages of Outsourcing Manufacturing Operations
- 3.7.4. Guidelines for Selecting a Service Provider
- 3.8. Growth Drivers and Roadblocks to Oligonucleotide Manufacturing
- 3.9. Recent Developments and Upcoming Trends
4. MARKET LANDSCAPE: OLIGONUCLEOTIDE MANUFACTURERES (RESEARCH AND DIAGNOSTIC APPLICATIONS)
- 4.1. Chapter Overview
- 4.2. Oligonucleotide Manufacturers Focused on Research and Diagnostic Applications: Overall Market Landscape
- 4.2.1. Analysis by Year of Establishment
- 4.2.2. Analysis by Company Size
- 4.2.3. Analysis by Scale of Operation
- 4.2.4. Analysis by Geographical Location
- 4.2.5. Analysis by Location of Manufacturing Facilities
- 4.2.6. Analysis by Regulatory Accreditations / Certifications Received
- 4.2.7. Analysis by Type of Oligonucleotide Manufactured
- 4.2.8. Analysis by Type of Offering
- 4.2.9. Analysis by Type of Manufacturing Service(s) Offered
- 4.2.10. Analysis by Type of Modification(s) Offered
- 4.2.11. Analysis by Type of Purification Method(s) Used
5. MARKET LANDSCAPE: OLIGONUCLEOTIDE MANUFACTURERES (THERAPEUTIC APPLICATIONS)
- 5.1. Chapter Overview
- 5.2. Oligonucleotide Manufacturers Focused on Therapeutic Applications: Overall Market Landscape
- 5.2.1. Analysis by Year of Establishment
- 5.2.2. Analysis by Company Size
- 5.2.3. Analysis by Scale of Operation
- 5.2.4. Analysis by Geographical Location
- 5.2.5. Analysis by Location of Manufacturing Facilities
- 5.2.6. Analysis by Regulatory Accreditations / Certifications
- 5.2.7. Analysis by Type of Oligonucleotide Manufactured
- 5.2.8. Analysis by Type of Offering
- 5.2.9. Analysis by Type of Manufacturing Service(s) Offered
- 5.2.10. Analysis by Type of Modification(s) Offered
- 5.2.11. Analysis by Type of Purification Method(s) Used
6. COMPANY COMPETITIVENESS ANALYSIS: OLIGONUCLEOTIDE MANUFACTURES (RESEARCH AND DIAGNOSTIC APPLICATIONS)
- 6.1. Chapter Overview
- 6.2. Assumptions / Key Parameters
- 6.3. Methodology
- 6.4. Company Competitiveness Analysis: Oligonucleotide Manufacturers Focused on Research and Diagnostic Applications
- 6.4.1. Oligonucleotide Manufacturers in North America
- 6.4.2. Oligonucleotide Manufacturers in Europe
- 6.4.3. Oligonucleotide Manufacturers in Asia-Pacific
7. COMPANY COMPETITIVENESS ANALYSIS: OLIGONUCLEOTIDE MANUFACTURERS (THERAPEUTIC APPLICATIONS)
- 7.1. Chapter Overview
- 7.2. Assumptions / Key Parameters
- 7.3. Methodology
- 7.4. Company Competitiveness Analysis: Oligonucleotide Manufacturers Focused on Therapeutic Applications
- 7.4.1. Oligonucleotide Manufacturers in North America
- 7.4.2. Oligonucleotide Manufacturers in Europe
- 7.4.3. Oligonucleotide Manufacturers in Asia-Pacific
8. COMPANY PROFILES: OLIGONUCLEOTIDE MANUFACTURERS (RESEARCH AND DIAGNOSTIC APPLICATIONS)
- 8.1. Chapter Overview
- 8.2. North America
- 8.2.1. Ajinomoto Bio-Pharma Services
- 8.2.1.1. Company Overview
- 8.2.1.2. Financial Information
- 8.2.1.3. Service Portfolio
- 8.2.1.4. Manufacturing Facilities and Capabilities
- 8.2.1.5. Recent Developments and Future Outlook
- 8.2.2. Integrated DNA Technologies
- 8.2.2.1. Company Overview
- 8.2.2.2. Service Portfolio
- 8.2.2.3. Manufacturing Facilities and Capabilities
- 8.2.2.4. Recent Developments and Future Outlook
- 8.2.3. Sigma Aldrich
- 8.2.3.1. Company Overview
- 8.2.3.2. Service Portfolio
- 8.2.3.3. Manufacturing Facilities and Capabilities
- 8.2.3.4. Recent Developments and Future Outlook
- 8.2.4. Thermo Fisher Scientific
- 8.2.4.1. Company Overview
- 8.2.4.2. Financial Information
- 8.2.4.3. Service Portfolio
- 8.2.4.4. Manufacturing Facilities and Capabilities
- 8.2.4.5. Recent Developments and Future Outlook
- 8.2.1. Ajinomoto Bio-Pharma Services
- 8.3. Europe
- 8.3.1. BioSpring
- 8.3.1.1. Company Overview
- 8.3.1.2. Service Portfolio
- 8.3.1.3. Manufacturing Facilities and Capabilities
- 8.3.1.4. Recent Developments and Future Outlook
- 8.3.2. Kaneka Eurogentec
- 8.3.2.1. Company Overview
- 8.3.2.2. Financial Information
- 8.3.2.3. Service Portfolio
- 8.3.2.4. Manufacturing Facilities and Capabilities
- 8.3.2.5. Recent Developments and Future Outlook
- 8.3.3. Microsynth
- 8.3.3.1. Company Overview
- 8.3.3.2. Service Portfolio
- 8.3.3.3. Manufacturing Facilities and Capabilities
- 8.3.3.4. Recent Developments and Future Outlook
- 8.3.1. BioSpring
- 8.4. Asia-Pacific and RoW
- 8.4.1. Sumitomo Chemical
- 8.4.1.1. Company Overview
- 8.4.1.2. Financial Information
- 8.4.1.3. Service Portfolio
- 8.4.1.4. Manufacturing Facilities and Capabilities
- 8.4.1.5. Recent Developments and Future Outlook
- 8.4.1. Sumitomo Chemical
9. COMPANY PROFILES: OLIGONUCLEOTIDE MANUFACTURERS (THERAPEUTIC APPLICATIONS)
- 9.1. Chapter Overview
- 9.2. North America
- 9.2.1. Agilent Technologies
- 9.2.1.1. Company Overview
- 9.2.1.2. Financial Information
- 9.2.1.3. Service Portfolio
- 9.2.1.4. Manufacturing Facilities and Capabilities
- 9.2.1.5. Recent Developments and Future Outlook
- 9.2.2. Nitto Denko Avecia
- 9.2.2.1. Company Overview
- 9.2.2.2. Financial Information
- 9.2.2.3. Service Portfolio
- 9.2.2.4. Manufacturing Facilities and Capabilities
- 9.2.2.5. Recent Developments and Future Outlook
- 9.2.3. TriLink Biotechnologies
- 9.2.3.1. Company Overview
- 9.2.3.2. Financial Information
- 9.2.3.3. Service Portfolio
- 9.2.3.4. Manufacturing Facilities and Capabilities
- 9.2.3.5. Recent Developments and Future Outlook
- 9.2.1. Agilent Technologies
- 9.3. Europe
- 9.3.1. CordenPharma
- 9.3.1.1. Company Overview
- 9.3.1.2. Service Portfolio
- 9.3.1.3. Manufacturing Facilities and Capabilities
- 9.3.1.4. Recent Developments and Future Outlook
- 9.3.2. LGC, Biosearch Technologies
- 9.3.2.1. Company Overview
- 9.3.2.2. Service Portfolio
- 9.3.2.3. Manufacturing Facilities and Capabilities
- 9.3.2.4. Recent Developments and Future Outlook
- 9.3.3. Lonza
- 9.3.3.1. Company Overview
- 9.3.3.2. Financial Information
- 9.3.3.3. Service Portfolio
- 9.3.3.4. Manufacturing Facilities and Capabilities
- 9.3.3.5. Recent Developments and Future Outlook
- 9.3.1. CordenPharma
- 9.4. Asia-Pacific
- 9.4.1. STA Pharmaceutical
- 9.4.1.1. Company Overview
- 9.4.1.2. Financial Information
- 9.4.1.3. Service Portfolio
- 9.4.1.4. Manufacturing Facilities and Capabilities
- 9.4.1.5. Recent Developments and Future Outlook
- 9.4.1. STA Pharmaceutical
10. MAKE VERSUS BUY DECISION FRAMEWORK
- 10.1. Chapter Overview
- 10.2. Assumptions and Key Parameters
- 10.3. Oligonucleotide Manufacturers: Make versus Buy Decision Making
- 10.3.1. Scenario 1
- 10.3.2. Scenario 2
- 10.3.3. Scenario 3
- 10.3.4. Scenario 4
- 10.4. Concluding Remarks
11. BIG PHARMA INITIATIVES
- 11.1. Chapter Overview
- 11.2. List of Oligonucleotide Manufacturing Initiatives
- 11.2.1. Analysis by Year of Initiative
- 11.2.2. Analysis by Type of Initiative
- 11.2.3. Analysis by Type of Oligonucleotide
12. PARTNERSHIPS AND COLLABORATIONS
- 12.1. Chapter Overview
- 12.2. Partnership Models
- 12.3. Oligonucleotide Manufacturers: Recent Partnerships and Collaborations
- 12.3.1. Analysis by Year of Partnership
- 12.3.2. Analysis by Type of Partnership
- 12.3.3. Analysis by Type of Partner
- 12.3.4. Most Active Players: Analysis by Number of Partnerships
- 12.3.5. Analysis by Region
- 12.3.5.1. Most Active Players: Analysis by Number of Partnerships and Region
- 12.3.5.2. Intercontinental and Intracontinental Agreements
- 12.4. Oligonucleotide Manufacturers: Mergers / Acquisitions
- 12.4.1. Analysis by Year of Merger / Acquisition
- 12.4.2. Analysis by Type of Acquisition
- 12.4.3. Key Value Drivers
13. RECENT EXPANSIONS
- 13.1. Chapter Overview
- 13.2. Oligonucleotide Manufacturers: Recent Expansions
- 13.2.1. Analysis by Year of Expansion
- 13.2.2. Analysis by Type of Expansion
- 13.2.3. Analysis by Purpose of Expansion
- 13.2.4. Analysis by Location of Facility
- 13.2.5. Analysis by Expanded Facility Area
- 13.2.6. Analysis by Scale of Operation
- 13.3.7. Most Active Players: Analysis by Number of Expansions
- 13.3.8. Analysis by Region
- 13.3.8.1. Continent-wise Distribution
- 13.3.8.2. Country-wise Distribution
14. LIKELY PARTNER ANALYSIS
- 14.1. Chapter Overview
- 14.2. Scoring Criteria and Key Assumptions
- 14.3. Scope and Methodology
- 14.4. Potential Strategic Partners
- 14.4.1. Likely Partners for Antisense Oligonucleotides Manufacturers
- 14.4.2. Likely Partners for siRNA Therapeutics Manufacturers
- 14.4.3. Likely Partners for miRNA Therapeutics Manufacturers
- 14.4.4. Likely Partners for shRNA and sshRNA Therapeutics Manufacturers
15. CLINICAL TRIAL ANALYSIS
- 15.1. Chapter Overview
- 15.2. Scope and Methodology
- 15.3. Oligonucleotide-based Products: Clinical Trial Analysis
- 15.3.1. Analysis by Trial Registration Year
- 15.3.2. Analysis by Trial Phase
- 15.3.3. Analysis by Type of Oligonucleotide
- 15.3.4. Analysis by Trial Phase and Type of Oligonucleotide
- 15.3.5. Analysis by Trial Recruitment Status
- 15.3.6. Analysis by Trial Focus Area
- 15.3.7. Analysis by Study Design
- 15.3.8. Geographical Analysis by Number of Clinical Trials
- 15.3.9. Geographical Analysis by Enrolled Patient Population
- 15.3.10. Analysis by Type of Sponsor / Collaborator
- 15.3.11. Most Active Players: Analysis by Number of Registered Trials
16. CAPACITY ANALYSIS
- 16.1. Chapter Overview
- 16.2. Key Assumptions and Methodology
- 16.3. Oligonucleotide Manufacturers: Global Annual Capacity
- 16.3.1. Analysis by Size of Manufacturer
- 16.3.2. Analysis by Scale of Operation
- 16.3.3. Analysis by Location of Manufacturing Facility
17. DEMAND ANALYSIS
- 17.1. Chapter Overview
- 17.2. Key Assumptions and Methodology
- 17.3. Global Demand for Oligonucleotide Manufacturing
- 17.3.1. Global Commercial Demand for Oligonucleotide Manufacturing
- 17.3.1.1. Analysis by Type of Oligonucleotide
- 17.3.1.2. Analysis by Target Therapeutic Area
- 17.3.1.3. Analysis by Region
- 17.3.2. Global Clinical Demand for Oligonucleotide Manufacturing
- 17.3.2.1. Analysis by Type of Oligonucleotide
- 17.3.2.2. Analysis by Phase of Development
- 17.3.2.3. Analysis by Target Therapeutic Area
- 17.3.2.4. Analysis by Region
- 17.3.1. Global Commercial Demand for Oligonucleotide Manufacturing
- 17.4. Demand and Supply Analysis
- 17.4.1. Scenario 1
- 17.4.2. Scenario 2
- 17.4.3. Scenario 3
18. MARKET SIZING AND OPPORTUNITY ANALYSIS
- 18.1. Chapter Overview
- 18.2. Key Assumptions and Forecast Methodology
- 18.3. Global Oligonucleotide Contract Manufacturing Market, till 2030
- 18.4. Oligonucleotide Manufacturing Market: Analysis by Application Area, till 2030
- 18.4.1. Oligonucleotide Manufacturing Market for Research and Diagnostics Applications, till 2030
- 18.4.2. Oligonucleotide Manufacturing Market for Therapeutics Applications, till 2030
- 18.4.2.1 Oligonucleotide Manufacturing Market: Analysis by Type of Oligonucleotide Manufactured, till 2030
- 18.4.2.1.1. Oligonucleotide Manufacturing Market for Antisense Oligonucleotides, till 2030
- 18.4.2.1.2. Oligonucleotide Manufacturing Market for miRNA, till 2030
- 18.4.2.1.3. Oligonucleotide Manufacturing Market for DNA Oligonucleotides, till 2030
- 18.4.2.1.4. Oligonucleotide Manufacturing Market for siRNA, till 2030
- 18.4.2.1.5. Oligonucleotide Manufacturing Market for Phosphorothioate Oligonucleotides, till 2030
- 18.4.2.1.6. Oligonucleotide Manufacturing Market for Decoy Oligonucleotides, till 2030
- 18.4.2.2. Oligonucleotide Manufacturing Market: Analysis by Scale of Operation, till 2030
- 18.4.2.2.1. Oligonucleotide Manufacturing Market for Clinical Scale Operations, till 2030
- 18.4.2.2.2. Oligonucleotide Manufacturing Market for Commercial Scale Operations, till 2030
- 18.4.2.3. Oligonucleotide Manufacturing Market: Analysis by Type of Operation, till 2030
- 18.4.2.3.1. Oligonucleotide Manufacturing Market for Active Pharmaceutical Ingredients, till 2030
- 18.4.2.3.2. Oligonucleotide Manufacturing Market for Finished Dosage Form, till 2030
- 18.4.2.4. Oligonucleotide Manufacturing Market: Analysis by Purpose of Production, till 2030
- 18.4.2.4.1. Oligonucleotide Manufacturing Market for In-House Operations, till 2030
- 18.4.2.4.2. Oligonucleotide Manufacturing Market for Outsourced Operations, till 2030
- 18.4.2.5. Oligonucleotide Manufacturing Market: Analysis by Target Therapeutic Area, till 2030
- 18.4.2.5.1. Oligonucleotide Manufacturing Market for Cardiovascular Disorders, till 2030
- 18.4.2.5.2. Oligonucleotide Manufacturing Market for CNS Disorders, till 2030
- 18.4.2.5.3. Oligonucleotide Manufacturing Market for Genetic Disorders, till 2030
- 18.4.2.5.4. Oligonucleotide Manufacturing Market for Hematological Diseases, till 2030
- 18.4.2.5.5. Oligonucleotide Manufacturing Market for Infectious Diseases, till 2030
- 18.4.2.5.6. Oligonucleotide Manufacturing Market for Metabolic Disorders, till 2030
- 18.4.2.5.7. Oligonucleotide Manufacturing Market for Neuromuscular Disorders, till 2030
- 18.4.2.5.8. Oligonucleotide Manufacturing Market for Oncological Disorders, till 2030
- 18.4.2.5.9. Oligonucleotide Manufacturing Market for Ophthalmic Disorders, till 2030
- 18.4.2.5.10. Oligonucleotide Manufacturing Market for Other Disorders, till 2030
- 18.4.2.6. Oligonucleotide Manufacturing Market: Analysis by Size of Manufacturer, till 2030
- 18.4.2.6.1. Oligonucleotide Manufacturing Market for Small Companies, till 2030
- 18.4.2.6.2. Oligonucleotide Manufacturing Market for Mid-sized Companies, till 2030
- 18.4.2.6.3. Oligonucleotide Manufacturing Market for Large and Very Large Companies, till 2030
- 18.4.2.7. Oligonucleotide Manufacturing Market: Analysis by Geography, till 2030
- 18.4.2.7.1. Oligonucleotide Manufacturing Market in North America, till 2030
- 18.4.2.7.2. Oligonucleotide Manufacturing Market in Europe, till 2030
- 18.4.2.7.3. Oligonucleotide Manufacturing Market in Asia-Pacific and Rest of the World, till 2030
- 18.4.2.1 Oligonucleotide Manufacturing Market: Analysis by Type of Oligonucleotide Manufactured, till 2030
19. IMPACT OF COVID-19 PANDEMIC ON OLIGONUCLEOTIDE SYNTHESIS MARKET
- 19.1. Chapter Overview
- 19.2. Impact of COVID-19 on Oligonucleotide Synthesis Market
- 19.2.1. Impact on Future Oligonucleotide Market Opportunity
- 19.3. Recuperative Strategies for Businesses
- 19.3.1. Strategies for Implementation in the Short / Mid Term
- 19.3.2. Strategies for Implementation in the Long Term
20. SWOT ANALYSIS
- 20.1. Chapter Overview
- 20.2. Comparison of SWOT Factors
21. SURVEY ANALYSIS
- 21.1. Chapter Overview
- 21.2. Overview of Respondents
- 21.2.1. Analysis by Seniority Level of Respondents
- 21.3. Analysis of Survey Insights
- 21.3.1. Analysis by Type of Offering
- 21.3.2. Analysis by Application
- 21.3.3. Analysis by Installed Manufacturing Capacity
- 21.3.4. Analysis by Location of Manufacturing Facility
- 21.3.5. Analysis by Extent of Outsourcing
- 21.3.6. Analysis by Current Market Opportunity
22. EXECUTIVE INSIGHTS
- 22.1. Chapter Overview
- 22.2. Hanugen Therapeutics
- 22.2.1. Company Snapshot
- 22.2.2. Interview Transcript: Arun Shastry, Co-Founder and Managing Director
- 22.3. Axolabs
- 22.3.1. Company Snapshot
- 22.3.2. Interview Transcript: Hans-Peter Vornlocher, Managing Director
- 22.4. IBA Life Sciences
- 22.4.1. Company Snapshot
- 22.4.2. Interview Transcript: Joachim Bertram, Chief Scientific Officer and Managing Director
- 22.5. BianoScience
- 22.5.1. Company Snapshot
- 22.5.2. Interview Transcript: Tobias Pohlmann, Founder and Managing Director
23. CONCLUDING REMARKS
- 23.1. Chapter Overview
24. APPENDIX 1: TABULATED DATA
25. APPENDIX 2: LIST OF COMPANIES AND ORGANIZATIONS
List of Tables
- Table 4.1 Oligonucleotide Manufacturers Focused on Research and Diagnostic Applications: List of Industry Players
- Table 4.2 Oligonucleotide Manufacturers Focused on Research and Diagnostic Applications: Information on Location of Manufacturing Facilities and Regulatory Accreditations / Certifications Received
- Table 4.3 Oligonucleotide Manufacturers Focused on Research and Diagnostic Applications: Information on Type of Oligonucleotide Manufactured and Type of Offering
- Table 4.4 Oligonucleotide Manufacturers Focused on Research and Diagnostic Applications: Information on Type of Manufacturing Service(s) Offered
- Table 4.5 Oligonucleotide Manufacturers Focused on Research and Diagnostic Applications: Information on Type of Modification(s) Offered and Type of Purification Method(s) Used
- Table 5.1 Oligonucleotide Manufacturers Focused on Therapeutic Applications: List of Industry Players
- Table 5.2 Oligonucleotide Manufacturers Focused on Therapeutic Applications: Information on Location of Manufacturing Facilities and Regulatory Accreditations / Certifications Received
- Table 5.3 Oligonucleotide Manufacturers Focused on Therapeutic Applications: Information on Type of Oligonucleotide Manufactured and Type of Offering
- Table 5.4 Oligonucleotide Manufacturers Focused on Therapeutic Applications: Information on Type of Manufacturing Service(s) Offered
- Table 5.5 Oligonucleotide Manufacturers Focused on Therapeutic Applications: Information on Type of Modification(s) Offered and Type of Purification Method(s) Used
- Table 8.1 Ajinomoto Bio-Pharma Services: Key Highlights
- Table 8.2 Ajinomoto Bio-Pharma Services: Service Portfolio
- Table 8.3 Ajinomoto Bio-Pharma Services: Manufacturing Facilities and Capabilities
- Table 8.4 Ajinomoto Bio-Pharma Services: Recent Developments and Future Outlook
- Table 8.5 Integrated DNA Technologies: Key Highlights
- Table 8.6 Integrated DNA Technologies: Service Portfolio
- Table 8.7 Integrated DNA Technologies: Manufacturing Facilities and Capabilities
- Table 8.8 Integrated DNA Technologies: Recent Developments and Future Outlook
- Table 8.9 Sigma Aldrich: Key Highlights
- Table 8.10 Sigma Aldrich: Service Portfolio
- Table 8.11 Sigma Aldrich: Manufacturing Facilities and Capabilities
- Table 8.12 Sigma Aldrich: Recent Developments and Future Outlook
- Table 8.13 Thermo Fisher Scientific: Key Highlights
- Table 8.14 Thermo Fisher Scientific: Service Portfolio
- Table 8.15 Thermo Fisher Scientific: Manufacturing Facilities and Capabilities
- Table 8.16 Thermo Fisher Scientific: Recent Developments and Future Outlook
- Table 8.17 BioSpring: Key Highlights
- Table 8.18 BioSpring: Service Portfolio
- Table 8.19 BioSpring: Manufacturing Facilities and Capabilities
- Table 8.20 Kaneka Eurogentec: Key Highlights
- Table 8.21 Kaneka Eurogentec: Service Portfolio
- Table 8.22 Kaneka Eurogentec: Manufacturing Facilities and Capabilities
- Table 8.23 Microsynth: Key Highlights
- Table 8.24 Microsynth: Service Portfolio
- Table 8.25 Microsynth: Manufacturing Facilities and Capabilities
- Table 8.26 Sumitomo Chemical: Key Highlights
- Table 8.27 Sumitomo Chemical: Service Portfolio
- Table 8.28 Sumitomo Chemical: Manufacturing Facilities and Capabilities
- Table 9.1 Agilent Technologies: Key Highlights
- Table 9.2 Agilent Technologies: Service Portfolio
- Table 9.3 Agilent Technologies: Manufacturing Facilities and Capabilities
- Table 9.4 Agilent Technologies: Recent Developments and Future Outlook
- Table 9.5 Nitto Denko Avecia: Key Highlights
- Table 9.6 Nitto Denko Avecia: Service Portfolio
- Table 9.7 Nitto Denko Avecia: Manufacturing Facilities and Capabilities
- Table 9.8 Nitto Denko Avecia: Recent Developments and Future Outlook
- Table 9.9 TriLink Biotechnologies: Key Highlights
- Table 9.10 TriLink Biotechnologies: Service Portfolio
- Table 9.11 TriLink Biotechnologies: Manufacturing Facilities and Capabilities
- Table 9.12 TriLink Biotechnologies: Recent Developments and Future Outlook
- Table 9.13 CordenPharma: Key Highlights
- Table 9.14 CordenPharma: Service Portfolio
- Table 9.15 CordenPharma: Manufacturing Facilities and Capabilities
- Table 9.16 CordenPharma: Recent Developments and Future Outlook
- Table 9.17 LGC, Biosearch Technologies: Key Highlights
- Table 9.18 LGC, Biosearch Technologies: Service Portfolio
- Table 9.19 LGC, Biosearch Technologies: Manufacturing Facilities and Capabilities
- Table 9.20 LGC, Biosearch Technologies: Recent Developments and Future Outlook
- Table 9.21 Lonza: Key Highlights
- Table 9.22 Lonza: Service Portfolio
- Table 9.23 Lonza: Manufacturing Facilities and Capabilities
- Table 9.24 STA Pharmaceutical: Key Highlights
- Table 9.25 STA Pharmaceutical: Service Portfolio
- Table 9.26 STA Pharmaceutical: Manufacturing Facilities and Capabilities
- Table 9.27 STA Pharmaceutical: Recent Developments and Future Outlook
- Table 11.1 Big Pharma Players: List of Oligonucleotide Manufacturing Initiatives
- Table 12.1 Oligonucleotide Manufacturers: List of Partnerships, since 2014
- Table 12.2 Oligonucleotide Manufacturers: Leading Players in Terms of Number of Partnerships Established with Different Types of Partners
- Table 12.3 Most Active Players: Geographical Distribution by Type of Partnership Model
- Table 12.4 Oligonucleotide Manufacturers: Key Value Drivers
- Table 13.1 Oligonucleotide Manufacturers: List of Expansions, since 2016
- Table 14.1 Likely Partner Opportunities for Antisense Oligonucleotide Manufactures
- Table 14.2 Likely Partner Opportunities for siRNA Therapeutics Manufacturers
- Table 14.3 Likely Partner Opportunities for miRNA Therapeutics Manufacturers
- Table 14.4 Likely Partner Opportunities for shRNA and sshRNA Therapeutics Manufacturers
- Table 16.1 Global, Annual Oligonucleotide Manufacturing Capacity: Average Capacity by Size of Manufacturer (Sample Data Set)
- Table 16.2 Global, Annual Oligonucleotide Manufacturing Capacity: Distribution by Size of Manufacturer
- Table 17.1 Global, Annual Oligonucleotide Manufacturing Demand (Scenario 1), till 2030 (Kilograms)
- Table 17.2 Global, Annual Oligonucleotide Manufacturing Demand (Scenario 2), till 2030 (Kilograms)
- Table 17.3 Global, Annual Oligonucleotide Manufacturing Demand (Scenario 3), till 2030 (Kilograms)
- Table 21.1 Survey Analysis: Overview of Respondents
- Table 21.2 Survey Analysis: Information on Seniority Level of Respondents
- Table 21.3 Survey Analysis: Information on Type of Offering
- Table 21.4 Survey Analysis: Information on Application
- Table 21.5 Survey Analysis: Information on Oligonucleotide Manufacturing Capacity
- Table 21.6 Survey Analysis: Number and Location of Manufacturing Facilities
- Table 21.7 Survey Analysis: Information on Extent of Outsourcing
- Table 21.8 Survey Analysis: Current Market Opportunity (USD Billion)
- Table 22.1 Hanugen Therapeutics: Key Highlights
- Table 22.2 Axolabs: Key Highlights
- Table 22.1 IBA Life Sciences: Key Highlights
- Table 22.2 BianoScience: Key Highlights
- Table 24.1 Oligonucleotide Manufacturers Focused on Research and Diagnostic Applications: Distribution by Year of Establishment
- Table 24.2 Oligonucleotide Manufacturers Focused on Research and Diagnostic Applications: Distribution by Company Size
- Table 24.3 Oligonucleotide Manufacturers Focused on Research and Diagnostic Applications: Distribution by Scale of Operation
- Table 24.4 Oligonucleotide Manufacturers Focused on Research and Diagnostic Applications: Distribution by Company Size and Scale of Operation
- Table 24.5 Oligonucleotide Manufacturers Focused on Research and Diagnostic Applications: Distribution by Location of Headquarters
- Table 24.6 Oligonucleotide Manufacturers Focused on Research and Diagnostic Applications: Distribution by Location of Manufacturing Facilities (Country-wise)
- Table 24.7 Oligonucleotide Manufacturers Focused on Research and Diagnostic Applications: Distribution by Regulatory Accreditations / Certifications
- Table 24.8 Oligonucleotide Manufacturers Focused on Research and Diagnostic Applications: Distribution by Type of Oligonucleotide Manufactured
- Table 24.9 Oligonucleotide Manufacturers Focused on Research and Diagnostic Applications: Distribution by Type of Offering
- Table 24.10 Oligonucleotide Manufacturers Focused on Research and Diagnostic Applications: Distribution by Company Size and Type of Offering
- Table 24.11 Oligonucleotide Manufacturers Focused on Research and Diagnostic Applications: Distribution by Type of Oligonucleotide Manufactured and Type of Offering (Custom Synthesis)
- Table 24.12 Oligonucleotide Manufacturers Focused on Research and Diagnostic Applications: Distribution by Type of Manufacturing Service(s) Offered
- Table 24.13 Oligonucleotide Manufacturers Focused on Research and Diagnostic Applications: Distribution by Type of Modification(s) Offered
- Table 24.14 Oligonucleotide Manufacturers Focused on Research and Diagnostic Applications: Distribution by Type of Purification Method(s) Used
- Table 24.15 Oligonucleotide Manufacturers Focused on Therapeutic Applications: Distribution by Year of Establishment
- Table 24.16 Oligonucleotide Manufacturers Focused on Therapeutic Applications: Distribution by Company Size
- Table 24.17 Oligonucleotide Manufacturers Focused on Therapeutic Applications: Distribution by Scale of Operation
- Table 24.18 Oligonucleotide Manufacturers Focused on Therapeutic Applications: Distribution by Company Size and Scale of Operation
- Table 24.19 Oligonucleotide Manufacturers Focused on Therapeutic Applications: Distribution by Location of Headquarters
- Table 24.20 Oligonucleotide Manufacturers Focused on Therapeutic Applications: Distribution by Location of Manufacturing Facilities (Country-wise)
- Table 24.21 Oligonucleotide Manufacturers Focused on Therapeutic Applications: Distribution by Regulatory Accreditations / Certifications
- Table 24.22 Oligonucleotide Manufacturers Focused on Therapeutic Applications: Distribution by Type of Oligonucleotide Manufactured
- Table 24.23 Oligonucleotide Manufacturers Focused on Therapeutic Applications: Distribution by Type of Offering
- Table 24.24 Oligonucleotide Manufacturers Focused on Therapeutic Applications: Distribution by Company Size and Type of Offering
- Table 24.25 Oligonucleotide Manufacturers Focused on Therapeutic Applications: Distribution by Type of Oligonucleotide Manufactured and Type of Offering (Modification)
- Table 24.26 Oligonucleotide Manufacturers Focused on Therapeutic Applications: Distribution by Type of Manufacturing Service(s) Offered
- Table 24.27 Oligonucleotide Manufacturers Focused on Therapeutic Applications: Distribution by Type of Modification(s) Offered
- Table 24.28 Oligonucleotide Manufacturers Focused on Therapeutic Applications: Distribution by Type of Purification Method(s) Used
- Table 24.29 Ajinomoto Group: Annual Revenues (JPY Billion)
- Table 24.30 Thermo Fisher Scientific: Annual Revenues (USD Billion)
- Table 24.31 Kaneka Group: Annual Revenues (JPY Billion)
- Table 24.32 Sumitomo Chemical: Annual Revenues (JPY Billion)
- Table 24.33 Agilent Technologies: Annual Revenues (USD Billion)
- Table 24.34 Nitto Denko Avecia: Annual Revenues (JPY Billion)
- Table 24.35 TriLink Biotechnologies: Annual Revenues (USD Billion)
- Table 24.36 Lonza: Annual Revenues (CHF Billion)
- Table 24.37 STA Pharmaceutical: Annual Revenues (RMB Billion)
- Table 24.38 Big Pharma Initiatives: Cumulative Distribution by Year of Initiative, since 2014
- Table 24.39 Big Pharma Initiatives: Distribution by Type of Initiative
- Table 24.40 Big Pharma Initiatives: Distribution by Type of Oligonucleotide Manufactured
- Table 24.41 Partnerships and Collaborations: Cumulative Distribution by Year of Partnership, since 2014
- Table 24.42 Partnerships and Collaborations: Distribution by Type of Partnership
- Table 24.43 Partnerships and Collaborations: Year-wise Trend by Type of Partnership, since 2014
- Table 24.44 Partnerships and Collaborations: Distribution by Type of Partner
- Table 24.45 Most Active Players: Distribution by Number of Partnerships
- Table 24.46 Most Active Players: Country-wise Distribution by Number of Partnerships
- Table 24.47 Partnerships and Collaborations: Intercontinental and Intracontinental Distribution
- Table 24.48 Mergers and Acquisitions: Distribution by Year of Merger / Acquisition, since 2014
- Table 24.49 Mergers and Acquisitions: Distribution by Type of Acquisition
- Table 24.50 Mergers and Acquisitions: Key Value Drivers
- Table 24.51 Recent Expansions: Cumulative Distribution by Year of Expansion, since 2016
- Table 24.52 Recent Expansions: Distribution by Type of Expansion
- Table 24.53 Recent Expansions: Distribution by Type of Expansion and Purpose of Expansion
- Table 24.54 Recent Expansions: Distribution by Location of Facility
- Table 24.55 Recent Expansions: Distribution by Type of Expansion and Location of Facility
- Table 24.56 Recent Expansions: Distribution by Expanded Facility Area (Sq ft)
- Table 24.57 Recent Expansions: Distribution by Scale of Operation
- Table 24.58 Most Active Players: Distribution by Number of Expansions
- Table 24.59 Recent Expansions: Year-wise Trend by Geography, since 2015
- Table 24.60 Recent Expansions: Distribution by Geography
- Table 24.61 Clinical Trial Analysis: Cumulative Distribution by Trial Registration Year, since 2013
- Table 24.62 Clinical Trial Analysis: Distribution by Trial Phase
- Table 24.63 Clinical Trial Analysis: Distribution by Type of Oligonucleotide
- Table 24.64 Clinical Trial Analysis: Distribution by Trial Phase and Type of Oligonucleotide
- Table 24.65 Clinical Trial Analysis: Distribution by Trial Registration Year and Type of Oligonucleotide, since 2013
- Table 24.66 Clinical Trial Analysis: Distribution by Trial Recruitment Status
- Table 24.67 Clinical Trial Analysis: Distribution by Trial Registration Year and Recruitment Status
- Table 24.68 Clinical Trial Analysis: Distribution by Study Design
- Table 24.69 Clinical Trial Analysis: Geographical Distribution by Number of Clinical Trials
- Table 24.70 Clinical Trial Analysis: Geographical Distribution by Trial Registration Year, since 2012
- Table 24.71 Clinical Trial Analysis: Geographical Distribution by Enrolled Patient Population
- Table 24.72 Clinical Trial Analysis: Cumulative Distribution by Trial Registration Year and Enrolled Patient Population, since 2012
- Table 24.73 Clinical Trial Analysis: Geographical Distribution by Trial Registration Year and Trial Recruitment Status
- Table 24.74 Clinical Trial Analysis: Distribution by Type of Sponsor / Collaborator
- Table 24.75 Most Active Industry Players: Distribution by Number of Registered Trials
- Table 24.76 Most Active Non-Industry Players: Distribution by Number of Registered Trials
- Table 20.77 Global, Annual Oligonucleotide Manufacturing Capacity: Distribution by Size of Manufacturers (Sample Data Set)
- Table 24.78 Global, Annual Oligonucleotide Manufacturing Capacity: Distribution by Size of Manufacturers (Kilograms)
- Table 24.79 Global, Annual Oligonucleotide Manufacturing Capacity: Distribution by Scale of Operation (Kilograms)
- Table 24.80 Global, Annual Oligonucleotide Manufacturing Capacity: Distribution by Location of Manufacturing Facility (Kilograms)
- Table 24.81 Global Demand for Oligonucleotide Manufacturing (Kilograms)
- Table 24.82 Global, Commercial Demand for Oligonucleotide Manufacturing (Kilograms)
- Table 24.83 Global, Commercial Demand for Oligonucleotide Manufacturing: Distribution by Type of Oligonucleotide (Kilograms)
- Table 24.84 Global, Commercial Demand for Oligonucleotide Manufacturing: Distribution by Target Therapeutic Area (Kilograms)
- Table 24.85 Global, Commercial Demand for Oligonucleotide Manufacturing: Distribution by Geography (Kilograms)
- Table 24.86 Global, Clinical Demand for Oligonucleotide Manufacturing (Kilograms)
- Table 24.87 Global, Clinical Demand for Oligonucleotide Manufacturing: Distribution by Type of Oligonucleotide (Kilograms)
- Table 24.88 Global, Clinical Demand for Oligonucleotide Manufacturing: Distribution by Phase of Development (Kilograms)
- Table 24.89 Global, Clinical Demand for Oligonucleotide Manufacturing: Distribution by Target Therapeutic Area (Kilograms)
- Table 24.90 Global, Clinical Demand for Oligonucleotide Manufacturing: Distribution by Geography (Kilograms)
- Table 20.91 Global Oligonucleotide Manufacturing: Demand and Supply (Scenario 1), till 2030
- Table 24.92 Global Oligonucleotide Manufacturing: Demand and Supply (Scenario 2), till 2030
- Table 24.93 Global Oligonucleotide Manufacturing: Demand and Supply (Scenario 3), till 2030
- Table 20.94 Global Oligonucleotide Contract Manufacturing Market, Conservative, Base and Optimistic, till 2030 (USD Million)
- Table 20.95 Oligonucleotide Manufacturing Market for Research and Diagnostics Applications, Conservative, Base and Optimistic, till 2030 (USD Million)
- Table 20.96 Oligonucleotide Manufacturing Market for Therapeutic Applications, Conservative, Base and Optimistic, till 2030 (USD Million)
- Table 20.97 Oligonucleotide Manufacturing Market: Distribution by Type of Oligonucleotide Manufactured, 2021 and 2030
- Table 20.98 Oligonucleotide Manufacturing Market for Antisense Oligonucleotides, Conservative, Base and Optimistic, till 2030 (USD Million)
- Table 20.99 Oligonucleotide Manufacturing Market for miRNA, Conservative, Base and Optimistic, till 2030 (USD Million)
- Table 20.100 Oligonucleotide Manufacturing Market for DNA Oligonucleotides, Conservative, Base and Optimistic, till 2030 (USD Million)
- Table 20.101 Oligonucleotide Manufacturing Market for siRNA, Conservative, Base and Optimistic, till 2030 (USD Million)
- Table 20.102 Oligonucleotide Manufacturing Market for Phosphorothioate Oligonucleotides, Conservative, Base and Optimistic, till 2030 (USD Million)
- Table 20.103 Oligonucleotide Manufacturing Market for Decoy Oligonucleotides, Conservative, Base and Optimistic, till 2030 (USD Million)
- Table 20.104 Oligonucleotide Manufacturing Market for Clinical Scale Operations, Conservative, Base and Optimistic, till 2030 (USD Million)
- Table 20.105 Oligonucleotide Manufacturing Market for Commercial Scale Operations, Conservative, Base and Optimistic, till 2030 (USD Million)
- Table 20.106 Oligonucleotide Manufacturing Market for Active Pharmaceutical Ingredients, Conservative, Base and Optimistic, till 2030 (USD Million)
- Table 20.107 Oligonucleotide Manufacturing Market for Finished Dosage Form, Conservative, Base and Optimistic, till 2030 (USD Million)
- Table 20.108 Oligonucleotide Manufacturing Market for In-house Manufacturing Operations, Conservative, Base and Optimistic, till 2030 (USD Million)
- Table 20.109 Oligonucleotide Manufacturing Market for Outsourced Operations, Conservative, Base and Optimistic, till 2030 (USD Million)
- Table 20.110 Oligonucleotide Manufacturing Market: Distribution by Target Therapeutic Area, 2025 and 2030 (USD Million)
- Table 20.111 Oligonucleotide Manufacturing Market for Cardiovascular Disorders, Conservative, Base and Optimistic, till 2030 (USD Million)
- Table 20.112 Oligonucleotide Manufacturing Market for CNS Disorders, Conservative, Base and Optimistic, till 2030 (USD Million)
- Table 20.113 Oligonucleotide Manufacturing Market for Genetic Disorders, Conservative, Base and Optimistic, till 2030 (USD Million)
- Table 20.114 Oligonucleotide Manufacturing Market for Hematological Diseases, Conservative, Base and Optimistic, till 2030 (USD Million)
- Table 20.115 Oligonucleotide Manufacturing Market for Infectious Diseases, Conservative, Base and Optimistic, till 2030 (USD Million)
- Table 20.116 Oligonucleotide Manufacturing Market for Metabolic Disorders, Conservative, Base and Optimistic, till 2030 (USD Million)
- Table 20.117 Oligonucleotide Manufacturing Market for Neuromuscular Disorders, Conservative, Base and Optimistic, till 2030 (USD Million)
- Table 20.118 Oligonucleotide Manufacturing Market for Oncological Disorders, Conservative, Base and Optimistic, till 2030 (USD Million)
- Table 20.119 Oligonucleotide Manufacturing Market for Ophthalmic Disorders, Conservative, Base and Optimistic, 2021till 2030 (USD Million)
- Table 20.120 Oligonucleotide Manufacturing Market for Other Disorders, Conservative, Base and Optimistic, till 2030 (USD Million)
- Table 20.121 Oligonucleotide Manufacturing Market for Small Companies, Conservative, Base and Optimistic, till 2030 (USD Million)
- Table 20.122 Oligonucleotide Manufacturing Market for Mid-sized Companies, Conservative, Base and Optimistic, till 2030 (USD Million)
- Table 20.123 Oligonucleotide Manufacturing Market for Large and Very Large Companies, Conservative, Base and Optimistic, till 2030 (USD Million)
- Table 20.124 Oligonucleotide Manufacturing Market: Distribution by Geography, 2021 and 2030 (USD Million)
- Table 20.125 Oligonucleotide Manufacturing Market in North America, Conservative, Base and Optimistic, till 2030 (USD Million)
- Table 20.126 Oligonucleotide Manufacturing Market in Europe, Conservative, Base and Optimistic, till 2030 (USD Million)
- Table 20.127 Oligonucleotide Manufacturing Market in Asia-Pacific and Rest of the World, Conservative, Base and Optimistic, till 2030 (USD Million)
- Table 24.128 Survey Insights: Distribution by Type of Organization
- Table 24.129 Survey Insights: Distribution by Location of Organization
- Table 24.130 Survey Insights: Distribution by Seniority Level of Respondents
- Table 24.131 Survey Insights: Distribution by Type of Offering
- Table 24.132 Survey Insights: Distribution by Application
- Table 24.133 Survey Insights: Distribution by Location of Manufacturing Facilities
- Table 24.134 Survey Insights: Distribution by Extent of Outsourcing
- Table 24.135 Survey Insights: Distribution by Current Market Opportunity
 2025-2033 年日本寡核苷酸合成市場報告(按產品、應用(PCR 引子、PCR 測定和麵板、定序、DNA 微陣列、螢光原位雜合技術、反義寡核苷酸等)、最終用途和區域)
 寡核苷酸合成市場:按產品類型、應用和最終用戶分類 - 全球預測 2025-2030
 全球寡核苷酸合成市場 - 2024 - 2031
 寡核苷酸合成市場規模、佔有率、成長分析、按產品、按應用、按最終用戶、按地區 - 產業預測,2024-2031
 2024-2032 年按產品、應用(PCR 引子、PCR 測定和麵板、定序、DNA 微陣列、螢光原位雜合技術、反義寡核苷酸等)、最終用途和區域分類的寡核苷酸合成市場報告
 全球寡核苷酸合成市場研究報告 - 2024 年至 2032 年產業分析、規模、佔有率、成長、趨勢與預測
 全球寡核甘酸合成市場評估:依產品、類型、應用、最終用戶、地區、機會、預測(2017-2031)
 美國寡核苷酸合成市場規模、佔有率、趨勢分析報告:按產品/服務、按應用、按最終用途、細分市場預測,2024-2030
 寡核甘酸合成市場:各寡核?酸長度,各用途,各類別,各類型,各產品,各地區預測 - 附執行指南(2024年~2028年)
 寡核苷酸合成市場、佔有率、規模、趨勢、產業分析報告:依產品、應用、地區、細分市場預測,2024-2032