


 |
市場調查報告書
商品編碼
1677740
營養補充品產品測試市場:產業趨勢與2035年全球預測 - 依服務類型、依營養補充品產品類型、依成分類型、依最終用戶、依主要地區、依主要公司Nutraceutical Product Testing Market: Industry Trends and Global Forecasts, Till 2035: Distribution by Type of Service Offered, Type of Nutraceutical Product, Type of Ingredient, End Users, Key Geographical Regions and Leading Players |
||||||
全球營養補充品產品測試市場規模預計將從目前的29.3億美元成長到2035年的73.3億美元,預測期內的年複合成長率為 9.6%。
過去幾年中,全球診斷出患有至少一種慢性病的人數顯著增加。根據美國國家衛生統計中心的資料,到2024年,光是在美國就會有近200萬例癌症病例和近 60萬例癌症死亡病例。慢性病發生率的不斷上升凸顯了有效預防策略的迫切需求。營養補充品是一種特殊的食品成分,除了提供基本營養成分外,還透過提供健康益處發揮重要作用。此外,營養補充品富含具有藥用特性的生物活性化合物,可顯著增強營養成分。
據調查,約有40%的人使用營養補充品來改善健康和滿足日常營養需求。由於這些補充劑被世界上相當大比例的人口所消費,因此確保這些產品不受污染並能提供所需的治療效果非常重要。因此,在使用之前,必須按照適當的安全協議對營養補充品進行嚴格的測試。這個過程包括驗證成分身份和純度、評估產品中的污染物、遵守監管標準、用科學證據證實健康聲明、防止摻雜以及支持研發計劃等各個方面。透過實施嚴格的測試,利害關係人可以向消費者提供適當的營養補充品,同時保持遵守行業法規,增強市場信心。因此,營養補充品測試因在醫療保健行業中發揮的革命性作用而贏得了巨大的聲譽。
本報告研究了全球營養補充品產品測試市場,並提供了市場概述以及市場詳細資訊,包括服務類型、營養補充品產品類型、成分類型、最終用戶、關鍵地區、主要公司的趨勢以及參與市場的公司概況。
目錄
第一部分:報告概述
第1章 簡介
第2章 研究方法
第3章 市場動態
第4章 宏觀經濟指標
第二部分:定性洞察
第5章 執行摘要
第6章 簡介
第三部分:市場概覽
第7章 市場狀況
第8章 企業競爭力分析
第9章 創業生態系分析
第四部分:公司簡介
第10章 公司簡介:北美營養補充品產品測試服務提供者
- 章節概述
- Charles River Laboratories
- Beaconpoint Labs
- Certified Laboratories
- Dyad Labs
- Thermo Fisher Scientific
第11章 公司簡介:歐洲營養補充品產品測試服務提供者
- 章節概述
- Element Materials Technology
- Eurofins Scientific
- Merieux NutriSciences
- RSSL
- SGS
第12章 公司簡介:亞太地區膳食補充品產品測試服務提供者
- 章節概述
- Auriga Research
- Doctors'Analytical Laboratories
- FARE Labs
- Sigma Test and Research Center
- SIMA LABS
- Vimta Labs
第五部分:市場趨勢
第13章 近期趨勢
- 章節概述
- 夥伴關係與協作
- 資金和投資
第14章 案例研究:營養補充品合約製造商
第六部分:市場機會分析
第15章 市場影響分析:驅動因素、限制因素、機會與挑戰
第16章 全球營養補充品產品評論服務市場
第17章 營養補充品產品測試服務市場(依提供的服務類型)
第18章 營養補充品產品測試服務市場(依營養補充品產品類型)
第19章 營養補充品產品測試服務市場(依成分類型)
第20章 營養補充品產品測試服務市場(依最終用戶)
第21章 膳食補充品產品測試服務市場(依主要區域)
第22章 營養補充品產品測試服務市場(依主要企業)
第23章 鄰近市場分析
第七部分:策略工具
第24章 波特五力分析
第25章 供應商選擇架構
第八部分:其他獨家見解
第26章 結論
第27章 高層洞察
第28章 附錄1:表格資料
第29章 附錄2:公司與組織名單
NUTRACEUTICAL PRODUCT TESTING MARKET
As per Roots Analysis, the global nutraceutical product testing market size is estimated to grow from USD 2.93 billion in current year to USD 7.33 billion by 2035, at a CAGR of 9.6% during the forecast period, till 2035.
The opportunity for nutraceutical product testing market has been distributed across the following segments:
Type of Service Offered
- Analytical Testing
- Microbiological Testing
- Stability Testing
- Other Services
Type of Nutraceutical Product
- Dietary Supplements
- Functional Foods
- Functional Beverages
- Other Nutraceutical Products
Type of Ingredient
- Vitamins
- Herbals
- Probiotics
- Minerals
- Enzymes
- Amino Acids
End Users
- Nutraceutical Developers
- Contract Manufacturers
- Regulatory Bodies and Other End Users
Key Geographical Regions
- North America (US, Canada)
- Europe (Germany, France, Switzerland, Luxembourg, UK, Rest of Europe)
- Asia-Pacific (China, India)
Leading Players
NUTRACEUTICAL PRODUCT TESTING MARKET: GROWTH AND TRENDS
Over the past few years, there has been a substantial increase in the number of patients diagnosed with at least one chronic disease across the globe. According to the National Center for Health Statistics, in 2024, nearly 2 million cases of cancer and nearly 0.6 million deaths have been reported due to cancer, in the US alone. The rising prevalence of chronic conditions underscores the urgent need for effective prevention strategies. Nutraceuticals are a specialized class of food components that play a crucial role by providing health benefits that extend beyond their fundamental nutritional content. Additionally, they are rich in bioactive compounds with medicinal effects, significantly enhancing nutritional composition.
According to a survey, around 40% of individuals use dietary supplements in order to enhance their health and meet their daily nutritional requirements. As these supplements are consumed by a considerable proportion of the global population, it is important to ensure that these products are free from contamination and provide desirable therapeutic effects. Therefore, it is essential that nutraceuticals undergo rigorous testing prior to use, adhering to proper safety protocols. This process encompasses various aspects, including verifying the identity and purity of ingredients, assessing products for contaminants, complying with regulatory standards, substantiating health claims through scientific evidence, preventing adulteration, and supporting research and development initiatives. By conducting rigorous testing, stakeholders can provide consumers with adequate nutraceuticals while maintaining compliance with industry regulations and fostering trust in the market. Consequently, nutraceutical testing has garnered significant recognition for its role in revolutionizing the healthcare industry.
Driven by the growing consumer preference for natural health solutions and stringent regulatory guidelines to ensure the safety, efficacy, and high quality of nutraceuticals, the demand for their testing is increasing at a steady pace. Moreover, owing to the ongoing technological advancements, the application of nutraceutical testing is anticipated to expand further, positioning the market for healthy growth in the forthcoming years.
NUTRACEUTICAL PRODUCT TESTING MARKET: KEY INSIGHTS
The report delves into the current state of the nutraceutical product testing market and identifies potential growth opportunities within industry. Some key findings from the report include:
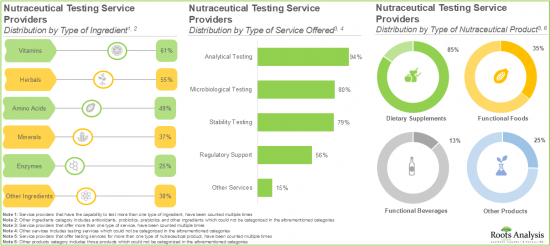
- Close to 55% of the companies engaged in offering nutraceutical testing services are small firms; 80% of the firms are based in North America.
- Around 95% of the service providers offer analytical testing services for nutraceuticals; of these, 80% of the service providers offer testing services for dietary supplements.
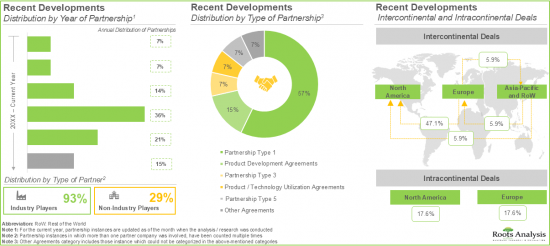
- The rising interest in this domain is reflected by the rise in partnership activity; notably, more than 70% of the deals were inked in the last three years.
- The increasing geriatric population, heightened consumer awareness and technological advancements are likely to drive the market for nutraceutical testing services, leading to steady growth in the foreseeable future.
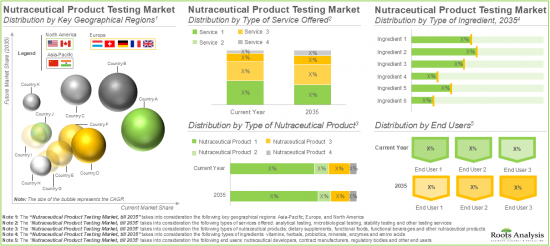
- The nutraceutical product testing market is anticipated to grow at an annualized rate (CAGR) of 9.6% till 2035; dietary supplements segment is expected to capture the majority share (close to 60%) of the market.
- Within North America, the nutraceutical product testing market is likely to witness an annualized growth rate of 10.0% over the coming decade.
NUTRACEUTICAL PRODUCT TESTING MARKET: KEY SEGMENTS
Analytical Testing Segment is Likely to Hold the Largest Share of the Nutraceutical Product Testing Market During the Forecast Period
Based on the type of service offered, the global nutraceutical product testing market is segmented into analytical testing, microbiological testing, stability testing and other services. Currently, the majority share of the nutraceutical product testing market is captured by analytical testing segment.
Functional Foods is the Fastest Growing Segment of the Nutraceutical Product Testing Market
Based on the type of nutraceutical product, the global nutraceutical product testing market is distributed across dietary supplements, functional foods, functional beverages and other nutraceutical products. Currently, the majority share of the nutraceutical product testing market is captured by dietary supplements segment. It is worth mentioning that the functional foods segment is likely to grow at a higher CAGR in the coming years.
Vitamins Segment is Likely to Dominate the Nutraceutical Product Testing Market During the Forecast Period
Based on the type of ingredient, the global nutraceutical product testing market is segmented into vitamins, herbals, probiotics, minerals, enzymes and amino acids. Currently, the market is likely to be dominated by vitamins segment. This can be attributed to the growing demand for preventive healthcare and simpler testing procedures for vitamin levels as compared to other nutraceuticals.
By End Users, Nutraceutical Developers Segment is Likely to Dominate the Market During the Forecast Period
Based on the end users, the global market for nutraceutical product testing is distributed across nutraceutical developers, contract manufacturers, and regulatory bodies and other end users. Currently, the nutraceutical developers' segment is likely to dominate and drive overall market growth. This can be attributed to the increasing demand for testing services to ensure the quality, safety, and effectiveness of nutraceutical products.
North America Accounts for the Largest Share of the Market
Based on key geographical regions, the market is segmented into North America, Europe, Asia-Pacific. In the current scenario, North America is likely to capture the majority of the market share. Notably, Asia-Pacific is expected to grow at a relatively higher CAGR during the forecast period. This can be attributed to the rising aging population, increased health and wellness awareness and high demand for dietary supplements in this region.
Example Players in the Nutraceutical Product Testing Market
- Auriga Research
- Beaconpoint Labs
- Certified Laboratories
- Charles River Laboratories
- Doctors Analytical Laboratories
- Dyad Labs
- Element Materials Technology
- Eurofins Scientific
- FARE Labs
- Merieux NutriSciences
- RSSL
- SGS
- Sigma Test and Research Center
- SIMA LABS
- Thermo Fisher Scientific
- Vimta Labs
Primary Research Overview
The opinions and insights presented in this study were influenced by discussions conducted with multiple stakeholders. The research report features detailed transcripts of interviews held with the following industry stakeholders:
- Chief Executive Officer, Small Company, US
- Chief Executive Officer, Small Company, US
- Head of Department, Academia, India
- Founder, Small Company, India
- Managing Director, Small Company, India
NUTRACEUTICAL PRODUCT TESTING MARKET: RESEARCH COVERAGE
The report on the nutraceutical product testing market features insights in various sections, including:
- Market Sizing and Opportunity Analysis: An in-depth analysis of the nutraceutical product testing market, focusing on key market segments, including [A] type of service offered, [B] type of nutraceutical product, [C] type of ingredient [D] end users, [E] key geographical regions and [F] leading players.
- Market Impact Analysis: A thorough analysis of various factors, such as drivers, restraints, opportunities, and existing challenges that are likely to impact market growth.
- Nutraceutical Testing Service Providers Market Landscape: A comprehensive evaluation of the companies engaged in offering nutraceutical testing services, based on several relevant parameters, such as [A] year of establishment, [B] company size, [C] location of headquarters, [D] regulatory accreditations, [E] type of ingredient, [F] type of service offered, [G] type of testing method used, and [H] type of nutraceutical product
- Company Competitiveness Analysis: An insightful competitiveness analysis of nutraceutical testing service providers based on several relevant parameters, such as [A] company strength and [B] service portfolio strength.
- Start-Up Ecosystem Analysis: In depth analysis of leading start-ups in the nutraceutical testing domain, based on various relevant parameters, including [A] company strength and [B] service portfolio strength, along with the benchmarking analysis and a heat map representation of the start-ups.
- Company Profiles: Elaborate profiles of prominent players providers engaged in offering nutraceutical testing services across various geographies, including North America, Europe and Asia-Pacific, providing details on [A] company overview, [B] financial information (if available), [C] nutraceutical service portfolio, [D] recent developments and [E] an informed future outlook.
- Recent Developments: An insightful analysis of recent developments in the nutraceutical testing services market, including details on partnerships inked between various stakeholders based on several parameters, such as [A] year of partnership, [B] type of partnership, [C] type of partner, [D] most active players, [E] geographical distribution of the partnerships. In addition, this section also includes various funding and investments undertaken by companies in this domain.
- Porter's Five Forces Analysis: An analysis of five competitive forces prevailing in the nutraceutical product testing market, including threats of new entrants, bargaining power of buyers, bargaining power of suppliers, threats of substitute products and rivalry among existing competitors.
- Vendor Selection Framework: An insightful vendor selection framework highlighting several factors that should be considered while outsourcing nutraceutical testing operations to service providers.
- Case Study: A detailed assessment of the nutraceutical contract manufacturers, featuring analysis on various parameters, such as [A] year of establishment, [B] company size, [C] location of headquarters, [D] number of manufacturing facilities, [E] type of product manufactured, [F] type of dietary supplement manufactured, [G] type of dosage form, [H] type of primary packaging, and [I] type of additional service offered.
KEY QUESTIONS ANSWERED IN THIS REPORT
- How many companies are currently engaged in this market?
- Which are the leading companies in this market?
- What factors are likely to influence the evolution of this market?
- What is the current and future market size?
- What is the CAGR of this market?
- How is the current and future market opportunity likely to be distributed across key market segments?
- What type of partnership models are commonly adopted by industry stakeholders?
REASONS TO BUY THIS REPORT
- The report provides a comprehensive market analysis, offering detailed revenue projections of the overall market and its specific sub-segments. This information is valuable to both established market leaders and emerging entrants.
- Stakeholders can leverage the report to gain a deeper understanding of the competitive dynamics within the market. By analyzing the competitive landscape, businesses can make informed decisions to optimize their market positioning and develop effective go-to-market strategies.
- The report offers stakeholders a comprehensive overview of the market, including key drivers, barriers, opportunities, and challenges. This information empowers stakeholders to stay abreast of market trends and make data-driven decisions to capitalize on growth prospects.
ADDITIONAL BENEFITS
- Complimentary PPT Insights Packs
- Complimentary Excel Data Packs for all Analytical Modules in the Report
- 10% Free Content Customization
- Detailed Report Walkthrough Session with Research Team
- Free Updated report if the report is 6-12 months old or older
TABLE OF CONTENTS
SECTION I: REPORT OVERVIEW
1. PREFACE
- 1.1. Introduction
- 1.2. Market Share Insights
- 1.3. Key Market Insights
- 1.4. Report Coverage
- 1.5. Key Questions Answered
- 1.6. Chapter Outlines
2. RESEARCH METHODOLOGY
- 2.1. Chapter Overview
- 2.2. Research Assumptions
- 2.2.1. Market Landscape and Market Trends
- 2.2.2. Market Forecast and Opportunity Analysis
- 2.2.3. Comparative Analysis
- 2.3. Database Building
- 2.3.1. Data Collection
- 2.3.2. Data Validation
- 2.3.3. Data Analysis
- 2.4. Project Methodology
- 2.4.1. Secondary Research
- 2.4.1.1. Annual Reports
- 2.4.1.2. Academic Research Papers
- 2.4.1.3. Company Websites
- 2.4.1.4. Investor Presentations
- 2.4.1.5. Regulatory Filings
- 2.4.1.6. White Papers
- 2.4.1.7. Industry Publications
- 2.4.1.8. Conferences and Seminars
- 2.4.1.9. Government Portals
- 2.4.1.10. Media and Press Releases
- 2.4.1.11. Newsletters
- 2.4.1.12. Industry Databases
- 2.4.1.13. Roots Proprietary Databases
- 2.4.1.14. Paid Databases and Sources
- 2.4.1.15. Social Media Portals
- 2.4.1.16. Other Secondary Sources
- 2.4.2. Primary Research
- 2.4.2.1. Types of Primary Research
- 2.4.2.1.1. Qualitative Research
- 2.4.2.1.2. Quantitative Research
- 2.4.2.1.3. Hybrid Approach
- 2.4.2.2. Advantages of Primary Research
- 2.4.2.3. Techniques for Primary Research
- 2.4.2.3.1. Interviews
- 2.4.2.3.2. Surveys
- 2.4.2.3.3. Focus Groups
- 2.4.2.3.4. Observational Research
- 2.4.2.3.5. Social Media Interactions
- 2.4.2.4. Key Opinion Leaders Considered in Primary Research
- 2.4.2.4.1. Company Executives (CXOs)
- 2.4.2.4.2. Board of Directors
- 2.4.2.4.3. Company Presidents and Vice Presidents
- 2.4.2.4.4. Research and Development Heads
- 2.4.2.4.5. Technical Experts
- 2.4.2.4.6. Subject Matter Experts
- 2.4.2.4.7. Scientists
- 2.4.2.4.8. Doctors and Other Healthcare Providers
- 2.4.2.5. Ethics and Integrity
- 2.4.2.5.1. Research Ethics
- 2.4.2.5.2. Data Integrity
- 2.4.2.1. Types of Primary Research
- 2.4.3. Analytical Tools and Databases
- 2.4.1. Secondary Research
- 2.5. Robust Quality Control
3. MARKET DYNAMICS
- 3.1. Chapter Overview
- 3.2. Forecast Methodology
- 3.2.1. Top-down Approach
- 3.2.2. Bottom-up Approach
- 3.2.3. Hybrid Approach
- 3.3. Market Assessment Framework
- 3.3.1. Total Addressable Market (TAM)
- 3.3.2. Serviceable Addressable Market (SAM)
- 3.3.3. Serviceable Obtainable Market (SOM)
- 3.3.4. Currently Acquired Market (CAM)
- 3.4. Forecasting Tools and Techniques
- 3.4.1. Qualitative Forecasting
- 3.4.2. Correlation
- 3.4.3. Regression
- 3.4.4. Extrapolation
- 3.4.5. Convergence
- 3.4.6. Sensitivity Analysis
- 3.4.7. Scenario Planning
- 3.4.8. Data Visualization
- 3.4.9. Time Series Analysis
- 3.4.10. Forecast Error Analysis
- 3.5. Key Considerations
- 3.5.1. Demographics
- 3.5.2. Government Regulations
- 3.5.3. Reimbursement Scenarios
- 3.5.4. Market Access
- 3.5.5. Supply Chain
- 3.5.6. Industry Consolidation
- 3.5.7. Pandemic / Unforeseen Disruptions Impact
- 3.6. Limitations
4. MACRO-ECONOMIC INDICATORS
- 4.1. Chapter Overview
- 4.2. Market Dynamics
- 4.2.1. Time Period
- 4.2.1.1. Historical Trends
- 4.2.1.2. Current and Forecasted Estimates
- 4.2.2. Currency Coverage
- 4.2.2.1. Major Currencies Affecting the Market
- 4.2.2.2. Factors Affecting Currency Fluctuations
- 4.2.2.3. Impact of Currency Fluctuations on the Industry
- 4.2.3. Foreign Currency Exchange Rate
- 4.2.3.1. Impact of Foreign Exchange Rate Volatility on the Market
- 4.2.3.2. Strategies for Mitigating Foreign Exchange Risk
- 4.2.4. Recession
- 4.2.4.1. Assessment of Current Economic Conditions and Potential Impact on the Market
- 4.2.4.2. Historical Analysis of Past Recessions and Lessons Learnt
- 4.2.5. Inflation
- 4.2.5.1. Measurement and Analysis of Inflationary Pressures in the Economy
- 4.2.5.2. Potential Impact of Inflation on the Market Evolution
- 4.2.6. Interest Rates
- 4.2.6.1. Interest Rates and Their Impact on the Market
- 4.2.6.2. Strategies for Managing Interest Rate Risk
- 4.2.7. Commodity Flow Analysis
- 4.2.7.1. Type of Commodity
- 4.2.7.2. Origins and Destinations
- 4.2.7.3. Values and Weights
- 4.2.7.4. Modes of Transportation
- 4.2.8. Global Trade Dynamics
- 4.2.8.1. Import Scenario
- 4.2.8.2. Export Scenario
- 4.2.8.3. Trade Policies
- 4.2.8.4. Strategies for Mitigating the Risks Associated with Trade Barriers
- 4.2.8.5. Impact of Trade Barriers on the Market
- 4.2.9. War Impact Analysis
- 4.2.9.1. Russian-Ukraine War
- 4.2.9.2. Israel-Hamas War
- 4.2.10. COVID Impact / Related Factors
- 4.2.10.1. Global Economic Impact
- 4.2.10.2. Industry-specific Impact
- 4.2.10.3. Government Response and Stimulus Measures
- 4.2.10.4. Future Outlook and Adaptation Strategies
- 4.2.11. Other Indicators
- 4.2.11.1. Fiscal Policy
- 4.2.11.2. Consumer Spending
- 4.2.11.3. Gross Domestic Product
- 4.2.11.4. Employment
- 4.2.11.5. Taxes
- 4.2.11.6. Stock Market Performance
- 4.2.11.7. Cross Border Dynamics
- 4.2.1. Time Period
- 4.3. Conclusion
SECTION II: QUALITATIVE INSIGHTS
5. EXECUTIVE SUMMARY
6. INTRODUCTION
- 6.1. Chapter Overview
- 6.2. What are Nutraceuticals
- 6.3. Potential Benefits of Nutraceuticals
- 6.4. Classification of Nutraceuticals
- 6.5. Nutraceuticals Testing Process
- 6.6. Regulatory Guidelines Related to Nutraceutical Testing
- 6.7. Importance of Nutraceutical Testing
- 6.8. Future Perspectives
SECTION III: MARKET OVERVIEW
7. MARKET LANDSCAPE
- 7.1. Chapter Overview
- 7.2. Nutraceutical Testing Service Providers: Overall Market Landscape
- 7.2.1. Analysis by Year of Establishment
- 7.2.2. Analysis by Company Size
- 7.2.3. Analysis by Location of Headquarters
- 7.2.4. Analysis by Company Size and Location of Headquarters
- 7.2.5. Analysis by Regulatory Accreditations
- 7.2.6. Analysis by Type of Ingredient
- 7.2.7. Analysis by Type of Service Offered
- 7.2.8. Analysis by Type of Testing Method Used
- 7.2.9. Analysis by Type of Nutraceutical Products
8. COMPANY COMPETITIVENESS ANALYSIS
- 8.1. Chapter Overview
- 8.2. Assumptions and Key Parameters
- 8.3. Methodology
- 8.4. Nutraceutical Testing Service Providers: Company Competitiveness Analysis
- 8.4.1. Nutraceutical Testing Service Providers based in North America
- 8.4.2. Nutraceutical Testing Service Providers based in Europe
- 8.4.3. Nutraceutical Testing Service Providers based in Asia-Pacific
9. START-UP ECOSYSTEM ANALYSIS
- 9.1. Chapter Overview
- 9.2. Assumptions and Key Parameters
- 9.3. Methodology
- 9.4. Nutraceutical Testing Service Providers: Start-up Ecosystem Analysis
- 9.4.1. Competitiveness Analysis of Start-ups in the Nutraceutical Testing Services Industry
- 9.4.2. Competitive Benchmarking of Start-ups in the Nutraceutical Testing Services Industry
- 9.5. Heat Map Representation of Start-ups
SECTION IV: COMPANY PROFILES
10. COMPANY PROFILES: NUTRACEUTICAL TESTING SERVICE PROVIDERS IN NORTH AMERICA
- 10.1. Chapter Overview
- 10.2. Charles River Laboratories
- 10.2.1. Company Overview
- 10.2.2. Financial Information
- 10.2.3. Nutraceutical Testing Service Portfolio
- 10.2.4. Recent Developments and Future Outlook
- 10.3. Beaconpoint Labs
- 10.4. Certified Laboratories
- 10.5. Dyad Labs
- 10.6. Thermo Fisher Scientific
11. COMPANY PROFILES: NUTRACEUTICAL TESTING SERVICE PROVIDERS IN EUROPE
- 11.1. Chapter Overview
- 11.2. Element Materials Technology
- 11.2.1. Company Overview
- 11.2.2. Financial Information
- 11.2.3.Nutraceutical Testing Service Portfolio
- 11.2.4. Recent Developments and Future Outlook
- 11.3. Eurofins Scientific
- 11.4. Merieux NutriSciences
- 11.5. RSSL
- 11.6. SGS
12. COMPANY PROFILES: NUTRACEUTICAL TESTING SERVICE PROVIDERS IN ASIA-PACIFIC
- 12.1. Chapter Overview
- 12.2. Auriga Research
- 12.2.1. Company Overview
- 12.2.2. Financial Information
- 12.2.3. Nutraceutical Testing Service Portfolio
- 12.2.4. Recent Developments and Future Outlook
- 12.3. Doctors' Analytical Laboratories
- 12.4. FARE Labs
- 12.5. Sigma Test and Research Center
- 12.6. SIMA LABS
- 12.7. Vimta Labs
SECTION V: MARKET TRENDS
13. RECENT DEVELOPMENTS
- 13.1. Chapter Overview
- 13.2. Partnerships and Collaborations
- 13.2.1. Partnership Models
- 13.2.3. Nutraceutical Testing Service Providers: Partnerships and Collaborations
- 13.3.1. Analysis by Year of Partnership
- 13.3.2. Analysis by Type of Partnership
- 13.3.3. Analysis by Year and Type of Partnership
- 13.3.4. Analysis by Type of Partner
- 13.3.5. Most Active Players: Analysis by Number of Partnerships
- 13.3.6. Analysis by Geography
- 13.2.6.1. Local and International Agreements
- 13.2.6.2. Intracontinental and Intercontinental Agreements
- 13.3. Funding and Investments
- 13.3.1. Funding Models
- 13.3.2. Nutraceutical Testing Service Providers: Funding and Investments
14. CASE STUDY: NUTRACEUTICAL CONTRACT MANUFACTURERS
- 14.1. Chapter Overview
- 14.2. Nutraceutical Contract Manufacturers: Overall Market Landscape
- 14.2.1. Analysis by Year of Establishment
- 14.2.2. Analysis by Location of Headquarters
- 14.2.3. Analysis by Type of Product Manufactured
- 14.2.4. Analysis by Type of Dosage Form
- 14.2.5. Analysis by Type of Primary Packaging Offered
- 14.2.6. Analysis by Number of Manufacturing Facilities
SECTION VI: MARKET OPPORTUNITY ANALYSIS
15. MARKET IMPACT ANALYSIS: DRIVERS, RESTRAINTS, OPPORTUNITIES AND CHALLENGES
- 15.1. Chapter Overview
- 15.2. Market Drivers
- 15.3. Market Restraints
- 15.4. Market Opportunities
- 15.5. Market Challenges
- 15.6. Conclusion
16. GLOBAL NUTRACEUTICAL TESTING SERVICES MARKET
- 16.1. Chapter Overview
- 16.2. Key Assumptions and Methodology
- 16.3. Trends Disruption Impacting Market
- 16.3.1. Demand Side Trends
- 16.3.2. Supply Side Trends
- 16.4. Global Nutraceutical Testing Services Market, Historical Trends (Since 2019) and Forecasted Estimates (Till 2035)
- 16.4.1. Multivariate Scenario Analysis
- 16.4.1.1. Conservative Scenario
- 16.4.1.2. Optimistic Scenario
- 16.4.1. Multivariate Scenario Analysis
- 16.5. Investment Feasibility Index
- 16.6. Key Market Segmentations
17. NUTRACEUTICAL TESTING SERVICES MARKET, BY TYPE OF SERVICE OFFERED
- 17.1. Chapter Overview
- 17.2. Key Assumptions and Methodology
- 17.3. Revenue Shift Analysis
- 17.4. Nutraceutical Testing Services Market: Distribution by Type of Service Offered
- 17.4.1. Nutraceutical Testing Services Market for Analytical Testing, Historical Trends (Since 2019) and Forecasted Estimates (Till 2035)
- 17.4.2. Nutraceutical Testing Services Market for Microbiological Testing, Historical Trends (Since 2019) and Forecasted Estimates (Till 2035)
- 17.4.3. Nutraceutical Testing Services Market for Stability Testing, Historical Trends (Since 2019) and Forecasted Estimates (Till 2035)
- 17.4.4. Nutraceutical Testing Services Market for Other Services, Historical Trends (Since 2019) and Forecasted Estimates (Till 2035)
- 17.5. Data Triangulation and Validation
- 17.5.1. Secondary Sources
- 17.5.2. Primary Sources
- 17.5.3. Statistical Modeling
18. NUTRACEUTICAL TESTING SERVICES MARKET, BY TYPE OF NUTRACEUTICAL PRODUCT
- 18.1. Chapter Overview
- 18.2. Key Assumptions and Methodology
- 18.3. Revenue Shift Analysis
- 18.4. Nutraceutical Testing Services Market: Distribution by Type of Nutraceutical Product
- 18.4.1. Nutraceutical Testing Services Market for Dietary Supplements, Historical Trends (Since 2019) and Forecasted Estimates (Till 2035)
- 18.4.2. Nutraceutical Testing Services Market for Functional Foods, Historical Trends (Since 2019) and Forecasted Estimates (Till 2035)
- 18.4.3. Nutraceutical Testing Services Market for Functional Beverages, Historical Trends (Since 2019) and Forecasted Estimates (Till 2035)
- 18.4.4. Nutraceutical Testing Services Market for Other Nutraceutical Products, Historical Trends (Since 2019) and Forecasted Estimates (Till 2035)
- 18.5. Data Triangulation and Validation
- 18.5.1. Secondary Sources
- 18.5.2. Primary Sources
- 18.5.3. Statistical Modeling
19. DIETARY SUPPLEMENT TESTING SERVICES MARKET, BY TYPE OF INGREDIENT
- 19.1. Chapter Overview
- 19.2. Key Assumptions and Methodology
- 19.3. Revenue Shift Analysis
- 19.4. Dietary Supplement Testing Services Market: Distribution by Type of Ingredient
- 19.4.1. Dietary Supplement Testing Services Market for Vitamins, Historical Trends (Since 2019) and Forecasted Estimates (Till 2035)
- 19.4.2. Dietary Supplement Testing Services Market for Herbals, Historical Trends (Since 2019) and Forecasted Estimates (Till 2035)
- 19.4.3. Dietary Supplement Testing Services Market for Probiotics, Historical Trends (Since 2019) and Forecasted Estimates (Till 2035)
- 19.4.4. Dietary Supplement Testing Services Market for Minerals, Historical Trends (Since 2019) and Forecasted Estimates (Till 2035)
- 19.4.5. Dietary Supplement Testing Services Market for Enzymes, Historical Trends (Since 2019) and Forecasted Estimates (Till 2035)
- 19.4.6. Dietary Supplement Testing Services Market for Amino Acids, Historical Trends (Since 2019) and Forecasted Estimates (Till 2035)
- 19.5. Data Triangulation and Validation
- 19.5.1. Secondary Sources
- 19.5.2. Primary Sources
- 19.5.3. Statistical Modeling
20. NUTRACEUTICAL TESTING SERVICES MARKET, BY END USERS
- 20.1. Chapter Overview
- 20.2. Key Assumptions and Methodology
- 20.3. Revenue Shift Analysis
- 20.4. Nutraceutical Testing Services Market: Distribution by End users
- 20.4.1. Nutraceutical Testing Services Market for Nutraceutical Developers, Historical Trends (Since 2019) and Forecasted Estimates (Till 2035)
- 20.4.2. Nutraceutical Testing Services Market for Contract Manufacturers, Historical Trends (Since 2019) and Forecasted Estimates (Till 2035)
- 20.4.3. Nutraceutical Testing Services Market for Regulatory Bodies and Other End users, Historical Trends (Since 2019) and Forecasted Estimates (Till 2035)
- 20.5. Data Triangulation and Validation
- 20.5.1. Secondary Sources
- 20.5.2. Primary Sources
- 20.5.3. Statistical Modeling
21. NUTRACEUTICAL TESTING SERVICES MARKET, BY KEY GEOGRAPHICAL REGIONS
- 21.1. Chapter Overview
- 21.2. Key Assumptions and Methodology
- 21.3. Revenue Shift Analysis
- 21.4. Market Movement Analysis
- 21.5. Penetration-Growth (P-G) Matrix
- 21.6. Nutraceutical Testing Services Market: Distribution by Key Geographical Regions
- 21.6.1. Nutraceutical Testing Services Market in North America, Historical Trends (Since 2019) and Forecasted Estimates (Till 2035)
- 21.6.1.1. Nutraceutical Testing Services Market in the US, Historical Trends (Since 2019) and Forecasted Estimates (Till 2035)
- 21.6.1.2. Nutraceutical Testing Services Market in Canada, Historical Trends (Since 2019) and Forecasted Estimates (Till 2035)
- 21.6.1.3. Nutraceutical Testing Services Market in Rest of North America, Historical Trends (Since 2019) and Forecasted Estimates (Till 2035)
- 21.6.2. Nutraceutical Testing Services Market in Europe, till 2035
- 21.6.2.1. Nutraceutical Testing Services Market in France, Historical Trends (Since 2019) and Forecasted Estimates (Till 2035)
- 21.6.2.2. Nutraceutical Testing Services Market in Germany, Historical Trends (Since 2019) and Forecasted Estimates (Till 2035)
- 21.6.2.3. Nutraceutical Testing Services Market in the UK, Historical Trends (Since 2019) and Forecasted Estimates (Till 2035)
- 21.6.2.4. Nutraceutical Testing Services Market in Switzerland, Historical Trends (Since 2019) and Forecasted Estimates (Till 2035)
- 21.6.2.5. Nutraceutical Testing Services Market in Luxembourg, Historical Trends (Since 2019) and Forecasted Estimates (Till 2035)
- 21.6.2.6. Nutraceutical Testing Services Market in Rest of Europe, Historical Trends (Since 2019) and Forecasted Estimates (Till 2035)
- 21.6.3. Nutraceutical Testing Services Market in Asia-Pacific, Historical Trends (Since 2019) and Forecasted Estimates (Till 2035)
- 21.6.3.1. Nutraceutical Testing Services Market in India, Historical Trends (Since 2019) and Forecasted Estimates (Till 2035)
- 21.6.3.2. Nutraceutical Testing Services Market in China, Historical Trends (Since 2019) and Forecasted Estimates (Till 2035)
- 21.6.1. Nutraceutical Testing Services Market in North America, Historical Trends (Since 2019) and Forecasted Estimates (Till 2035)
- 21.7. Data Triangulation and Validation
- 21.7.1. Secondary Sources
- 21.7.2. Primary Sources
- 21.7.3. Statistical Modeling
22. NUTRACEUTICAL TESTING SERVICES MARKET, BY LEADING PLAYERS
- 22.1. Chapter Overview
- 22.2. Key Assumptions and Methodology
- 22.3. Market Concentration Analysis: Distribution by Leading Nutraceutical Testing Service Providers
- 22.4. Data Triangulation and Validation
23. ADJACENT MARKET ANALYSIS
SECTION VII: STRATEGIC TOOLS
24. PORTER'S FIVE FORCES ANALYSIS
- 24.1. Chapter Overview
- 24.2. Methodology and Assumptions
- 24.3. Key Parameters
- 24.3.1. Threats of New Entrants
- 24.3.2. Bargaining Power of Buyers
- 24.3.3. Bargaining Power of Service Providers
- 24.3.4. Threats of Substitute Products
- 24.3.5. Rivalry Among Existing Competitors
- 24.4. Concluding Remarks
25. VENDOR SELECTION FRAMEWORK
- 25.1. Chapter Overview
- 25.2. Reasons for Outsourcing Nutraceuticals Testing
- 25.3. Commonly Outsourced Operations in Nutraceutical Testing
- 25.4. Methodology
- 25.5. Nutraceutical Key Parameters
- 25.6. Benchmarking of Parameters
- 25.7. Value Addition vs Evaluation Complexity Matrix
- 25.8. Case Study Assessment of Leading Players
- 25.8.1. Case Study Assessment of Eurofins Scientific
- 25.8.2. Case Study Assessment of Charles River Laboratories
- 25.8.3. Case Study Assessment of SGS
- 25.9. Overview of Vendor Assessment Dashboard
- 25.9.1. Vendor Selection Framework: Dashboard (Scenario I)
- 25.9.2. Vendor Selection Framework: Dashboard (Scenario II)
- 25.9.3. Vendor Selection Framework: Dashboard (Scenario III)
- 25.10. Concluding Remarks
SECTION VIII: OTHER EXCLUSIVE INSIGHTS
26. CONCLUDING REMARKS
27. EXECUTIVE INSIGHTS
28. APPENDIX 1: TABULATED DATA
29. APPENDIX 2: LIST OF COMPANIES AND ORGANIZATIONS
List of Tables
- Table 7.1 Nutraceutical Testing Service Providers: Information on Year of Establishment, Company Size and Location of Headquarters
- Table 7.2 Nutraceutical Testing Service Providers: Information on Regulatory Accreditations, Type of Ingredient and Type of Service Offered
- Table 7.3 Nutraceutical Testing Service Providers: Information on Type of Testing Method Used and Type of Nutraceutical Products
- Table 10.1 Nutraceutical Testing Service Providers in North America: List of Companies Profiled
- Table 10.2 Beaconpoint Labs: Company Overview
- Table 10.3 Beaconpoint Labs: Nutraceutical Testing Service Portfolio
- Table 10.4 Certified Laboratories: Company Overview
- Table 10.5 Certified Laboratories: Nutraceutical Testing Service Portfolio
- Table 10.6 Certified Laboratories: Recent Developments and Future Outlook
- Table 10.7 Charles River Laboratories: Company Overview
- Table 10.8 Charles River Laboratories: Nutraceutical Testing Service Portfolio
- Table 10.9 Charles River Laboratories: Recent Developments and Future Outlook
- Table 10.10 Dyad Labs: Company Overview
- Table 10.11 Dyad Labs: Nutraceutical Testing Service Portfolio
- Table 10.12 Thermo Fisher Scientific: Company Overview
- Table 10.13 Thermo Fisher Scientific: Nutraceutical Testing Service Portfolio
- Table 11.1 Nutraceutical Testing Service Providers in Europe: List of Companies Profiled
- Table 11.2 Element Materials Technology: Company Overview
- Table 11.3 Element Materials Technology: Nutraceutical Testing Service Portfolio
- Table 11.4 Eurofins Scientific: Company Overview
- Table 11.5 Eurofins Scientific: Nutraceutical Testing Service Portfolio
- Table 11.6 Eurofins Scientific: Recent Developments and Future Outlook
- Table 11.7 Merieux NutriSciences: Company Overview
- Table 11.8 Merieux NutriSciences: Nutraceutical Testing Service Portfolio
- Table 11.9 RSSL: Company Overview
- Table 11.10 RSSL: Nutraceutical Testing Service Portfolio
- Table 11.11 SGS: Company Overview
- Table 11.12 SGS: Nutraceutical Testing Service Portfolio
- Table 11.13 SGS: Recent Developments and Future Outlook
- Table 12.1 Nutraceutical Testing Service Providers in Asia-Pacific: List of Companies Profiled
- Table 12.2 Auriga Research: Company Overview
- Table 12.3 Auriga Research: Nutraceutical Testing Service Portfolio
- Table 12.4 Doctors Analytical Laboratories: Company Overview
- Table 12.5 Doctors Analytical Laboratories: Nutraceutical Testing Service Portfolio
- Table 12.6 FARE Labs: Company Overview
- Table 12.7 FARE Labs: Nutraceutical Testing Service Portfolio
- Table 12.8 Sigma Test and Research Center: Company Overview
- Table 12.9 Sigma Test and Research Center: Nutraceutical Testing Service Portfolio
- Table 12.10 SIMA LABS: Company Overview
- Table 12.11 SIMA LABS: Nutraceutical Testing Service Portfolio
- Table 12.12 Vimta Labs: Company Overview
- Table 12.13 Vimta Labs: Nutraceutical Testing Service Portfolio
- Table 13.1 Nutraceutical Testing Service Providers: List of Partnerships and Collaborations
- Table 13.2 Nutraceutical Testing Service Providers: List of Funding and Investments
- Table 14.1 Nutraceutical Contract Manufacturers: Information on Year of Establishment, Company Size and Location of Headquarters
- Table 25.1 Vendor Selection Framework: Nutraceutical Key Parameters
- Table 25.2 Vendor Selection Framework: Benchmarking of Parameters
- Table 25.3 Vendor Selection Framework: Value Addition vs Evaluation Complexity Matrix
- Table 25.4 Vendor Selection Framework: Case Study Assessment of Eurofins Scientific
- Table 25.5 Vendor Selection Framework: Case Study Assessment of Charles River Laboratories
- Table 25.6 Vendor Selection Framework: Case Study Assessment of SGS
- Table 25.7 Vendor Selection Framework: Dashboard (Scenario I)
- Table 25.8 Vendor Selection Framework: Dashboard (Scenario II)
- Table 25.9 Vendor Selection Framework: Dashboard (Scenario III)
- Table 27.1 Planta Analytica: Company Overview
- Table 27.2 Scientech Laboratories: Company Overview
- Table 27.3 Chitkara University: University Overview
- Table 27.4 Shelmak Lifesciences: Company Overview
- Table 27.5 Glorient Bioceuticals: Company Overview
- Table 28.1 Nutraceutical Testing Service Providers: Distribution by Year of Establishment
- Table 28.2 Nutraceutical Testing Service Providers: Distribution by Company Size
- Table 28.3 Nutraceutical Testing Service Providers: Distribution by Location of Headquarters
- Table 28.4 Nutraceutical Testing Service Providers: Distribution by Company Size and Location of Headquarters
- Table 28.5 Nutraceutical Testing Service Providers: Distribution by Regulatory Accreditations
- Table 28.6 Nutraceutical Testing Service Providers: Distribution by Type of Ingredient
- Table 28.7 Nutraceutical Testing Service Providers: Distribution by Type of Service Offered
- Table 28.8 Nutraceutical Testing Service Providers: Distribution by Type of Testing Method Used
- Table 28.9 Nutraceutical Testing Service Providers: Distribution by Type of Nutraceutical Products
- Table 28.10 Charles River Laboratories: Annual Revenues, FY 2021 onwards (USD Billion)
- Table 28.11 Thermo Fisher Scientific: Annual Revenues, FY 2021 onwards (USD Million)
- Table 28.12 Eurofins Scientific: Annual Revenues, FY 2021 onwards (EUR Billion)
- Table 28.13 SGS: Annual Revenues, FY 2021 onwards (CHF Million)
- Table 28.14 Vimta Labs: Annual Revenues, FY 2021 onwards (INR Million)
- Table 28.15 Partnerships and Collaborations: Distribution by Cumulative Year-wise Trend, 2019-2024
- Table 28.16 Partnerships and Collaborations: Distribution by Type of Partnership
- Table 28.17 Partnerships and Collaborations: Distribution by Year and Type of Partnership
- Table 28.18 Partnerships and Collaborations: Distribution by Type of Partner
- Table 28.19 Most Active Players: Distribution by Number of Partnership
- Table 28.20 Partnerships and Collaborations: Distribution by Local and International Deals
- Table 28.21 Partnerships and Collaborations: Distribution by Intercontinental and Intracontinental Deals
- Table 28.22 Nutraceutical Contract Manufacturers: Distribution by Year of Establishment
- Table 28.23 Nutraceutical Contract Manufacturers: Distribution by Location of Headquarters
- Table 28.24 Nutraceutical Contract Manufacturers: Distribution by Type of Product Manufactured
- Table 28.25 Nutraceutical Contract Manufacturers: Distribution by Type of Dosage Form
- Table 28.26 Nutraceutical Contract Manufacturers: Distribution by Type of Primary Packaging Offered
- Table 28.27 Nutraceutical Contract Manufacturers: Distribution by Number of Manufacturing Facilities
- Table 28.28 Global Nutraceutical Testing Services Market, Historical Trends (Since 2019) and Forecasted Estimates (Till 2035) (USD Billion)
- Table 28.29 Global Nutraceutical Testing Services Market, Forecasted Estimates (Till 2035): Conservative Scenario (USD Billion)
- Table 28.30 Global Nutraceutical Testing Services Market, Forecasted Estimates (Till 2035): Optimistic Scenario (USD Billion)
- Table 28.31 Nutraceutical Testing Services Market: Distribution by Type of Service Offered
- Table 28.32 Nutraceutical Testing Services Market for Analytical Testing, Historical Trends (Since 2019) and Forecasted Estimates (Till 2035), Conservative, Base and Optimistic Scenarios (USD Billion)
- Table 28.33 Nutraceutical Testing Services Market for Microbiological Testing, Historical Trends (Since 2019) and Forecasted Estimates (Till 2035), Conservative, Base and Optimistic Scenarios (USD Billion)
- Table 28.34 Nutraceutical Testing Services Market for Stability Testing, Historical Trends (Since 2019) and Forecasted Estimates (Till 2035), Conservative, Base and Optimistic Scenarios (USD Billion)
- Table 28.35 Nutraceutical Testing Services Market for Other Services, Historical Trends (Since 2019) and Forecasted Estimates (Till 2035), Conservative, Base and Optimistic Scenarios (USD Billion)
- Table 28.36 Nutraceutical Testing Services Market: Distribution by Type of Nutraceutical Product
- Table 28.37 Nutraceutical Testing Services Market for Dietary Supplements, Historical Trends (Since 2019) and Forecasted Estimates (Till 2035), Conservative, Base and Optimistic Scenarios (USD Billion)
- Table 28.38 Nutraceutical Testing Services Market for Functional Foods, Historical Trends (Since 2019) and Forecasted Estimates (Till 2035), Conservative, Base and Optimistic Scenarios (USD Billion)
- Table 28.39 Nutraceutical Testing Services Market for Functional Beverages, Historical Trends (Since 2019) and Forecasted Estimates (Till 2035), Conservative, Base and Optimistic Scenarios (USD Billion)
- Table 28.40 Nutraceutical Testing Services Market for Other Nutraceutical Products, Historical Trends (Since 2019) and Forecasted Estimates (Till 2035), Conservative, Base and Optimistic Scenarios (USD Billion)
- Table 28.41 Nutraceutical Testing Services Market: Distribution by Type of Ingredient
- Table 28.42 Dietary Supplements Testing Services Market for Vitamins, Historical Trends (Since 2019) and Forecasted Estimates (Till 2035), Conservative, Base and Optimistic Scenarios (USD Billion)
- Table 28.43 Dietary Supplements Testing Services Market for Herbals, Historical Trends (Since 2019) and Forecasted Estimates (Till 2035), Conservative, Base and Optimistic Scenarios (USD Billion)
- Table 28.44 Dietary Supplements Testing Services Market for Probiotics, Historical Trends (Since 2019) and Forecasted Estimates (Till 2035), Conservative, Base and Optimistic Scenarios (USD Billion)
- Table 28.45 Dietary Supplements Testing Services Market for Minerals, Historical Trends (Since 2019) and Forecasted Estimates (Till 2035), Conservative, Base and Optimistic Scenarios (USD Billion)
- Table 28.46 Dietary Supplements Testing Services Market for Enzymes, Historical Trends (Since 2019) and Forecasted Estimates (Till 2035), Conservative, Base and Optimistic Scenarios (USD Billion)
- Table 28.47 Dietary Supplements Testing Services Market for Amino Acids, Historical Trends (Since 2019) and Forecasted Estimates (Till 2035), Conservative, Base and Optimistic Scenarios (USD Billion)
- Table 28.48 Nutraceutical Testing Services Market: Distribution by End Users
- Table 28.49 Nutraceutical Testing Services Market for Nutraceutical Developers, Historical Trends (Since 2019) and Forecasted Estimates (Till 2035), Conservative, Base and Optimistic Scenarios (USD Billion)
- Table 28.50 Nutraceutical Testing Services Market for Contract Manufacturers, Historical Trends (Since 2019) and Forecasted Estimates (Till 2035), Conservative, Base and Optimistic Scenarios (USD Billion)
- Table 28.51 Nutraceutical Testing Services Market for Regulatory Bodies and Other End Users, Historical Trends (Since 2019) and Forecasted Estimates (Till 2035), Conservative, Base and Optimistic Scenarios (USD Billion)
- Table 28.52 Nutraceutical Testing Services Market: Distribution by Key Geographical Regions
- Table 28.53 Nutraceutical Testing Services Market in North America, Historical Trends (Since 2019) and Forecasted Estimates (Till 2035), Conservative, Base and Optimistic Scenarios (USD Billion)
- Table 28.54 Nutraceutical Testing Services Market in the US, Historical Trends (Since 2019) and Forecasted Estimates (Till 2035), Conservative, Base and Optimistic Scenarios (USD Billion)
- Table 28.55 Nutraceutical Testing Services Market in Canada, Historical Trends (Since 2019) and Forecasted Estimates (Till 2035), Conservative, Base and Optimistic Scenarios (USD Billion)
- Table 28.56 Nutraceutical Testing Services Market in Rest of North America, Historical Trends (Since 2019) and Forecasted Estimates (Till 2035), Conservative, Base and Optimistic Scenarios (USD Billion)
- Table 28.57 Nutraceutical Testing Services Market in Europe, Historical Trends (Since 2019) and Forecasted Estimates (Till 2035) (USD Billion), Conservative, Base and Optimistic Scenarios (USD Billion)
- Table 28.58 Nutraceutical Testing Services Market in France, Historical Trends (Since 2019) and Forecasted Estimates (Till 2035), Conservative, Base and Optimistic Scenarios (USD Billion)
- Table 28.59 Nutraceutical Testing Services Market in Germany, Historical Trends (Since 2019) and Forecasted Estimates (Till 2035), Conservative, Base and Optimistic Scenarios (USD Billion)
- Table 28.60 Nutraceutical Testing Services Market in the UK, Historical Trends (Since 2019) and Forecasted Estimates (Till 2035), Conservative, Base and Optimistic Scenarios (USD Billion)
- Table 28.61 Nutraceutical Testing Services Market in Switzerland, Historical Trends (Since 2019) and Forecasted Estimates (Till 2035), Conservative, Base and Optimistic Scenarios (USD Billion)
- Table 28.62 Nutraceutical Testing Services Market in Luxembourg, Historical Trends (Since 2019) and Forecasted Estimates (Till 2035), Conservative, Base and Optimistic Scenarios (USD Billion)
- Table 28.63 Nutraceutical Testing Services Market in Rest of Europe, Historical Trends (Since 2019) and Forecasted Estimates (Till 2035), Conservative, Base and Optimistic Scenarios (USD Billion)
- Table 28.64 Nutraceutical Testing Services Market in Asia-Pacific, Historical Trends (Since 2019) and Forecasted Estimates (Till 2035), Conservative, Base and Optimistic Scenarios (USD Billion)
- Table 28.65 Nutraceutical Testing Services Market in India, Historical Trends (Since 2019) and Forecasted Estimates (Till 2035), Conservative, Base and Optimistic Scenarios (USD Billion)
- Table 28.66 Nutraceutical Testing Services Market in China, Historical Trends (Since 2019) and Forecasted Estimates (Till 2035), Conservative, Base and Optimistic Scenarios (USD Billion)
- Table 28.67 Market Concentration Analysis: Distribution by Leading Nutraceutical Testing Service Providers
List of Figures
- Figure 2.1 Research Methodology: Project Methodology
- Figure 2.2 Research Methodology: Data Sources for Secondary Research
- Figure 2.3 Research Methodology: Robust Quality Control
- Figure 3.1 Market Dynamics: Forecast Methodology
- Figure 3.2 Market Dynamics: Market Assessment Framework
- Figure 4.1 Lessons Learnt from Past Recessions
- Figure 5.1 Executive Summary: Market Landscape
- Figure 5.2 Executive Summary: Recent Developments
- Figure 5.3 Executive Summary: Market Forecast and Opportunity Analysis
- Figure 6.1 Potential Benefits of Nutraceuticals
- Figure 6.2 Classification of Nutraceuticals
- Figure 6.3 Regulatory Guidelines Related to Nutraceutical Testing
- Figure 7.1 Nutraceutical Testing Service Providers: Distribution by Year of Establishment
- Figure 7.2 Nutraceutical Testing Service Providers: Distribution by Company Size
- Figure 7.3 Nutraceutical Testing Service Providers: Distribution by Location of Headquarters
- Figure 7.4 Nutraceutical Testing Service Providers: Distribution by Company Size and Location of Headquarters
- Figure 7.5 Nutraceutical Testing Service Providers: Distribution by Regulatory Accreditations
- Figure 7.6 Nutraceutical Testing Service Providers: Distribution by Type of Ingredient
- Figure 7.7 Nutraceutical Testing Service Providers: Distribution by Type of Service Offered
- Figure 7.8 Nutraceutical Testing Service Providers: Distribution by Type of Testing Method Used
- Figure 7.9 Nutraceutical Testing Service Providers: Distribution by Type of Nutraceutical Products
- Figure 8.1 Company Competitiveness Analysis: Nutraceutical Testing Service Providers Based in North America
- Figure 8.2 Company Competitiveness Analysis: Nutraceutical Testing Service Providers Based in Europe
- Figure 8.3 Company Competitiveness Analysis: Nutraceutical Testing Service Providers Based in Asia-Pacific
- Figure 9.1 Competitiveness Analysis of Start-ups in the Nutraceutical Testing Services Industry
- Figure 9.2 Benchmarking: Leading Start-ups in the Nutraceutical Testing Services Industry
- Figure 9.3 Heat Map Representation of Start-ups
- Figure 10.1 Charles River Laboratories: Annual Revenues, FY 2021 onwards (USD Million)
- Figure 10.2 Thermo Fisher Scientific: Annual Revenues, FY 2021 onwards (USD Million)
- Figure 11.1 Eurofins Scientific: Annual Revenues, FY 2021 onwards (EUR Billion)
- Figure 11.2 SGS: Annual Revenues, FY 2021 onwards (USD Million)
- Figure 12.1 Vimta Labs: Annual Revenues, FY 2021 onwards (INR Million)
- Figure 13.1 Partnerships and Collaborations: Cumulative Year-wise Trend, Since 2019
- Figure 13.2 Partnerships and Collaborations: Distribution by Type of Partnership
- Figure 13.3 Partnerships and Collaborations: Distribution by Year and Type of Partnership
- Figure 13.4 Partnerships and Collaborations: Distribution by Type of Partner
- Figure 13.5 Most Active Players: Distribution by Number of Partnerships
- Figure 13.6 Partnerships and Collaborations: Distribution by Local and International Deals
- Figure 13.7 Partnerships and Collaborations: Distribution by Intercontinental and Intracontinental Deals
- Figure 14.1 Nutraceutical Contract Manufacturers: Distribution by Year of Establishment
- Figure 14.2 Nutraceutical Contract Manufacturers: Distribution by Location of Headquarters
- Figure 14.3 Nutraceutical Contract Manufacturers: Distribution by Type of Product Manufactured
- Figure 14.4 Nutraceutical Contract Manufacturers: Distribution by Type of Dosage Form
- Figure 14.5 Nutraceutical Contract Manufacturers: Distribution by Type of Primary Packaging Offered
- Figure 14.6 Nutraceutical Contract Manufacturers: Distribution by Number of Manufacturing Facilities
- Figure 16.1 Global Nutraceutical Testing Services Market, Historical Trends (Since 2019) and Forecasted Estimates (Till 2035) (USD Billion)
- Figure 16.2 Global Nutraceutical Testing Services Market, Forecasted Estimates (Till 2035): Conservative Scenario (USD Billion)
- Figure 16.3 Global Nutraceutical Testing Services Market, Forecasted Estimates (Till 2035): Optimistic Scenario (USD Billion)
- Figure 17.1 Nutraceutical Testing Services Market: Distribution by Type of Service Offered
- Figure 17.2 Nutraceutical Testing Services Market for Analytical Testing, Historical Trends (Since 2019) and Forecasted Estimates (Till 2035) (USD Billion)
- Figure 17.3 Nutraceutical Testing Services Market for Microbiological Testing, Historical Trends (Since 2019) and Forecasted Estimates (Till 2035) (USD Billion)
- Figure 17.4 Nutraceutical Testing Services Market for Stability Testing, Historical Trends (Since 2019) and Forecasted Estimates (Till 2035) (USD Billion)
- Figure 17.5 Nutraceutical Testing Services Market for Other Services, Historical Trends (Since 2019) and Forecasted Estimates (Till 2035) (USD Billion)
- Figure 18.1 Nutraceutical Testing Services Market: Distribution by Type of Nutraceutical Product
- Figure 18.2 Nutraceutical Testing Services Market for Dietary Supplements, Historical Trends (Since 2019) and Forecasted Estimates (Till 2035) (USD Billion)
- Figure 18.3 Nutraceutical Testing Services Market for Functional Foods, Historical Trends (Since 2019) and Forecasted Estimates (Till 2035) (USD Billion)
- Figure 18.4 Nutraceutical Testing Services Market for Functional Beverages, Historical Trends (Since 2019) and Forecasted Estimates (Till 2035) (USD Billion)
- Figure 18.5 Nutraceutical Testing Services Market for Other Nutraceutical Products, Historical Trends (Since 2019) and Forecasted Estimates (Till 2035) (USD Billion)
- Figure 19.1 Nutraceutical Testing Services Market: Distribution by Type of Ingredient
- Figure 19.2 Nutraceutical Testing Services Market for Vitamins, Historical Trends (Since 2019) and Forecasted Estimates (Till 2035) (USD Billion)
- Figure 19.3 Nutraceutical Testing Services Market for Herbals, Historical Trends (Since 2019) and Forecasted Estimates (Till 2035) (USD Billion)
- Figure 19.4 Nutraceutical Testing Services Market for Probiotics, Historical Trends (Since 2019) and Forecasted Estimates (Till 2035) (USD Billion)
- Figure 19.5 Nutraceutical Testing Services Market for Minerals, Historical Trends (Since 2019) and Forecasted Estimates (Till 2035) (USD Billion)
- Figure 19.6 Nutraceutical Testing Services Market for Amino Acids, Historical Trends (Since 2019) and Forecasted Estimates (Till 2035) (USD Billion)
- Figure 19.7 Nutraceutical Testing Services Market for Enzymes, Historical Trends (Since 2019) and Forecasted Estimates (Till 2035) (USD Billion)
- Figure 20.1 Nutraceutical Testing Services Market: Distribution by End Users
- Figure 20.2 Nutraceutical Testing Services Market for Nutraceutical Developers, Historical Trends (Since 2019) and Forecasted Estimates (Till 2035) (USD Billion)
- Figure 20.2 Nutraceutical Testing Services Market for Contract Manufacturers, Historical Trends (Since 2019) and Forecasted Estimates (Till 2035) (USD Billion)
- Figure 20.4 Nutraceutical Testing Services Market for Regulatory Bodies and Other End Users, Historical Trends (Since 2019) and Forecasted Estimates (Till 2035) (USD Billion)
- Figure 21.1 Market Movement Analysis
- Figure 21.2 Penetration-Growth (P-G) Matrix
- Figure 21.3 Nutraceutical Testing Services Market: Distribution by Key Geographical Regions
- Figure 21.4 Nutraceutical Testing Services Market in North America, Historical Trends (Since 2019) and Forecasted Estimates (Till 2035) (USD Billion)
- Figure 21.5 Nutraceutical Testing Services Market in the US, Historical Trends (Since 2019) and Forecasted Estimates (Till 2035) (USD Billion)
- Figure 21.6 Nutraceutical Testing Services Market in Canada, Historical Trends (Since 2019) and Forecasted Estimates (Till 2035) (USD Billion)
- Figure 21.7 Nutraceutical Testing Services Market in Rest of North America, Historical Trends (Since 2019) and Forecasted Estimates (Till 2035) (USD Billion)
- Figure 21.8 Nutraceutical Testing Services Market in Europe, Historical Trends (Since 2019) and Forecasted Estimates (Till 2035) (USD Billion) (USD Billion)
- Figure 21.9 Nutraceutical Testing Services Market in France, Historical Trends (Since 2019) and Forecasted Estimates (Till 2035) (USD Billion)
- Figure 21.10 Nutraceutical Testing Services Market in Germany, Historical Trends (Since 2019) and Forecasted Estimates (Till 2035) (USD Billion)
- Figure 21.11 Nutraceutical Testing Services Market in the UK, Historical Trends (Since 2019) and Forecasted Estimates (Till 2035) (USD Billion)
- Figure 21.12 Nutraceutical Testing Services Market in Switzerland, Historical Trends (Since 2019) and Forecasted Estimates (Till 2035) (USD Billion)
- Figure 21.13 Nutraceutical Testing Services Market in Luxembourg, Historical Trends (Since 2019) and Forecasted Estimates (Till 2035) (USD Billion)
- Figure 21.14 Nutraceutical Testing Services Market in Rest of Europe, Historical Trends (Since 2019) and Forecasted Estimates (Till 2035) (USD Billion)
- Figure 21.15 Nutraceutical Testing Services Market in Asia-Pacific, Historical Trends (Since 2019) and Forecasted Estimates (Till 2035) (USD Billion)
- Figure 21.16 Nutraceutical Testing Services Market in India, Historical Trends (Since 2019) and Forecasted Estimates (Till 2035) (USD Billion)
- Figure 21.17 Nutraceutical Testing Services Market in China, Historical Trends (Since 2019) and Forecasted Estimates (Till 2035) (USD Billion)
- Figure 22.1 Market Concentration Analysis: Distribution by Leading Nutraceutical Testing Service Providers
- Figure 24.1 Porter's Five Forces
- Figure 24.2 Threats of New Entrants: Key Factors
- Figure 24.3 Bargaining Power of Buyers: Key Factors
- Figure 24.4 Bargaining Power of Service Providers: Key Factors
- Figure 24.5 Threats of Substitute Products: Key Factors
- Figure 24.6 Rivalry Among Existing Competitors: Key Factors
- Figure 24.7 Porter's Five Forces Analysis: Concluding Remarks
- Figure 25.1 Vendor Selection Framework: Comparison of Parameters
- Figure 26.1 Concluding Remarks: Market Landscape
- Figure 26.2 Concluding Remarks: Recent Developments
- Figure 26.3 Concluding Remarks: Market Forecast and Opportunity Analysis
 全球膳食補充劑添加劑市場規模(按功能組、形式、應用、最終產品、區域範圍和預測)
 營養化妝品成分市場機會、成長動力、產業趨勢分析及 2025 - 2034 年預測營養保健品市場按產品類型、形式、應用和地區分類(2026-2032 年)營養補充品市場分析及預測(至2034年):類型、產品、應用、形式、最終用戶、功能、技術、部署、解決方案
 全球營養保健品市場評估:依產品、形式、來源、通路、地區、機會和預測,2018年至2032年
 膳食補充劑市場規模、佔有率和成長分析(按來源、成分、產品、形式、配銷通路、應用和地區)- 2025-2032 年行業預測
 營養添加劑市場規模、佔有率、成長分析,按產品類型、形式、最終用途、地區 - 產業預測,2025-2032 年營養補充品的CDMO市場:各劑型,各類服務,不同企業規模,各地區,機會,預測,2017年~2031年
 營養保健品:世界市場營養保健品市場機會、成長動力、產業趨勢分析及 2024 年至 2032 年預測