


 |
市場調查報告書
商品編碼
1666588
AMI 電錶市場機會、成長動力、產業趨勢分析和 2025 - 2034 年預測AMI Meter Market Opportunity, Growth Drivers, Industry Trend Analysis, and Forecast 2025 - 2034 |
||||||
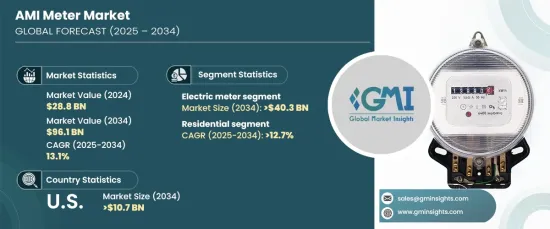
2024 年全球 AMI 電錶市場規模將達到 288 億美元,並有望實現顯著成長,預計 2025 年至 2034 年期間的複合年成長率為 13.1%。世界各國政府正在實施強力的政策和監管框架來促進能源節約,從而對智慧電網基礎設施進行了大量投資。 AMI 電錶可實現即時資料收集、遠端監控和雙向通訊,確保準確計費、有效的需求側管理以及可再生能源與現有電網的無縫整合。
隨著全球能源格局的演變,AMI 電錶對於公用事業公司滿足日益成長的永續解決方案需求變得越來越重要。這些設備對於減少能源浪費、最佳化電網效能和增強消費者參與至關重要。物聯網、人工智慧和資料分析等尖端技術的整合正在徹底改變市場,實現預測性維護、精確負載預測和先進的能源分配策略。此外,全球致力於實現碳減排目標並提高再生能源效率,正在擴大 AMI 系統的採用,使其成為向綠色未來轉型過程中不可或缺的一部分。
| 市場範圍 | |
|---|---|
| 起始年份 | 2024 |
| 預測年份 | 2025-2034 |
| 起始值 | 288億美元 |
| 預測值 | 961億美元 |
| 複合年成長率 | 13.1% |
隨著即時電力消耗監控需求的不斷成長,電錶產業預計到 2034 年將創收 403 億美元。這些儀表使用戶能夠最佳化能源使用並降低成本,對注重有效管理公用事業費用的住宅消費者俱有很大的吸引力。政府透過提供激勵、補貼和強制措施來提高能源效率,進一步加速了智慧電錶的普及。採用率的激增凸顯了智慧電錶越來越受到認可,作為實現長期能源節約的經濟有效的解決方案。
預計到 2034 年,住宅應用將以 12.7% 的複合年成長率擴大。這些技術支援注重環保的能源消費模式,同時為消費者提供對公用事業使用的精確控制。
預計到 2034 年,美國 AMI 電錶市場規模將達到 107 億美元,這得益於住宅應用中對公用事業使用情況的精確監控需求不斷成長。消費者正在採用智慧電錶來識別低效率、減少浪費和節約資源。監管要求和政府激勵措施是該領域的主要驅動力,而地方公用事業公司正在積極推動智慧電錶的採用,以實現國家能源效率目標。這些努力正在推動美國 AMI 電錶市場的快速成長。
目錄
第 1 章:方法論與範圍
- 市場定義
- 基礎估算與計算
- 預測計算
- 資料來源
- 基本的
- 次要
- 有薪資的
- 民眾
第 2 章:執行摘要
第 3 章:產業洞察
- 產業生態系統分析
- 監管格局
- 產業衝擊力
- 成長動力
- 產業陷阱與挑戰
- 成長潛力分析
- 波特的分析
- 供應商的議價能力
- 買家的議價能力
- 新進入者的威脅
- 替代品的威脅
- PESTEL 分析
第4章:競爭格局
- 戰略儀表板
- 創新與永續發展格局
第 5 章:市場規模及預測:依產品,2021 – 2034 年
- 主要趨勢
- 電的
- 水
- 氣體
第 6 章:市場規模與預測:按應用,2021 – 2034 年
- 主要趨勢
- 住宅
- 商業的
- 公用事業
第 7 章:市場規模及預測:按地區,2021 – 2034 年
- 主要趨勢
- 北美洲
- 美國
- 加拿大
- 墨西哥
- 歐洲
- 英國
- 法國
- 德國
- 義大利
- 俄羅斯
- 西班牙
- 亞太地區
- 中國
- 澳洲
- 印度
- 日本
- 韓國
- 中東和非洲
- 沙烏地阿拉伯
- 阿拉伯聯合大公國
- 土耳其
- 南非
- 埃及
- 拉丁美洲
- 巴西
- 阿根廷
第8章:公司簡介
- Aclara Technologies
- Apator
- Arad Group
- Badger Meter
- BMETERS
- Diehl Stiftung
- Honeywell International
- Itron
- Kamstrup
- Landis+Gyr
- Neptune Technology Group
- Ningbo Water Meter
- Schneider Electric
- Sensus
- Siemens
- Sontex
- Zenner International
The Global AMI Meter Market reached USD 28.8 billion in 2024 and is poised for remarkable growth, with a projected CAGR of 13.1% between 2025 and 2034. This growth is driven by the increasing emphasis on energy efficiency, the modernization of smart grid systems, and advanced utility management practices. Governments worldwide are implementing robust policies and regulatory frameworks to promote energy conservation, resulting in significant investments in smart grid infrastructure. AMI meters enable real-time data collection, remote monitoring, and two-way communication, ensuring accurate billing, effective demand-side management, and seamless integration of renewable energy sources into existing grids.
As the global energy landscape evolves, AMI meters are becoming essential for utilities to address the growing demand for sustainable solutions. These devices are pivotal in reducing energy waste, optimizing grid performance, and enhancing consumer engagement. The integration of cutting-edge technologies like IoT, AI, and data analytics is revolutionizing the market, allowing predictive maintenance, precise load forecasting, and advanced energy distribution strategies. Moreover, the global push toward meeting carbon reduction targets and enhancing the efficiency of renewable energy resources is expanding the adoption of AMI systems, making them indispensable in the transition to a greener future.
| Market Scope | |
|---|---|
| Start Year | 2024 |
| Forecast Year | 2025-2034 |
| Start Value | $28.8 Billion |
| Forecast Value | $96.1 Billion |
| CAGR | 13.1% |
The electric meter segment is anticipated to generate USD 40.3 billion by 2034, driven by the increasing need for real-time electricity consumption monitoring. These meters empower users to optimize energy usage and reduce costs, creating substantial appeal among residential consumers focused on managing utility expenses effectively. The adoption of smart meters is further accelerated by government initiatives that offer incentives, subsidies, and mandates to promote energy efficiency. This surge in adoption highlights the growing recognition of smart meters as a cost-effective solution for achieving long-term energy savings.
Residential applications are projected to expand at a CAGR of 12.7% through 2034. Governments and utilities are increasingly encouraging the adoption of advanced metering technologies in residential areas to enhance resource efficiency, align with sustainability objectives, and promote better resource management. These technologies support environmentally conscious energy consumption patterns while offering consumers precise control over their utility usage.
The U.S. AMI meter market is forecast to reach USD 10.7 billion by 2034, driven by the growing need for precise monitoring of utility usage in residential applications. Consumers are adopting smart meters to identify inefficiencies, reduce waste, and conserve resources. Regulatory mandates and government incentives are key drivers in this sector, while local utilities are actively promoting smart meter adoption to meet national energy efficiency goals. These efforts are fueling the rapid growth of the AMI meters market across the United States.
Table of Contents
Chapter 1 Methodology & Scope
- 1.1 Market definitions
- 1.2 Base estimates & calculations
- 1.3 Forecast calculation
- 1.4 Data sources
- 1.4.1 Primary
- 1.4.2 Secondary
- 1.4.2.1 Paid
- 1.4.2.2 Public
Chapter 2 Executive Summary
- 2.1 Industry synopsis, 2021 - 2034
Chapter 3 Industry Insights
- 3.1 Industry ecosystem analysis
- 3.2 Regulatory landscape
- 3.3 Industry impact forces
- 3.3.1 Growth drivers
- 3.3.2 Industry pitfalls & challenges
- 3.4 Growth potential analysis
- 3.5 Porter's analysis
- 3.5.1 Bargaining power of suppliers
- 3.5.2 Bargaining power of buyers
- 3.5.3 Threat of new entrants
- 3.5.4 Threat of substitutes
- 3.6 PESTEL analysis
Chapter 4 Competitive landscape, 2024
- 4.1 Strategic dashboard
- 4.2 Innovation & sustainability landscape
Chapter 5 Market Size and Forecast, By Product, 2021 – 2034 (USD Million, ‘000 Units)
- 5.1 Key trends
- 5.2 Electric
- 5.3 Water
- 5.4 Gas
Chapter 6 Market Size and Forecast, By Application, 2021 – 2034 (USD Million, ‘000 Units)
- 6.1 Key trends
- 6.2 Residential
- 6.3 Commercial
- 6.4 Utility
Chapter 7 Market Size and Forecast, By Region, 2021 – 2034 (USD Million, ‘000 Units)
- 7.1 Key trends
- 7.2 North America
- 7.2.1 U.S.
- 7.2.2 Canada
- 7.2.3 Mexico
- 7.3 Europe
- 7.3.1 UK
- 7.3.2 France
- 7.3.3 Germany
- 7.3.4 Italy
- 7.3.5 Russia
- 7.3.6 Spain
- 7.4 Asia Pacific
- 7.4.1 China
- 7.4.2 Australia
- 7.4.3 India
- 7.4.4 Japan
- 7.4.5 South Korea
- 7.5 Middle East & Africa
- 7.5.1 Saudi Arabia
- 7.5.2 UAE
- 7.5.3 Turkey
- 7.5.4 South Africa
- 7.5.5 Egypt
- 7.6 Latin America
- 7.6.1 Brazil
- 7.6.2 Argentina
Chapter 8 Company Profiles
- 8.1 Aclara Technologies
- 8.2 Apator
- 8.3 Arad Group
- 8.4 Badger Meter
- 8.5 BMETERS
- 8.6 Diehl Stiftung
- 8.7 Honeywell International
- 8.8 Itron
- 8.9 Kamstrup
- 8.10 Landis+Gyr
- 8.11 Neptune Technology Group
- 8.12 Ningbo Water Meter
- 8.13 Schneider Electric
- 8.14 Sensus
- 8.15 Siemens
- 8.16 Sontex
- 8.17 Zenner International
 2025 年至 2033 年進階計量基礎設施 (AMI) 市場報告(按產品類型(智慧計量設備、解決方案、服務)、最終用戶(住宅、商業、工業)和地區)
 先進計量基礎設施:市場佔有率分析、產業趨勢與統計、成長預測(2025-2030 年)先進計量基礎設施市場:按組件、最終用戶分類 - 2025-2030 年全球預測
 AMI(進階計量基礎設施)追蹤 (Data Insights Services)
 下一代 AMI 重新定義能源和公用事業的狀態感知
 2030 年先進計量基礎設施市場預測:按產品類型、最終用戶和地區分類的全球分析
 先進測量基礎設施的全球市場:2024 年2024-2032 年按產品類型(智慧計量設備、解決方案、服務)、最終用戶(住宅、商業、工業)和地區分類的高級計量基礎設施 (AMI) 市場報告
 全球先進計量基礎設施市場 - 2023-2030