


 |
市場調查報告書
商品編碼
1666887
車載支付服務市場機會、成長動力、產業趨勢分析及 2025 - 2034 年預測In-Vehicle Payment Services Market Opportunity, Growth Drivers, Industry Trend Analysis, and Forecast 2025 - 2034 |
||||||
2024 年全球車載支付服務市場價值為 14 億美元,預計 2025 年至 2034 年期間將實現 26.7% 的強勁成長率。這些創新實現了車輛、支付系統和服務提供者之間的無縫通訊,從而更快地採用車載支付解決方案。隨著汽車產業透過連網、自動駕駛和電動車進行轉型,對高階支付解決方案的需求比以往任何時候都高。這些技術不僅為消費者提供了更便利、更有效的支付方式,而且還改善了整體駕駛體驗。
即時資料處理、語音交易和增強的安全功能所提供的便利性使得車載支付系統對消費者和服務提供者都具有極大的吸引力。此外,電動和自動駕駛汽車的日益普及也增加了對可靠支付解決方案的需求,特別是對於通行費支付和電動車充電等服務。隨著道路上電動車的數量不斷增加,越來越多的駕駛者尋求無縫、高效的方法來支付旅途中的充電費用,這進一步加速了市場成長。隨著這些系統的不斷發展,在創新和消費者對簡化支付體驗的需求的推動下,市場預計未來幾年將呈指數級成長。
| 市場範圍 | |
|---|---|
| 起始年份 | 2024 |
| 預測年份 | 2025-2034 |
| 起始值 | 14億美元 |
| 預測值 | 146億美元 |
| 複合年成長率 | 26.7% |
市場分為兩種主要支付方式:錢包和金融卡/信用卡。簽帳金融卡/信用卡領域在 2024 年佔據了 56% 的顯著佔有率,預計到 2034 年將產生 72 億美元的收入。金融卡和信用卡支付具有強大的安全功能,包括防詐騙和即時交易監控,因此越來越受到消費者的青睞。此外,這些卡片與各種數位支付生態系統高度相容,成為全球消費者的首選。
在應用方面,市場分為加油/電動車充電、智慧停車、自動收費支付和電子商務。 2024 年,加油和電動車充電領域佔據了 40% 的最大市場佔有率,這得益於這些服務的重要性質,尤其是隨著向電動車的轉變繼續獲得動力。由於這些服務對於車輛運行至關重要,因此它們對車內交易量貢獻巨大。
2024 年,美國車載支付服務市場佔 76% 的主導佔有率,證明了該國汽車產業的先進性和車聯網技術的廣泛應用。美國受惠於完善的基礎設施,包括龐大的收費系統網路、智慧停車解決方案和不斷擴大的電動車充電站。這些因素為車載支付系統的無縫整合創造了理想的環境。此外,消費者對非接觸式和便利支付方式的偏好日益成長,加速了這些系統的採用。汽車製造商、金融科技公司和技術供應商之間的強力合作正在推動持續創新,並確保這些支付解決方案不斷發展和擴展。
目錄
第 1 章:方法論與範圍
- 研究設計
- 研究方法
- 資料收集方法
- 基礎估計和計算
- 基準年計算
- 市場估計的主要趨勢
- 預測模型
- 初步研究與驗證
- 主要來源
- 資料探勘來源
- 市場定義
第 2 章:執行摘要
第 3 章:產業洞察
- 產業生態系統分析
- 行動支付服務提供者
- 銀行及金融機構
- 商家和零售商
- 最終用途
- 供應商概況
- 利潤率分析
- 技術與創新格局
- 重要新聞及舉措
- 監管格局
- 衝擊力
- 成長動力
- 連網汽車的技術進步
- 便利性需求不斷成長
- 智慧城市和基礎設施的擴展
- 電動車(EV)的普及率不斷提高
- 產業陷阱與挑戰
- 實施成本高
- 網路安全和資料隱私問題
- 成長動力
- 成長潛力分析
- 波特的分析
- PESTEL 分析
第4章:競爭格局
- 介紹
- 公司市佔率分析
- 競爭定位矩陣
- 戰略展望矩陣
第 5 章:市場估計與預測:按支付方式,2021 - 2034 年
- 主要趨勢
- 錢包
- 金融卡/信用卡
第 6 章:市場估計與預測:按應用,2021 - 2034 年
- 主要趨勢
- 加油/電動車充電
- 智慧停車
- 自動支付通行費
- 電子商務
- 其他
第7章:市場估計與預測:按地區,2021 - 2034 年
- 主要趨勢
- 北美洲
- 美國
- 加拿大
- 歐洲
- 英國
- 德國
- 法國
- 西班牙
- 義大利
- 北歐
- 俄羅斯
- 亞太地區
- 中國
- 印度
- 日本
- 韓國
- 澳洲
- 東南亞
- 拉丁美洲
- 巴西
- 墨西哥
- 阿根廷
- 中東及非洲
- 阿拉伯聯合大公國
- 南非
- 沙烏地阿拉伯
第8章:公司簡介
- Amazon Web Services Inc.
- Daimler AG
- Ford Motor Company
- General Motors
- Google LLC
- Hyundai Motor
- IBM Corporation
- Jaguar Land Rover Automotive PLC
- Mastercard
- ParkMobile
- PayPal
- Shell
- Visa Inc.
- Volkswagen AG
- ZF Friedrichshafen AG
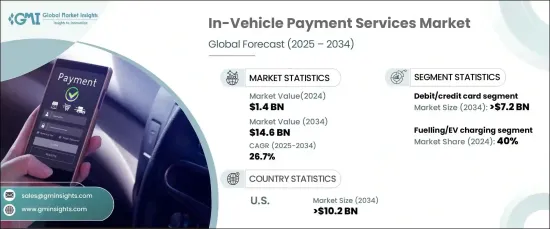
The Global In-Vehicle Payment Services Market was valued at USD 1.4 billion in 2024 and is projected to experience a robust growth rate of 26.7% CAGR from 2025 to 2034. The market expansion is being propelled by the increasing integration of advanced technologies such as the Internet of Things (IoT), 5G, and artificial intelligence (AI) in connected vehicles. These innovations enable seamless communication between vehicles, payment systems, and service providers, leading to faster adoption of in-vehicle payment solutions. With the automotive sector undergoing a transformation through connected, autonomous, and electric vehicles, the demand for advanced payment solutions is higher than ever before. These technologies not only offer consumers a more convenient and efficient way to manage payments but also improve the overall driving experience.
The convenience provided by real-time data processing, voice-activated transactions, and enhanced security features has made in-vehicle payment systems highly appealing to both consumers and service providers. In addition, the growing popularity of electric and autonomous vehicles has amplified the need for reliable payment solutions, particularly for services such as toll payments and EV charging. With the increasing number of electric vehicles on the road, more drivers are seeking seamless, efficient methods to pay for their charging sessions while on the go, further accelerating market growth. As these systems continue to evolve, the market is expected to see exponential growth in the coming years, fueled by innovation and consumer demand for simplified payment experiences.
| Market Scope | |
|---|---|
| Start Year | 2024 |
| Forecast Year | 2025-2034 |
| Start Value | $1.4 Billion |
| Forecast Value | $14.6 Billion |
| CAGR | 26.7% |
The market is divided into two primary payment methods: wallets and debit/credit cards. The debit/credit card segment held a significant share of 56% in 2024 and is projected to generate USD 7.2 billion by 2034. This dominance can be attributed to the widespread acceptance and trust associated with card-based payments. Consumers are increasingly drawn to debit and credit card payments due to their robust security features, including fraud protection and real-time transaction monitoring. Additionally, these cards are highly compatible with a wide range of digital payment ecosystems, making them a preferred choice for consumers globally.
In terms of applications, the market is segmented into fueling/EV charging, smart parking, automated toll payments, and e-commerce. The fueling and EV charging segment captured the largest market share of 40% in 2024, driven by the essential nature of these services, particularly as the shift toward electric vehicles continues to gain momentum. As these services are crucial for vehicle operation, they contribute significantly to the volume of in-vehicle transactions.
The U.S. in-vehicle payment services market held a dominant share of 76% in 2024, a testament to the country's advanced automotive industry and the widespread adoption of connected vehicle technologies. The U.S. benefits from an established infrastructure that includes a vast network of toll systems, smart parking solutions, and expanding EV charging stations. These factors have created an ideal environment for the seamless integration of in-vehicle payment systems. Additionally, the growing preference for contactless and convenient payment options among consumers has accelerated the adoption of these systems. Strong partnerships between automakers, fintech companies, and technology providers are driving ongoing innovation and ensuring that these payment solutions continue to evolve and expand.
Table of Contents
Chapter 1 Methodology & Scope
- 1.1 Research design
- 1.1.1 Research approach
- 1.1.2 Data collection methods
- 1.2 Base estimates and calculations
- 1.2.1 Base year calculation
- 1.2.2 Key trends for market estimates
- 1.3 Forecast model
- 1.4 Primary research & validation
- 1.4.1 Primary sources
- 1.4.2 Data mining sources
- 1.5 Market definitions
Chapter 2 Executive Summary
- 2.1 Industry synopsis, 2021 - 2034
Chapter 3 Industry Insights
- 3.1 Industry ecosystem analysis
- 3.1.1 Mobile payment service providers
- 3.1.2 Banks & financial institutions
- 3.1.3 Merchants & retailers
- 3.1.4 End use
- 3.2 Supplier landscape
- 3.3 Profit margin analysis
- 3.4 Technology & innovation landscape
- 3.5 Key news & initiatives
- 3.6 Regulatory landscape
- 3.7 Impact forces
- 3.7.1 Growth drivers
- 3.7.1.1 Technological advancements in connected vehicles
- 3.7.1.2 Rising demand for convenience
- 3.7.1.3 Expansion of smart cities and infrastructure
- 3.7.1.4 Growing adoption of electric vehicles (EV)
- 3.7.2 Industry pitfalls & challenges
- 3.7.2.1 High implementation costs
- 3.7.2.2 Cybersecurity and data privacy concerns
- 3.7.1 Growth drivers
- 3.8 Growth potential analysis
- 3.9 Porter’s analysis
- 3.10 PESTEL analysis
Chapter 4 Competitive Landscape, 2024
- 4.1 Introduction
- 4.2 Company market share analysis
- 4.3 Competitive positioning matrix
- 4.4 Strategic outlook matrix
Chapter 5 Market Estimates & Forecast, By Payment Mode, 2021 - 2034 ($Bn)
- 5.1 Key trends
- 5.2 Wallet
- 5.3 Debit/Credit card
Chapter 6 Market Estimates & Forecast, By Application, 2021 - 2034 ($Bn)
- 6.1 Key trends
- 6.2 Fuelling/EV charging
- 6.3 Smart parking
- 6.4 Automated toll payments
- 6.5 E-commerce
- 6.6 Others
Chapter 7 Market Estimates & Forecast, By Region, 2021 - 2034 ($Bn)
- 7.1 Key trends
- 7.2 North America
- 7.2.1 U.S.
- 7.2.2 Canada
- 7.3 Europe
- 7.3.1 UK
- 7.3.2 Germany
- 7.3.3 France
- 7.3.4 Spain
- 7.3.5 Italy
- 7.3.6 Nordics
- 7.3.7 Russia
- 7.4 Asia Pacific
- 7.4.1 China
- 7.4.2 India
- 7.4.3 Japan
- 7.4.4 South Korea
- 7.4.5 Australia
- 7.4.6 Southeast Asia
- 7.5 Latin America
- 7.5.1 Brazil
- 7.5.2 Mexico
- 7.5.3 Argentina
- 7.6 MEA
- 7.6.1 UAE
- 7.6.2 South Africa
- 7.6.3 Saudi Arabia
Chapter 8 Company Profiles
- 8.1 Amazon Web Services Inc.
- 8.2 Daimler AG
- 8.3 Ford Motor Company
- 8.4 General Motors
- 8.5 Google LLC
- 8.6 Hyundai Motor
- 8.7 IBM Corporation
- 8.8 Jaguar Land Rover Automotive PLC
- 8.9 Mastercard
- 8.10 ParkMobile
- 8.11 PayPal
- 8.12 Shell
- 8.13 Visa Inc.
- 8.14 Volkswagen AG
- 8.15 ZF Friedrichshafen AG
 車載付款服務市場規模、佔有率及成長分析(按付款方式、應用和地區)- 產業預測 2025-2032
 2025 年全球車用付款服務市場報告
 車載付款服務市場:付款方式、外形規格、應用程式和車輛類型 - 2025-2030 年全球預測車內付款·ETC的中國市場(2024年)到 2030 年車載付款系統市場預測:按付款類型、車輛類型、技術、應用、最終用戶和地區進行全球分析
 車載支付服務市場、份額、規模、趨勢、行業分析報告:按支付方式、應用、地區和細分市場預測,2024-2032
 車載付款服務市場規模、佔有率和趨勢分析報告:按付款模式、按應用、按地區和細分市場預測,2023-2030年
 車載付款服務市場報告:到2030年的趨勢、預測與競爭分析汽車付款服務市場:各付款方式,各用途,各地區-2023年~2030年的市場規模,佔有率,展望,機會分析
 車內付款的中國市場(2023年)