


 |
市場調查報告書
商品編碼
1684858
逆向物流市場機會、成長動力、產業趨勢分析與 2025 - 2034 年預測Reverse Logistics Market Opportunity, Growth Drivers, Industry Trend Analysis, and Forecast 2025 - 2034 |
||||||
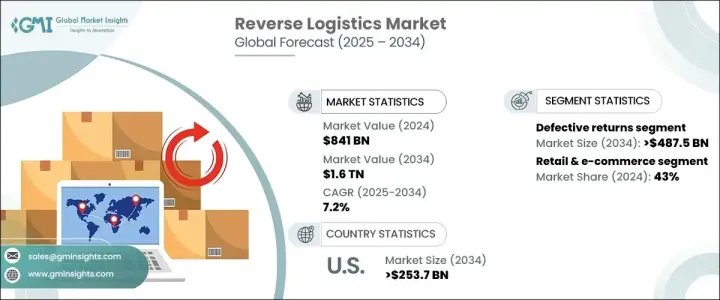
2024 年全球逆向物流市場價值為 8,410 億美元,預計 2025 年至 2034 年的複合年成長率為 7.2%。這一成長主要得益於對環境永續性的日益關注以及對符合企業社會責任 (CSR) 目標的高效物流解決方案的需求不斷成長。隨著企業努力減少浪費、最大限度地減少對環境的影響並遵守嚴格的永續法規,逆向物流市場已成為處理退貨的重要參與者。該行業在回收、翻新和負責任地處理產品方面發揮關鍵作用,幫助企業以經濟高效和環保的方式管理退貨。
受產品退貨增加和無縫退貨流程需求激增等因素的推動,逆向物流市場正在迅速發展。隨著全球電子商務產業的蓬勃發展以及對線上購物的日益依賴,產品退貨量急劇增加。公司正在增加對逆向物流基礎設施的投資,以應對這種激增,同時也滿足客戶對靈活退貨政策和提高滿意度的期望。在這種背景下,逆向物流解決方案對於提高營運效率、降低成本、培養客戶忠誠度以及最大限度地減少產品退貨的碳足跡變得至關重要。
| 市場範圍 | |
|---|---|
| 起始年份 | 2024 |
| 預測年份 | 2025-2034 |
| 起始值 | 8410億美元 |
| 預測值 | 1.6兆美元 |
| 複合年成長率 | 7.2% |
2024 年,缺陷退貨佔據市場主導地位,佔有 28% 的佔有率,價值 4,875 億美元,預計到 2034 年仍將保持顯著成長。這些退貨主要是由於產品故障、損壞或性能故障所致,尤其是在高價值行業。電子、汽車和零售等行業的公司在管理這些退貨時面臨著巨大的挑戰,因為他們必須專注於提高產品品質、減少損失並確保客戶滿意度。
以最終用戶分類,逆向物流市場很大程度上受到製藥、零售和電子商務、電子、汽車和製造業等關鍵產業的影響。其中,零售和電子商務領域在 2024 年佔據領先地位,佔有率為 43%,這主要歸因於線上購物格局的擴大和產品退貨的增加。隨著線上零售商採用靈活的退貨政策,包括延長退貨期限和免費退貨運輸,對高效逆向物流解決方案的需求預計將持續成長。
光是美國逆向物流市場在 2024 年就佔了全球佔有率的 76%,到 2034 年將產生 2,537 億美元的產值。這一成長得益於完善的電子商務生態系統、嚴格的監管合規要求以及物流技術的快速進步。隨著企業努力提高效率並滿足不斷變化的客戶期望,對最佳化退貨流程和基礎設施的需求持續增加。此外,強調永續性和對環境負責的退貨處理的監管政策正在加速該行業採用綠色物流實踐。
目錄
第 1 章:方法論與範圍
- 研究設計
- 研究方法
- 資料收集方法
- 基礎估計和計算
- 基準年計算
- 市場估計的主要趨勢
- 預測模型
- 初步研究與驗證
- 主要來源
- 資料探勘來源
- 市場定義
第 2 章:執行摘要
第 3 章:產業洞察
- 產業生態系統分析
- 技術提供者
- 零件供應商
- 原始設備製造商
- 最終用戶
- 供應商概況
- 利潤率分析
- 技術與創新格局
- 重要新聞及舉措
- 監管格局
- 衝擊力
- 成長動力
- 更加重視永續性
- 電子商務和產品退貨的增加
- 成本效益和資源回收
- 技術進步
- 產業陷阱與挑戰
- 營運成本高
- 退貨管理的複雜性
- 成長動力
- 成長潛力分析
- 波特的分析
- PESTEL 分析
第4章:競爭格局
- 介紹
- 公司市佔率分析
- 競爭定位矩陣
- 戰略展望矩陣
第 5 章:市場估計與預測:按工藝,2021 - 2034 年
- 主要趨勢
- 退貨管理
- 再製造
- 回收利用
- 處理
- 其他
第6章:市場估計與預測:按回報,2021 - 2034 年
- 主要趨勢
- 缺陷退貨
- 召回退貨
- B2b 回報與商業回報
- 可修復的退貨
- 生命終點回歸
- 其他
第 7 章:市場估計與預測:按服務供應商,2021 - 2034 年
- 主要趨勢
- 內部逆向物流
- 第三方物流 (3PL) 供應商
- 回收公司
- 廢棄物管理公司
第 8 章:市場估計與預測:按最終用途,2021 - 2034 年
- 主要趨勢
- 零售與電子商務
- 電子產品
- 汽車
- 藥品
- 製造業
- 其他
第 9 章:市場估計與預測:按地區,2021 - 2034 年
- 主要趨勢
- 北美洲
- 美國
- 加拿大
- 歐洲
- 英國
- 德國
- 法國
- 西班牙
- 義大利
- 俄羅斯
- 北歐
- 亞太地區
- 中國
- 印度
- 日本
- 韓國
- 澳新銀行
- 東南亞
- 拉丁美洲
- 巴西
- 墨西哥
- 阿根廷
- 中東及非洲
- 阿拉伯聯合大公國
- 南非
- 沙烏地阿拉伯
第10章:公司簡介
- Deutsche Post DHL Group
- UPS
- FedEx
- XPO Logistics
- Ryder System, Inc.
- Maersk
- ReverseLogix
- CEVA Logistics
- DB Schenker
- Lineage Logistics
- Kuehne + Nagel
- Expeditors International
- Geodis
- CH Robinson
- Pitney Bowes
- Genco (now part of FedEx)
- Manhattan Associates
- Damco
- TTS Logistics
- Echo Global Logistics
The Global Reverse Logistics Market, valued at USD 841 billion in 2024, is on track to experience significant growth, with a projected CAGR of 7.2% from 2025 to 2034. This growth is largely fueled by the increasing focus on environmental sustainability and the rising demand for efficient logistics solutions that align with corporate social responsibility (CSR) goals. As businesses strive to reduce waste, minimize environmental impact, and comply with strict sustainability regulations, the reverse logistics market has emerged as a crucial player in handling returned goods. This sector plays a pivotal role in recycling, refurbishing, and responsibly disposing of products, helping companies manage returns in a cost-effective and environmentally friendly manner.
The reverse logistics market is rapidly evolving, driven by factors such as heightened product returns and a surge in demand for seamless return processes. With the global e-commerce sector booming and an increasing reliance on online shopping, the volume of product returns has skyrocketed. Companies are increasingly investing in reverse logistics infrastructure to manage this surge while also catering to customer expectations for flexible return policies and enhanced satisfaction. In this context, reverse logistics solutions are becoming essential for improving operational efficiency, reducing costs, and fostering customer loyalty, all while minimizing the carbon footprint of product returns.
| Market Scope | |
|---|---|
| Start Year | 2024 |
| Forecast Year | 2025-2034 |
| Start Value | $841 Billion |
| Forecast Value | $1.6 Trillion |
| CAGR | 7.2% |
In 2024, defective returns dominated the market, accounting for 28% of the share, valued at USD 487.5 billion, and expected to maintain significant growth through 2034. These returns are largely driven by product malfunctions, damage, or performance failures, particularly in high-value industries. Companies in sectors such as electronics, automotive, and retail face significant challenges when managing these returns, as they must focus on enhancing product quality, minimizing losses, and ensuring customer satisfaction.
By end-user, the reverse logistics market is largely influenced by key industries, including pharmaceuticals, retail & e-commerce, electronics, automotive, and manufacturing. Among these, the retail & e-commerce segment took the lead with a 43% share in 2024, largely attributed to the expanding online shopping landscape and an increase in product returns. As online retailers adopt flexible return policies, including extended return windows and free return shipping, the demand for efficient reverse logistics solutions is expected to continue growing.
The U.S. reverse logistics market alone accounted for 76% of the global share in 2024, generating USD 253.7 billion by 2034. This growth is driven by the well-established e-commerce ecosystem, stringent regulatory compliance requirements, and rapid advancements in logistics technology. The demand for optimized return processes and infrastructure continues to rise as businesses work to improve efficiency and meet evolving customer expectations. Additionally, regulatory policies that emphasize sustainability and environmentally responsible handling of returns are accelerating the adoption of green logistics practices in the industry.
Table of Contents
Chapter 1 Methodology & Scope
- 1.1 Research design
- 1.1.1 Research approach
- 1.1.2 Data collection methods
- 1.2 Base estimates and calculations
- 1.2.1 Base year calculation
- 1.2.2 Key trends for market estimates
- 1.3 Forecast model
- 1.4 Primary research & validation
- 1.4.1 Primary sources
- 1.4.2 Data mining sources
- 1.5 Market definitions
Chapter 2 Executive Summary
- 2.1 Industry synopsis, 2021 - 2034
Chapter 3 Industry Insights
- 3.1 Industry ecosystem analysis
- 3.1.1 Technology providers
- 3.1.2 Component suppliers
- 3.1.3 OEMs
- 3.1.4 End user
- 3.2 Supplier landscape
- 3.3 Profit margin analysis
- 3.4 Technology & innovation landscape
- 3.5 Key news & initiatives
- 3.6 Regulatory landscape
- 3.7 Impact forces
- 3.7.1 Growth drivers
- 3.7.1.1 Increasing focus on sustainability
- 3.7.1.2 Rising e-commerce and product returns
- 3.7.1.3 Cost efficiency and resource recovery
- 3.7.1.4 Technological advancements
- 3.7.2 Industry pitfalls & challenges
- 3.7.2.1 High operational costs
- 3.7.2.2 Complexity of returns management
- 3.7.1 Growth drivers
- 3.8 Growth potential analysis
- 3.9 Porter’s analysis
- 3.10 PESTEL analysis
Chapter 4 Competitive Landscape, 2024
- 4.1 Introduction
- 4.2 Company market share analysis
- 4.3 Competitive positioning matrix
- 4.4 Strategic outlook matrix
Chapter 5 Market Estimates & Forecast, By Processes, 2021 - 2034 ($Bn)
- 5.1 Key trends
- 5.2 Returns management
- 5.3 Remanufacturing
- 5.4 Recycling
- 5.5 Disposal
- 5.6 Others
Chapter 6 Market Estimates & Forecast, By Return, 2021 - 2034 ($Bn)
- 6.1 Key trends
- 6.2 Defective returns
- 6.3 Recalled returns
- 6.4 B2b returns and commercial returns
- 6.5 Repairable returns
- 6.6 End of life returns
- 6.7 Others
Chapter 7 Market Estimates & Forecast, By Service Provider, 2021 - 2034 ($Bn)
- 7.1 Key trends
- 7.2 In-house reverse logistics
- 7.3 Third-party logistics (3PL) Providers
- 7.4 Recycling companies
- 7.5 Waste management companies
Chapter 8 Market Estimates & Forecast, By End Use, 2021 - 2034 ($Bn)
- 8.1 Key trends
- 8.2 Retail & E-commerce
- 8.3 Electronics
- 8.4 Automotive
- 8.5 Pharmaceuticals
- 8.6 Manufacturing
- 8.7 Others
Chapter 9 Market Estimates & Forecast, By Region, 2021 - 2034 ($Bn)
- 9.1 Key trends
- 9.2 North America
- 9.2.1 U.S.
- 9.2.2 Canada
- 9.3 Europe
- 9.3.1 UK
- 9.3.2 Germany
- 9.3.3 France
- 9.3.4 Spain
- 9.3.5 Italy
- 9.3.6 Russia
- 9.3.7 Nordics
- 9.4 Asia Pacific
- 9.4.1 China
- 9.4.2 India
- 9.4.3 Japan
- 9.4.4 South Korea
- 9.4.5 ANZ
- 9.4.6 Southeast Asia
- 9.5 Latin America
- 9.5.1 Brazil
- 9.5.2 Mexico
- 9.5.3 Argentina
- 9.6 MEA
- 9.6.1 UAE
- 9.6.2 South Africa
- 9.6.3 Saudi Arabia
Chapter 10 Company Profiles
- 10.1 Deutsche Post DHL Group
- 10.2 UPS
- 10.3 FedEx
- 10.4 XPO Logistics
- 10.5 Ryder System, Inc.
- 10.6 Maersk
- 10.7 ReverseLogix
- 10.8 CEVA Logistics
- 10.9 DB Schenker
- 10.10 Lineage Logistics
- 10.11 Kuehne + Nagel
- 10.12 Expeditors International
- 10.13 Geodis
- 10.14 C.H. Robinson
- 10.15 Pitney Bowes
- 10.16 Genco (now part of FedEx)
- 10.17 Manhattan Associates
- 10.18 Damco
- 10.19 TTS Logistics
- 10.20 Echo Global Logistics
 2025 年至 2033 年逆向物流市場報告(依退貨類型、服務、最終用戶和地區)
 美國逆向物流市場:市場佔有率分析、產業趨勢與成長預測(2025-2030 年)
 2025年逆向物流全球市場報告
 逆向物流市場規模、佔有率和成長分析(按退貨類型、服務、最終用戶產業和地區)- 產業預測 2025-2032
 逆向物流市場分析及預測至 2033 年:依類型、產品、服務、技術、應用、流程、部署、最終使用者及解決方案逆向物流的全球市場的評估:各退貨類型,各類服務,各終端用戶,各地區,機會,預測(2017年~2031年)
 全球逆向物流市場規模研究(按退貨類型、最終用戶和 2022-2032 年區域預測)
 逆向物流市場:依退貨類型、最終用戶分類:2023-2032 年全球機會分析與產業預測2024-2032 年按退貨類型、服務、最終用戶和地區分類的逆向物流市場報告
 全球逆向物流市場:市場規模和佔有率分析(依退貨類型、最終用戶和服務)、工業需求預測(截至2030年)