


 |
市場調查報告書
商品編碼
1683220
美國逆向物流市場:市場佔有率分析、產業趨勢與成長預測(2025-2030 年)US Reverse Logistics - Market Share Analysis, Industry Trends & Statistics, Growth Forecasts (2025 - 2030) |
||||||
※ 本網頁內容可能與最新版本有所差異。詳細情況請與我們聯繫。
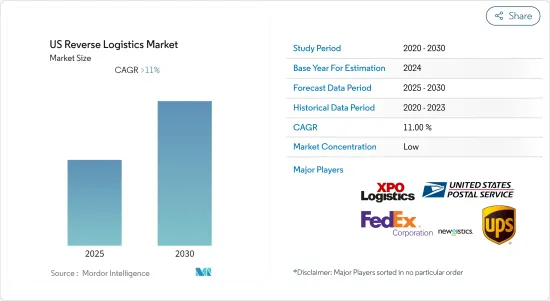
預計預測期內美國逆向物流市場複合年成長率將超過 11%
關鍵亮點
- 網路購物和銷售持續蓬勃發展。零售商和快遞公司必須運送越來越多的出站包裝,同時也要應付不斷增加的退貨量。 2017 年,約有 1,200 億美元的電子商務商品被退回。在網上購買的商品被退回的可能性比實體店購買的商品高出三倍。退貨對零售商來說是一個挑戰,但由於客戶越來越認為退貨是網路購物體驗的重要組成部分,因此很難限制退貨。快速、免費且友善的退貨聲譽可以贏得客戶忠誠度,而糟糕的退貨體驗很容易讓客戶望而卻步。除了包裝廢棄物外,零售商還在努力使其逆向供應鏈具有高度永續性,價值 50 億英鎊的退貨最終掩埋垃圾掩埋場。為了控制相關成本並改善客戶體驗,零售商正在嘗試多種策略。擁有實體店的零售商開始接受全通路退貨,允許顧客在現有的實體店退回網上購買的商品。自動宅配儲物櫃和智慧型手機應用程式等新技術正在創造更無縫的退貨體驗。然而,零售商仍然將退貨視為需要克服的重大挑戰和成本中心,這為逆向物流行業的所有參與企業創造了創新機會。
- 逆向物流比正向物流更為複雜。零售商正在尋找能夠提高效率並降低成本的運輸公司。根據行業調查,60% 的活躍網路購物表示免費退貨是良好退貨體驗的重要元素。
- 2018年,美國汽車業銷量達1,730萬輛,超過業界預期。美國汽車及汽車零件產業的逆向物流成本龐大。
- 此外,公司也正在尋求外包非傳統物流需求,如逆向物流、訂單履行、庫存管理、運輸和標籤/包裝。這預計將為物流服務供應商(LSP)創造更多機會。
美國逆向物流市場的趨勢
電子商務和技術的發展推動了對高效退貨物流的需求
電子商務的快速成長是美國物流和逆向物流的主要驅動力之一。 2017年,美國網路零售額達4,535億美元,較2016年的3,900億美元成長16%。實體店銷售額成長了3.4%。 2017年網路零售額佔社會消費品零售總額的8.9%。電子商務的持續成長導致包裹退回數量增加。隨著電子商務佔據零售市場的更大佔有率,整體零售退貨率可能會繼續上升,尤其是運輸退貨率的增加,對整個逆向供應鏈帶來壓力。
科技在逆向供應鏈的其他環節也扮演關鍵角色。一個受歡迎的軟體提供者是 Optoro。 Optoro 結合歷史定價和單一產品資料來提供演算法,告訴公司將每個退回的產品送到何處——最盈利的退貨處理路徑,無論是轉售、清算、修理還是回收。 Optoro 聲稱其智慧路線極大地提高了退貨庫存的盈利。
全通路退貨越來越受歡迎
另一個日益成長的趨勢是全通路退貨,商家允許消費者在店內退回網上商品,從而使退貨更加便利。 BORIS 退貨(網上購買,店內退貨)不僅可以為商家節省首英里退貨運費,還可以鼓勵額外購買。根據 UPS 的一項研究,66% 的網路購物購物者在店內退貨後會進行新的購買,而線上退貨的比例僅為 44%。除了對零售商來說很方便之外,58% 的電子商務購物者更願意在店內退貨,而不是透過郵寄。儘管存在這種偏好,但消費者仍然更有可能透過郵寄電子商務退貨,而不是將其帶到商店。宅配業者也在人口較多的地區擴大其實網路基地台。沃爾格林最近同意在其 7,500 家門市提供聯邦快遞包裹遞送服務。 UPS網路基地台透過 4,000 個地點組成的網路提供服務,其中包括乾洗店和便利商店。 Happy Returns 是新興企業,它使用購物中心和商店中的自助服務終端來收集和整合散裝退回的商品。我們為純線上零售商提供退貨收集的實體通路。零售商節省了運輸成本,客戶可以獲得快速退款,並且省去了包裝的麻煩。
美國逆向物流產業概況
由於電子商務領域的需求不斷增加和先進技術的進步,美國逆向物流市場環境的競爭日益激烈。零售商擴大求助於第三方物流(3PL)提供者來幫助他們建立高效的逆向物流業務。物流公司有能力解決退貨問題。這些公司可以利用其資本、規模和專業知識來解決零售商在商品通過逆向供應鏈時普遍遇到的痛點。這種情況吸引了參與企業和新參與企業更加關注退貨物流,從而加劇了市場競爭。當公司尋找新方法來獲得競爭優勢時,退貨能力可能是經常被忽視的潛在來源。更重視退貨管理的公司預計將提供更有效率、一致、快速的客戶體驗,從而獲得更好的服務、更高的盈利和更低的成本。
其他福利
- Excel 格式的市場預測 (ME) 表
- 3 個月的分析師支持
目錄
第 1 章 簡介
- 市場覆蓋
- 市場定義
- 執行摘要
第2章調查方法
- 調查結果
- 調查前提
- 分析方法
- 研究階段
第3章 市場洞察
- 當前市場狀況
- 技術趨勢和自動化(重點關注新興新Start-Ups)
- 研究改變消費行為和偏好
- 精選 -美國電子商務產業(當前狀況、趨勢、展望)
- 退貨成本如何影響零售業-分析師的看法
- 汽車逆向物流和售後市場概覽
- 全新全通路退貨回顧與說明
- 閉合迴路供應鏈洞察
第4章 市場動態
- 驅動程式
- 限制因素
- 機會
- 波特五力分析
- 產業價值鏈分析
第5章 市場區隔
- 按功能
- 運輸
- 路
- 航空
- 其他交通工具
- 倉儲業(儲存、配送、整合)
- 其他附加價值服務(退貨處理、補貨、整修、處置等)
- 運輸
- 按最終用戶
- 消費品和零售(電子商務、家用電子電器、服飾和服飾等)
- 車
- 醫療藥品
- 其他工業活動部門
- 其他
第6章 競爭格局
- 併購、合資、合作、協議
- 市場集中度概覽
- 主要企業策略
第7章 公司簡介
- United Parcel Service(UPS)
- FedEx Corporation
- United States Postal Service(USPS)
- XPO Logistics
- Newgistics Inc.
- Happy Returns Inc.
- American Distribution Inc.
- DHL
- FW Logistics
- YRC Worldwide Inc.
- DGD Transport
- A2B Fulfillment
- Optoro
- CH Robinson Worldwide Inc.
- Yusen Logistics
- Excelsior Integrated LLC
8. 了解價值鏈中的其他主要企業
第 9 章 附錄
- 經濟統計 - 運輸和倉儲業對經濟的貢獻
- 深入了解美國退貨最多的產品
- 對正向物流的定性和定量洞察
- 零售業佔 GDP 的比重
- 電子商務銷售額佔 GDP 的百分比
第10章 免責聲明
The US Reverse Logistics Market is expected to register a CAGR of greater than 11% during the forecast period.
Key Highlights
- Online shopping and sales continue to grow at a rapid pace. As retailers and delivery companies move increasing numbers of outbound packages, they must also address the issue of rising volume of return goods. Around USD 120 billion of e-commerce purchases were returned in 2017. Online purchased goods are three times more likely to be returned than those made in a general physical store. Though returns pose challenges for retailers, they find it challenging to limit returns because customers increasingly see returns as a critical part of online shopping experience. The reputation for fast, free, and friendly returns can earn customer loyalty, while a poor return experience can easily drive them away. With GBP 5 billion worth of returns ending up in landfills, apart from the waste from packaging, retailers are also struggling to make their reverse supply chains highly sustainable. To control the associated costs and improve customer experience, retailers are trying several strategies. Retailers with an existing physical presence have started embracing omnichannel returns, allowing returns of online purchases at existing physical stores. Emerging technologies, such as automated parcel lockers, and smartphone apps, are creating a more seamless return experience. However, retailers still see returns as a significant challenge to be overcome, and as a cost center, which has created opportunities for innovation for all players in the reverse logistics industry.
- Reverse logistics is more complicated than forward logistics. Retailers want shipping companies that create new efficiencies and cut costs. According to an industry survey, 60% of active online shoppers say that free returns are a vital part of a good returns experience.
- The US auto industry recorded the sales of 17.3 million vehicles in 2018, beating the industry expectations. Reverse logistics cost in the US auto and auto components industry is significant.
- Additionally, companies are looking to outsource non-traditional logistics requirements, such as reverse logistics, order processing, inventory management, distribution, and labeling and packaging. This is expected to provide more opportunities for logistics service providers (LSPs).
US Reverse Logistics Market Trends
Growth in E-commerce and Technology Propels the Demand for Efficient Return Logistics
The rapid growth in e-commerce is one of the major drivers of the forward and reverse logistics in the United States. In 2017, the online retail sales in the United States reached USD 453.5 billion, registering a growth rate of 16%, from USD 390 billion in 2016. The physical retail stores sales increased by 3.4%. The online retail sales accounted for 8.9% of the total retail sales, in 2017. The continuing surge of e-commerce was fueling a rise in the number of packages returned. As e-commerce grabs a greater share of the retail market, the overall retail return rate may continue to climb, especially the rate of goods returned via shipping, adding pressure to the entire reverse supply chain.
Technology is also playing a crucial role in other segments of the reverse supply chain. One popular software provider is Optoro, which combines historical pricing and individual product data into an algorithm that tells companies where they should route each return item, to the most profitable disposition path for a return, i.e., resale, liquidation, repair, recycling, or something else. Optoro claims that its smart routing dramatically improves the profitability of returned inventory.
Growing Popularity for Omnichannel Returns
Another growing trend is the omnichannel returns, in which merchants are making returns more convenient, by allowing consumers to return online items in physical locations. BORIS returns (buy online and return in store) not only save merchants the cost of first-mile return shipping, but also encourage additional purchases. According to a UPS survey, 66% of online shoppers made a new purchase when returning in store, compared to 44% when returning online. In addition to being better for retailers, 58% of e-commerce shoppers preferred to make returns at brick-and-mortar stores rather than mail them. Moreover, despite this preference, the shoppers are much more likely to ship their e-commerce returns than bring them to a store. Delivery companies are also expanding physical access points in high-population areas. Recently, Walgreens agreed to provide FedEx package pickup and delivery service at 7,500 stores. UPS Access Point offers services through a network of 4,000 locations, such as dry cleaners and convenience stores. Happy Returns is a startup that collects and aggregates loose return items at kiosks in malls or stores. It provides online-only retailers with a physical channel for collecting returns. Retailers save on shipping, customers get their refunds immediately and avoid the hassle of packing their item, and malls get additional foot traffic.
US Reverse Logistics Industry Overview
The reverse logistics market landscape of the United States is becoming highly competitive, with increasing demand from the e-commerce sector and evolution of advanced technologies. Retailers are increasingly turning toward third-party logistics (3PL) providers, to help them establish efficient reverse logistics operations. Logistics firms are well positioned to solve returns issues. These companies can take advantage of their capital, and scale and expertise to solve pain points commonly experienced by retailers, as goods move through the reverse supply chain. This scenario is attracting existing, as well as new player, to focus more on return logistics, thus making the market more competitive. As organizations seek new ways to gain competitive advantage, the often-overlooked returns function can be a potential source. Businesses that pay more attention to returns management are expected to obtain the benefits of delivering a more efficient, consistent, and responsive customer experience, and operate to cut costs, as well as enhance service and profitability.
Additional Benefits:
- The market estimate (ME) sheet in Excel format
- 3 months of analyst support
TABLE OF CONTENTS
1 INTRODUCTION
- 1.1 Scope of the Market
- 1.2 Market Definition
- 1.3 Executive Summary
2 RESEARCH METHODOLOGY
- 2.1 Study Deliverables
- 2.2 Study Assumptions
- 2.3 Analysis Methodology
- 2.4 Research Phases
3 MARKET INSIGHTS
- 3.1 Current Market Scenario
- 3.2 Technological Trends and Automation (In-depth Focus on Emerging Startups)
- 3.3 Study on Changing Consumer Behavior and Their Preferences
- 3.4 Spotlight - US E-commerce Industry (Current Scenario, Trends, and Outlook)
- 3.5 Impact of Cost of Returns on Retailers - Analyst's View
- 3.6 Brief on Automotive Reverse Logistics and Aftermarket
- 3.7 Review and Commentary on Emerging Omnichannel Returns
- 3.8 Insights on Closed-loop Supply Chain
4 MARKET DYNAMICS
- 4.1 Drivers
- 4.2 Restraints
- 4.3 Opportunities
- 4.4 Porter's Five Forces Analysis
- 4.5 Industry Value Chain Analysis
5 MARKET SEGMENTATION
- 5.1 By Function
- 5.1.1 Transportation
- 5.1.1.1 Road
- 5.1.1.2 Air
- 5.1.1.3 Other Modes of Transportation
- 5.1.2 Warehousing (Storage, Distribution, and Consolidation)
- 5.1.3 Other Value-added Services (Return Processing, Restocking, Refurbishment, Disposition, etc.)
- 5.1.1 Transportation
- 5.2 By End User
- 5.2.1 Consumer and Retail (Covers E-commerce, Consumer Electronics, Apparel and Garment Sectors, etc.)
- 5.2.2 Automotive
- 5.2.3 Healthcare and Pharmaceuticals
- 5.2.4 Other Industrial Activity Sectors
- 5.2.5 Other End Users
6 COMPETITIVE LANDSCAPE
- 6.1 Mergers and Acquisitions, Joint Ventures, Collaborations, and Agreements
- 6.2 Market Concentration Overview
- 6.3 Strategies Adopted by Major Players
7 COMPANY PROFILES
- 7.1 United Parcel Service (UPS)
- 7.2 FedEx Corporation
- 7.3 United States Postal Service (USPS)
- 7.4 XPO Logistics
- 7.5 Newgistics Inc.
- 7.6 Happy Returns Inc.
- 7.7 American Distribution Inc.
- 7.8 DHL
- 7.9 FW Logistics
- 7.10 YRC Worldwide Inc.
- 7.11 DGD Transport
- 7.12 A2B Fulfillment
- 7.13 Optoro
- 7.14 C.H. Robinson Worldwide Inc.
- 7.15 Yusen Logistics
- 7.16 Excelsior Integrated LLC
8 INSIGHTS ON OTHER KEY PLAYERS IN THE VALUE CHAIN
9 APPENDIX
- 9.1 Economic Statistics - Transport and Storage Sector, Contribution to Economy
- 9.2 Insights on Key Products Returned in the United States
- 9.3 Qualitative and Quantitative Insights on Forward Logistics
- 9.4 Retail Sector Share of GDP
- 9.5 E-commerce Sales as Share of GDP
10 DISCLAIMER
 2025 年至 2033 年逆向物流市場報告(依退貨類型、服務、最終用戶和地區)
 2025年逆向物流全球市場報告
 逆向物流市場規模、佔有率和成長分析(按退貨類型、服務、最終用戶產業和地區)- 產業預測 2025-2032
 逆向物流市場分析及預測至 2033 年:依類型、產品、服務、技術、應用、流程、部署、最終使用者及解決方案逆向物流市場機會、成長動力、產業趨勢分析與 2025 - 2034 年預測
 逆向物流的全球市場的評估:各退貨類型,各類服務,各終端用戶,各地區,機會,預測(2017年~2031年)
 全球逆向物流市場規模研究(按退貨類型、最終用戶和 2022-2032 年區域預測)
 逆向物流市場:依退貨類型、最終用戶分類:2023-2032 年全球機會分析與產業預測2024-2032 年按退貨類型、服務、最終用戶和地區分類的逆向物流市場報告
 全球逆向物流市場:市場規模和佔有率分析(依退貨類型、最終用戶和服務)、工業需求預測(截至2030年)