

 |
市場調查報告書
商品編碼
1708236
自動駕駛公車軟體市場機會、成長動力、產業趨勢分析及 2025 - 2034 年預測Autonomous Bus Software Market Opportunity, Growth Drivers, Industry Trend Analysis, and Forecast 2025 - 2034 |
||||||
2024 年全球自動駕駛公車軟體市場價值為 8.551 億美元,預計將大幅成長,2025 年至 2034 年的複合年成長率預計為 24.2%。強勁的市場擴張主要受到共享旅遊和按需交通服務需求激增的推動。隨著消費者越來越尋求靈活、經濟高效的出行解決方案,自動駕駛公車應運而生。這些公車透過調整路線來適應不斷變化的乘客需求,這與依賴固定路徑的傳統公共交通系統不同。這種適應性確保乘客獲得更便利、更實惠的交通選擇,使自動駕駛公車成為城市交通的理想選擇。
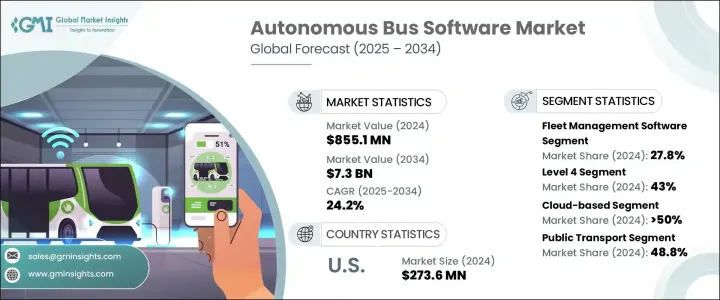
自動駕駛公車軟體市場根據功能進行分類,包括車隊管理、自動駕駛、交通管理、乘客管理、安全保障以及公車路線設計。 2024 年,車隊管理軟體領域佔據 27.8% 的市場。該軟體對於提升自動駕駛公車的營運效率至關重要。透過即時遠端監控、基於物聯網的維護預測、燃料消耗追蹤和路線最佳化,車隊管理系統使公車營運商能夠提高生產力、最大限度地減少停機時間並確保更順暢的營運。
| 市場範圍 | |
|---|---|
| 起始年份 | 2024 |
| 預測年份 | 2025-2034 |
| 起始值 | 8.551億美元 |
| 預測值 | 73億美元 |
| 複合年成長率 | 24.2% |
此外,自動駕駛公車軟體市場按自動化等級細分為 3 級、4 級和 5 級自動化。 2024 年,4 級自動駕駛公車佔了 43% 的市場。這些公車在預定區域內(例如商業區或智慧城市)完全自動駕駛。它們利用先進的人工智慧 (AI)、機器學習和預測分析來應對不同的道路狀況和交通模式,使其非常適合城市環境。隨著人工智慧技術的不斷完善,4 級自動駕駛公車的普及率預計將激增,尤其是在人口稠密的大都市地區。
2024 年,北美自動駕駛公車軟體市場佔全球市場佔有率的 38%。該地區對自動駕駛技術的投資,加上政府的支持政策,正在加速自動駕駛公車的開發和部署。一些城市已經啟動了試點計畫並取得了可喜的成果,預計將推動自動駕駛公車系統的更廣泛應用。隨著這些公車越來越融入公共交通,它們有可能減少排放,緩解交通堵塞,提高城市交通的整體效率,符合更永續、更智慧的交通系統的大趨勢。
目錄
第1章:方法論與範圍
- 研究設計
- 研究方法
- 資料收集方法
- 基礎估算與計算
- 基準年計算
- 市場估計的主要趨勢
- 預測模型
- 初步研究與驗證
- 主要來源
- 資料探勘來源
- 市場定義
第2章:執行摘要
第3章:行業洞察
- 產業生態系統分析
- 供應商格局
- OEM
- 軟體供應商
- 雲端服務供應商
- 系統整合商
- 最終用途
- 利潤率分析
- 技術與創新格局
- 專利分析
- 重要新聞和舉措
- 監管格局
- 衝擊力
- 成長動力
- 共享出行和按需交通的需求不斷成長
- 改善安全和交通管理
- 公眾意識和接受度不斷提高
- 人們對自動駕駛汽車的興趣日益濃厚
- 產業陷阱與挑戰
- 監管和法律挑戰
- 開發和營運成本高
- 成長動力
- 成長潛力分析
- 波特的分析
- PESTEL分析
第4章:競爭格局
- 介紹
- 公司市佔率分析
- 競爭定位矩陣
- 戰略展望矩陣
第5章:市場估計與預測:依功能分類,2021 - 2034 年
- 主要趨勢
- 車隊管理軟體
- 自動駕駛
- 交通管理
- 乘客管理
- 安全與保障
- 公車線路設計
第6章:市場估計與預測:依自動化程度,2021 - 2034 年
- 主要趨勢
- 3級
- 4級
- 5級
第7章:市場估計與預測:依部署模型,2021 - 2034 年
- 主要趨勢
- 本地
- 基於雲端
- 混合
第8章:市場估計與預測:按應用,2021 - 2034 年
- 主要趨勢
- 大眾運輸
- 校園和公司接駁車
- 機場接駁車
- 其他
第9章:市場估計與預測:依最終用途,2021 - 2034 年
- 主要趨勢
- 大眾運輸部門
- 私營運輸業者
- 企業車隊
第10章:市場估計與預測:按地區,2021 - 2034 年
- 主要趨勢
- 北美洲
- 美國
- 加拿大
- 歐洲
- 英國
- 德國
- 法國
- 西班牙
- 義大利
- 俄羅斯
- 北歐人
- 亞太地區
- 中國
- 印度
- 日本
- 韓國
- 澳新銀行
- 東南亞
- 拉丁美洲
- 巴西
- 墨西哥
- 阿根廷
- MEA
- 阿拉伯聯合大公國
- 南非
- 沙烏地阿拉伯
第 11 章:公司簡介
- Aurora
- Baidu Apollo
- EasyMile
- Imagry
- ioki
- Karsan
- LILEE Systems
- May Mobility
- Mobileye
- Navya
- NVIDIA
- Oxa
- T-Hive
- Via Transportation
- Volvo Bus
The Global Autonomous Bus Software Market was valued at USD 855.1 million in 2024 and is projected to witness substantial growth, with an expected CAGR of 24.2% from 2025 to 2034. This robust market expansion is primarily driven by the surging demand for shared mobility and on-demand transportation services. As consumers increasingly seek flexible, cost-effective travel solutions, autonomous buses emerge as a perfect response. These buses adapt to shifting passenger demands by adjusting routes, unlike traditional public transit systems that rely on fixed paths. This adaptability ensures that passengers receive more convenient and affordable transportation options, positioning autonomous buses as an ideal choice for urban mobility.
The market for autonomous bus software is categorized based on functionality, which includes fleet management, autonomous driving, traffic management, passenger management, safety and security, and bus route design. In 2024, the fleet management software segment accounted for a 27.8% market share. This software is essential in enhancing the operational efficiency of self-driving buses. Through real-time remote monitoring, IoT-based maintenance forecasting, fuel consumption tracking, and route optimization, fleet management systems enable bus operators to boost productivity, minimize downtime, and ensure smoother operations.
| Market Scope | |
|---|---|
| Start Year | 2024 |
| Forecast Year | 2025-2034 |
| Start Value | $855.1 Million |
| Forecast Value | $7.3 Billion |
| CAGR | 24.2% |
Further, the autonomous bus software market is segmented by automation levels-Level 3, Level 4, and Level 5 automation. The Level 4 autonomous buses held 43% of the market share in 2024. These buses are fully autonomous within predefined areas, such as business districts or smart cities. They leverage advanced artificial intelligence (AI), machine learning, and predictive analytics to navigate through varying road conditions and traffic patterns, making them highly suitable for urban environments. With the continued refinement of AI technologies, the adoption of Level 4 autonomous buses is expected to surge, especially in densely populated metropolitan areas.
North America Autonomous Bus Software Market accounted for 38% of the global market share in 2024. The region's investments in autonomous technology, coupled with supportive government policies, are accelerating the development and deployment of self-driving buses. Several cities are already launching pilot projects with promising results, which are expected to fuel the wider adoption of autonomous bus systems. As these buses become more integrated into public transportation, they offer the potential to reduce emissions, alleviate traffic congestion, and improve overall efficiency in urban mobility, aligning with the broader trend toward more sustainable, smart transportation systems.
Table of Contents
Chapter 1 Methodology & Scope
- 1.1 Research design
- 1.1.1 Research approach
- 1.1.2 Data collection methods
- 1.2 Base estimates and calculations
- 1.2.1 Base year calculation
- 1.2.2 Key trends for market estimates
- 1.3 Forecast model
- 1.4 Primary research & validation
- 1.4.1 Primary sources
- 1.4.2 Data mining sources
- 1.5 Market definitions
Chapter 2 Executive Summary
- 2.1 Industry 360º synopsis, 2021 - 2034
Chapter 3 Industry Insights
- 3.1 Industry ecosystem analysis
- 3.2 Supplier landscape
- 3.2.1 OEM
- 3.2.2 Software provider
- 3.2.3 Cloud service providers
- 3.2.4 System integrators
- 3.2.5 End Use
- 3.3 Profit margin analysis
- 3.4 Technology & innovation landscape
- 3.5 Patent analysis
- 3.6 Key news & initiatives
- 3.7 Regulatory landscape
- 3.8 Impact forces
- 3.8.1 Growth drivers
- 3.8.1.1 Rising demand for shared mobility and on-demand transport
- 3.8.1.2 Improved safety and traffic management
- 3.8.1.3 Growing public awareness and acceptance
- 3.8.1.4 Rising interest in autonomous vehicles
- 3.8.2 Industry pitfalls & challenges
- 3.8.2.1 Regulatory and legal challenges
- 3.8.2.2 High development and operational costs
- 3.8.1 Growth drivers
- 3.9 Growth potential analysis
- 3.10 Porter's analysis
- 3.11 PESTEL analysis
Chapter 4 Competitive Landscape, 2024
- 4.1 Introduction
- 4.2 Company market share analysis
- 4.3 Competitive positioning matrix
- 4.4 Strategic outlook matrix
Chapter 5 Market Estimates & Forecast, By Functionality, 2021 - 2034 ($Bn)
- 5.1 Key trends
- 5.2 Fleet management software
- 5.3 Autonomous driving
- 5.4 Traffic management
- 5.5 Passenger management
- 5.6 Safety & security
- 5.7 Bus route design
Chapter 6 Market Estimates & Forecast, By Level of Automation, 2021 - 2034 ($Bn)
- 6.1 Key trends
- 6.2 Level 3
- 6.3 Level 4
- 6.4 Level 5
Chapter 7 Market Estimates & Forecast, By Deployment Model, 2021 - 2034 ($Bn)
- 7.1 Key trends
- 7.2 On-premises
- 7.3 Cloud-based
- 7.4 Hybrid
Chapter 8 Market Estimates & Forecast, By Application, 2021 - 2034 ($Bn)
- 8.1 Key trends
- 8.2 Public transport
- 8.3 Campus and corporate shuttles
- 8.4 Airport shuttles
- 8.5 Others
Chapter 9 Market Estimates & Forecast, By End Use, 2021 - 2034 ($Bn)
- 9.1 Key trends
- 9.2 Public transportation authorities
- 9.3 Private transport operators
- 9.4 Corporate fleets
Chapter 10 Market Estimates & Forecast, By Region, 2021 - 2034 ($Bn)
- 10.1 Key trends
- 10.2 North America
- 10.2.1 U.S.
- 10.2.2 Canada
- 10.3 Europe
- 10.3.1 UK
- 10.3.2 Germany
- 10.3.3 France
- 10.3.4 Spain
- 10.3.5 Italy
- 10.3.6 Russia
- 10.3.7 Nordics
- 10.4 Asia Pacific
- 10.4.1 China
- 10.4.2 India
- 10.4.3 Japan
- 10.4.4 South Korea
- 10.4.5 ANZ
- 10.4.6 Southeast Asia
- 10.5 Latin America
- 10.5.1 Brazil
- 10.5.2 Mexico
- 10.5.3 Argentina
- 10.6 MEA
- 10.6.1 UAE
- 10.6.2 South Africa
- 10.6.3 Saudi Arabia
Chapter 11 Company Profiles
- 11.1 Aurora
- 11.2 Baidu Apollo
- 11.3 EasyMile
- 11.4 Imagry
- 11.5 ioki
- 11.6 Karsan
- 11.7 LILEE Systems
- 11.8 May Mobility
- 11.9 Mobileye
- 11.10 Navya
- 11.11 NVIDIA
- 11.12 Oxa
- 11.13 T-Hive
- 11.14 Via Transportation
- 11.15 Volvo Bus
 自動駕駛市場按組件、自動駕駛等級、動力傳動系統、車輛類型和最終用戶分類 - 2025-2030 年全球預測
 L3/L4自動駕駛和Start-Ups(2025年)
 自動駕駛軟體的全球市場:各自動駕駛等級,各軟體類型,各車輛類型,推動因素,各地區,機會,預測,2018年~2032年中國的E2E(End-to-End)自動駕駛產業(2024年~2025年)低速自動駕駛市場:按等級、速度、應用、車輛類型分類 - 2025-2030 年全球預測中國的獨立型OEM的ADAS與自動駕駛(2024年)自動駕駛軟體市場:按軟體、自動化程度、部署、車輛類型分類 - 2025-2030 年全球預測共享自動駕駛汽車市場:按車輛類型、車輛類型、服務類型、最終用戶、車主、自主程度、使用者介面、支付模式分類 - 2025-2030 年全球預測
 汽車閉迴路電流感測器市場機會、成長促進因素、產業趨勢分析與預測 2024 - 2032 年
 虛擬電控系統 (vECU) 的檢驗·原型製作·XiL解決方案