


 |
市場調查報告書
商品編碼
1636261
亞太地區貨櫃運輸:市場佔有率分析、產業趨勢與成長預測(2025-2030)Asia-Pacific Container Drayage - Market Share Analysis, Industry Trends & Statistics, Growth Forecasts (2025 - 2030) |
||||||
※ 本網頁內容可能與最新版本有所差異。詳細情況請與我們聯繫。
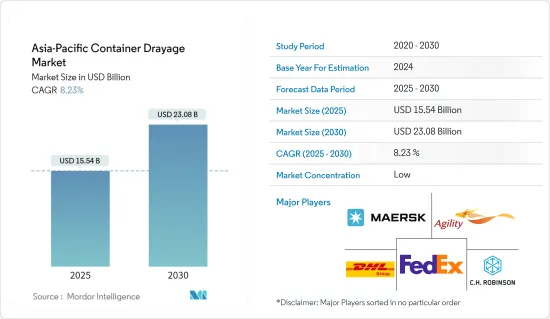
預計2025年亞太貨櫃短駁市場規模為155.4億美元,2030年將達230.8億美元,預測期內(2025-2030年)複合年成長率為8.23%。
主要亮點
- 亞太地區的貨櫃拖運市場主要是由快速的貿易活動導致的海運貨櫃需求激增所推動的。由於亞太地區廣闊的海岸線和製造商主要集中在中國,亞太地區對貨櫃的需求正在成長。此外,隨著該地區各國政府加強舉措,以及印度和印尼等尚未開發的市場前景廣闊,未來市場可能會成長。
- 全球前25大港口中有18個位於亞洲,亞洲國家在貨物裝卸方面保持主導地位。資料來自世界銀行和標準普爾世界市場情報的貨櫃港口績效指數(CPPI),據透露,東亞擁有11個頂級港口,而西亞擁有11個頂級港口。
- 2023年第二季度,全球互聯互通情勢由以中國為首的亞洲經濟體主導。韓國、新加坡和馬來西亞也緊跟在後。這些國家的班輪連通指數(LSCI)與前一年同期比較上漲3%至5%,創歷史新高。
- 2023年,在強勁的貨物需求和對海上貿易的嚴重依賴的支撐下,中國在亞太海運貨櫃市場佔據主導地位。雖然貨運需求快速成長和貿易協定的締結等因素提振了市場,但運輸和庫存成本的波動正成為一個挑戰。然而,隨著海上運輸的自動化趨勢和嚴格的安全標準提供了更多機會,市場有望成長。
亞太貨櫃短駁市場趨勢
亞洲主要樞紐港口擁塞緩解以及貨櫃拖運需求快速成長帶動運輸板塊
- 到2024年6月,北亞和東南亞主要港口的船舶延誤率將大幅減少,中國的運能運轉率也將提高。然而,航運公司和貨運代理的報告突顯了印度日益惡化的擁塞情況。亞洲航運業高層強調,雖然新加坡、寧波、青島和馬來西亞巴生等港口的船舶延誤情況減少,但貨櫃拖運的需求卻在增加。
- 新加坡的壅塞情況略有緩解,承運人轉向巴生港和丹絨伯拉巴斯港等馬來西亞港口。特別是,2024 年上半年丹絨伯拉帕斯的貨櫃裝卸量增加了 20%,部分原因是從新加坡轉移。同樣,巴生北港2024年5月的貨櫃吞吐量與前一年同期比較增26%至335,361標準箱。
- 新加坡的等待時間逐漸改善至2-3天,雖然等待時間有所減少,但根據運輸公司和服務的不同,等待時間差異很大。特別值得注意的是亞太一號航班的延誤,主要原因是新加坡嚴重擁擠。到 2024 年 5 月底為止,延誤時間最高峰為 8 天,但此後,一些 FP1 航線的延誤時間已減少至最多 5 天。
- 據赫伯羅特稱,在其他地方,等待時間已從 2024 年 4 月底的最多三天減少到寧波的兩天,青島的不到 24 小時。新加坡資料顯示,等待靠泊的船舶數量有所改善,從 2024 年 6 月 15 日的 350,281 個標準箱減少到 6 月底的 286,778 個標準箱。然而,自2024年5月上旬以來,等待停泊的船舶總量一直在增加。
- 中國的產能運轉率顯示出改善的跡象,特別是大連港和台灣港等20英尺貨櫃港口,但華中地區,尤其是武漢等地區的產能利用率仍然明顯緊張。與此同時,印度主要貨櫃門戶蒙德拉由於轉運量增加而面臨越來越大的壓力。一些往返於新加坡和杜拜之間的航空公司已經減少了在蒙德拉的營運,轉而選擇其他亞洲港口。
- 最近的貿易更新顯示,由於繁忙的貨櫃存放場的進口清關延誤,貨櫃在蒙德拉的停留時間顯著增加。印度貨櫃鐵路營運商(CTO)指責蒙德拉港擾亂了火車週轉,導致進口商收取額外費用。據 CTO 消息人士透露,鐵路貨場的停留時間從通常的 7 到 9 天增加了一倍,現在平均為 15 到 20 天。特別是,蒙德拉大約一半的交通是透過鐵路運輸的。
- 隨著情況惡化,貨櫃列車營運商協會建議港務局可以宣布不可抗力。同時,印度貨櫃運輸協會(印度)已呼籲港口迅速採取行動,確保貨物暢通。
中國貿易需求快速成長帶動市場
- 美國零售庫存與銷售成長:2024年1月至4月,美國零售庫存穩定成長,從7,693億美元增至7,935億美元。汽車、建材等產業增幅尤為顯著。
- 零售額持續成長:2024年5月美國零售額較上季成長0.1%,與前一年同期比較去年同期成長2.3%。不包括汽車經銷商、加油站和餐廳的核心零售額較上季成長 0.3%,與前一年同期比較去年同期成長 2.9%。這些數字接近 NRF 預計的 2024 年 2.5% 至 3.5% 的成長率。
- 美國零售庫存的激增,尤其是汽車和建材行業的庫存,顯示對貨櫃拖運服務的強勁需求。這一成長將增加對來自重要製造地中國的貨櫃運輸的需求。
- 2024年前4個月,中國港口吞吐量達到驚人的1,0403萬標箱,較去年同期成長9%。同時,外貿貨運量比去年同期成長9.1%。
- 特別值得注意的是,2024年整體貨物吞吐量達到55.5億噸,比上年增加5.2%。
亞太地區貨櫃短駁產業概況
亞太地區的貨櫃短駁市場較為分散。市場的主要企業包括馬士基亞亞太公司、Agility、CH Robinson Worldwide Inc.、聯邦快遞公司、德國郵政敦豪集團等。
主要企業正專注於各個策略領域以保持競爭力。人們越來越重視業務流程的數位轉型和自動化,以提高效率並降低業務成本。
其他好處
- Excel 格式的市場預測 (ME) 表
- 3 個月分析師支持
目錄
第1章簡介
- 研究成果
- 研究場所
- 調查範圍
第2章調查方法
第3章執行摘要
第4章市場動態與洞察
- 目前的市場狀況
- 市場動態
- 促進因素
- 鐵路貿易量增加
- 電子商務領域的成長
- 抑制因素
- 港口壅塞導致貨物收出貨延誤
- 可避免成本的風險
- 機會
- 市場驅動的技術進步
- 促進因素
- 產業吸引力-波特五力分析
- 新進入者的威脅
- 買家/消費者的議價能力
- 供應商的議價能力
- 替代品的威脅
- 競爭公司之間的敵對關係
- 價值鏈/供應鏈分析
- 洞察行業法規政策
- 對技術整合的見解
- 亞太電商產業洞察
- 亞太貨櫃資料概覽
- 聚焦 - 貨運成本/運費
- COVID-19 對市場的影響
第5章市場區隔
- 按運輸方式
- 鐵路
- 路
- 其他交通方式
- 按地區
- 中國
- 日本
- 印度
- 韓國
- 印尼
- 越南
- 澳洲
- 其他亞太地區
第6章 競爭狀況
- 市場集中度概覽
- 公司簡介
- Maersk Asia Pacific
- Agility
- CH Robinson Worldwide Inc.
- FedEx Corp.
- Deutsche Post DHL Group
- Hitachi Ltd
- CMA CGM SA Group
- DB Schenker
- United Parcel Services Inc.
- Ceva Logistics
- Yusen Logistics Co. Ltd*
- 其他公司
第7章 市場未來展望
第8章附錄
- 總體經濟指標
- 資本流動洞察(運輸和倉儲產業投資)
- 對外貿易統計
The Asia-Pacific Container Drayage Market size is estimated at USD 15.54 billion in 2025, and is expected to reach USD 23.08 billion by 2030, at a CAGR of 8.23% during the forecast period (2025-2030).
Key Highlights
- The Asia-Pacific container drayage market is mainly driven by the surge in demand for shipping containers due to rapid trade activities. Asia-Pacific, bolstered by its expansive coastal lines and a concentration of manufacturers, particularly in China, is witnessing heightened demand for these containers. Moreover, as governments in regional countries ramp up initiatives and untapped markets like India and Indonesia show promise, future market growth looks promising.
- Asian countries maintain their dominance in cargo handling, with 18 of the top 25 global ports located in Asia. This data, sourced from the Container Port Performance Index (CPPI) by the World Bank and S&P Global Market Intelligence, highlights that Eastern Asia boasts 11 of these top ports, while Western Asia hosts four.
- Asian economies dominated the global connectivity landscape in Q2 2023, with China leading the market. The Republic of Korea, Singapore, and Malaysia followed closely. Each of these nations saw their Liner Shipping Connectivity Index (LSCI) rise by 3% to 5% compared to the previous year, hitting all-time highs in their index values.
- In 2023, China dominated the Asia-Pacific shipping container market, underpinned by its robust demand for commodities and heavy reliance on seaborne trade. While factors like a surge in cargo transportation demand and trade agreements bolster the market, fluctuations in transportation and inventory costs pose challenges. However, the market is poised for growth, with automation trends in marine transportation and heightened safety norms offering further opportunities.
Asia-Pacific Container Drayage Market Trends
Port Congestion Easing in Key Asian Hubs, Surge in Demand for Container Drayage Driving the Transportation Segment
- By June 2024, major ports in North and Southeast Asia have seen a notable drop in vessel delays, with China also marking an uptick in equipment availability. However, reports from ocean carriers and forwarders underscore a mounting congestion challenge in India. Executives in the shipping industry across Asia have highlighted that while ports like Singapore, Ningbo, Qingdao, and Klang in Malaysia are witnessing fewer vessel delays, the demand for container drayages is on the rise.
- Although congestion in Singapore has slightly alleviated, carriers are increasingly turning to Malaysian ports like Klang and Tanjung Pelepas. Tanjung Pelepas, in particular, saw a 20% surge in container volumes in the first half of 2024, partly due to diversions from Singapore. Similarly, Northport in Klang recorded a notable 26% uptick in container volumes in May 2024, reaching 335,361 TEUs compared to the previous year, largely fueled by ad-hoc carrier calls.
- While there has been a modest improvement in wait times in Singapore, ranging from two to three days, the wait times, though reduced, still vary significantly based on the carrier and service. Notably, research highlighted delays in the Asia-Europe Far East Pacific 1 service, primarily due to severe congestion in Singapore. Although delays peaked at eight days by the end of May 2024, they have since reduced to a maximum of five days on some FP1 sailings.
- Elsewhere, Hapag-Lloyd reported that wait times had decreased to two days in Ningbo and less than 24 hours in Qingdao, compared to up to three days at the end of April 2024. Data indicates an improvement in Singapore, with vessels waiting at anchorage dropping from 350,281 TEUs on June 15, 2024, to 286,778 TEUs by the end of June. However, the total capacity waiting to berth has seen an uptick since early May 2024.
- While equipment availability in China has shown signs of improvement, especially in ports like Dalian and Taiwanese ports for 20-foot containers, there is still a noticeable tightness in central China, particularly in areas like Wuhan. On the other hand, Mundra, India's primary container gateway, is grappling with mounting pressure from escalating transshipment volumes. Some carriers plying between Singapore and Dubai have curtailed sailings at Mundra to prioritize other Asian ports.
- Recent trade updates underscore that container dwell times at Mundra have significantly lengthened, attributed to sluggish import clearance in congested container yards. Indian container rail operators (CTOs) are pointing fingers at the port for train turnaround disruptions, leading to additional charges for importers. CTO sources reveal that yard backlogs for railed freight have doubled, now averaging 15 to 20 days, up from the usual seven to nine days. Notably, approximately half of Mundra's traffic is rail-bound.
- With the circumstances escalating, the Association of Container Train Operators has hinted at a potential force majeure declaration from the port authority. Simultaneously, the Container Shipping Lines Association (India) is urging swift action from the port to smoothen cargo flows.
Surge in Demand for Trade in China Driving the Market
- US Retail Inventories and Sales Growth: From January to April 2024, US retail inventories climbed steadily, starting at USD 769.3 billion and reaching USD 793.5 billion. Notably, sectors like motor vehicles and building materials saw pronounced upticks.
- Continued Retail Sales Growth: In May 2024, retail sales in the United States inched up by 0.1% from the previous month and 2.3% from the prior year. Core retail sales, which exclude automobile dealers, gasoline stations, and restaurants, saw a 0.3% monthly increase and a 2.9% yearly rise. These figures closely mirror the NRF's projected 2.5% to 3.5% growth for 2024.
- The surge in US retail inventories, especially in motor vehicles and building materials industries, signals a robust demand for container shipping services. This uptick is poised to drive an increased necessity for container shipments from China, a pivotal manufacturing hub.
- China's ports, recording a 9% Y-o-Y surge, processed a staggering 104.03 million TEUs in the initial four months of 2024. Simultaneously, foreign trade cargo saw a 9.1% Y-o-Y upswing.
- Noteworthy is the overall cargo throughput, which hit 5.55 billion tonnes in 2024, marking a 5.2% uptick from the preceding year's figures.
Asia-Pacific Container Drayage Industry Overview
The Asia-Pacific container drayage market is fragmented. Key players in this market include Maersk Asia Pacific, Agility, C H Robinson Worldwide Inc., FedEx Corp., and Deutsche Post DHL Group.
The leading companies are focusing on various strategic areas to maintain their competitive edge. Digital transformation and automation in operational processes are increasingly emphasized to improve efficiency and reduce operational costs.
Additional Benefits:
- The market estimate (ME) sheet in Excel format
- 3 months of analyst support
TABLE OF CONTENTS
1 INTRODUCTION
- 1.1 Study Deliverables
- 1.2 Study Assumptions
- 1.3 Scope of the Study
2 RESEARCH METHODOLOGY
3 EXECUTIVE SUMMARY
4 MARKET DYNAMICS AND INSIGHTS
- 4.1 Current Market Scenario
- 4.2 Market Dynamics
- 4.2.1 Drivers
- 4.2.1.1 Increasing Railway Trade
- 4.2.1.2 Growing E-commerce Sector
- 4.2.2 Restraints
- 4.2.2.1 Port Congestion Delaying Cargo Pick-up and Delivery
- 4.2.2.2 Risk of Incurring Avoidable Costs
- 4.2.3 Opportunities
- 4.2.3.1 Technological Advancements Driving the Market
- 4.2.1 Drivers
- 4.3 Industry Attractiveness - Porter's Five Forces Analysis
- 4.3.1 Threat of New Entrants
- 4.3.2 Bargaining Power of Buyers/Consumers
- 4.3.3 Bargaining Power of Suppliers
- 4.3.4 Threat of Substitute Products
- 4.3.5 Intensity of Competitive Rivalry
- 4.4 Value Chain/Supply Chain Analysis
- 4.5 Insights into Industry Policies and Regulations
- 4.6 Insights into Technological Integration
- 4.7 Insights into E-commerce Industry in Asia-Pacific
- 4.8 Brief on Asia-Pacific Container Datapoints
- 4.9 Spotlight - Freight Transportation Costs/Freight Rates
- 4.10 Impact of COVID-19 on the Market
5 MARKET SEGMENTATION
- 5.1 By Mode of Transport
- 5.1.1 Rail
- 5.1.2 Road
- 5.1.3 Other Modes of Transport
- 5.2 By Geography
- 5.2.1 China
- 5.2.2 Japan
- 5.2.3 India
- 5.2.4 South Korea
- 5.2.5 Indonesia
- 5.2.6 Vietnam
- 5.2.7 Australia
- 5.2.8 Rest of Asia-Pacific
6 COMPETITIVE LANDSCAPE
- 6.1 Market Concentration Overview
- 6.2 Company Profiles
- 6.2.1 Maersk Asia Pacific
- 6.2.2 Agility
- 6.2.3 C H Robinson Worldwide Inc.
- 6.2.4 FedEx Corp.
- 6.2.5 Deutsche Post DHL Group
- 6.2.6 Hitachi Ltd
- 6.2.7 CMA CGM SA Group
- 6.2.8 DB Schenker
- 6.2.9 United Parcel Services Inc.
- 6.2.10 Ceva Logistics
- 6.2.11 Yusen Logistics Co. Ltd*
- 6.3 Other Companies
7 FUTURE OUTLOOK OF THE MARKET
8 APPENDIX
- 8.1 Macroeconomic Indicators
- 8.2 Insight into Capital Flows (Investments in Transport and Storage Sectors)
- 8.3 External Trade Statistics
 2025 年至 2033 年聯運貨運市場報告(按組件、運輸方式、最終用戶和地區分類)
 2025 年至 2029 年全球多式聯運貨運市場
 多式聯運:市場佔有率分析、產業趨勢/統計、成長預測(2025-2030)多式聯運貨運市場:按組件、解決方案、模式和最終用戶行業分類 - 2025-2030 年全球預測
 長型車輛市場報告:趨勢、預測和競爭分析(至 2030 年)
 2024 年多式聯運全球市場報告
 到 2030 年陸路運輸重型車輛市場預測:按車輛類型、燃料類型、車身類型、技術、最終用戶和地區進行的全球分析
 多式聯運市場規模、佔有率和趨勢分析報告:2024-2030 年按類型、營運、服務、最終用途、地區和細分市場進行的預測多式聯運貨運市場,按類型和最終用戶產業分類:2023-2032 年全球機會分析與產業預測多式聯運貨運市場報告:2030 年趨勢、預測與競爭分析