


 |
市場調查報告書
商品編碼
1639396
美國可再生能源:市場佔有率分析、產業趨勢與統計、成長預測(2025-2030)United States Renewable Energy - Market Share Analysis, Industry Trends & Statistics, Growth Forecasts (2025 - 2030) |
||||||
價格
※ 本網頁內容可能與最新版本有所差異。詳細情況請與我們聯繫。
簡介目錄
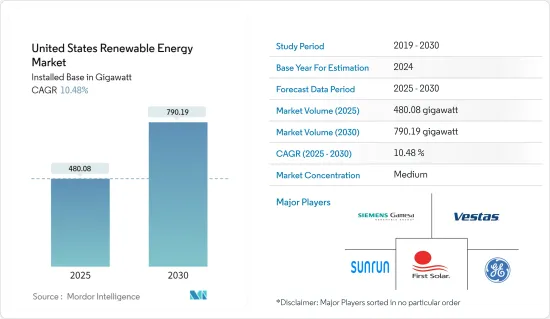
美國可再生能源市場裝置規模預計將從2025年的480.08吉瓦成長到2030年的790.19吉瓦,預測期間(2025-2030年)複合年成長率為10.48%。
主要亮點
- 從中期來看,太陽能和風電安裝量增加、政府支持措施、太陽能板成本降低以及可再生能源額外補貼等因素將推動預測期內可再生能源市場的發展。
- 同時,蓬勃發展的天然氣市場與可再生能源的競爭以及可變再生能源來源的能源供應有限等因素預計將在預測期內抑制美國可再生能源市場。
- 美國政府宣布了一項投資5550億美元清潔能源項目的框架。預計這將是該國可再生能源市場的機會。
美國可再生能源市場趨勢
太陽能正在經歷顯著成長
- 隨著其變得越來越容易獲得和普及,美國太陽能產業將在 2023 年達到新的高度。據太陽能產業協會(SEIA)稱,美國太陽能產業將在2023年達到一個重要里程碑,新增發電容量達3,240萬千瓦。
- 這一成長體現在所有太陽能發電市場領域,全國總設備容量達到約188吉瓦。公用事業規模的產業發揮了關鍵作用,貢獻了 22.5GW 的新增產能,而大約 80 萬美國公民在家中安裝了太陽能系統。
- 美國的目標是到2025年平均每年安裝3000萬千瓦的太陽能發電容量,併計劃從2025年到2030年將其增加到每年6000萬千瓦。這項雄心勃勃的目標預計將迅速發展光伏(PV)市場,到2034年光伏累積設備容量將達到673吉瓦,預計可為超過1億個住宅供電。
- 支持這項成長的著名計劃是 Terra-Gen 和 Mortenson 於 2024 年 1 月推出的 Edwards & Sanborn 太陽能 + 儲能計劃。這項大型可再生能源專案佔地 4,600 英畝,包括 190 萬塊 First Solar 電池板、875 兆瓦直流 (MWdc) 太陽能容量和約 3.3 吉瓦時 (GWh)能源儲存。它還擁有1.3GW的互聯容量,使其成為美國最大的。
- 太陽能產業的快速成長得益於政府的有利政策,例如太陽能投資稅額扣抵、成本下降以及私營和公共部門對綠能的需求不斷增加。
- 例如,2023年6月,美國環保署(EPA)在拜登總統的「投資美國」計劃下發起了70億美元的津貼競賽。該計劃旨在增加數百萬低收入家庭獲得廉價、清潔太陽能的機會。由《減少通貨膨脹法案》設立的溫室氣體減排基金資助的「全民太陽能」競賽將制定和製定計劃,為服務不足和低收入人群提供住宅太陽能發電支持。提供最多60 筆贈款。
- 進一步證明了這一勢頭,2023 年 4 月,維吉尼亞州公司委員會 (SCC) 宣布增加約 20 個太陽能發電和能源儲存計劃,以滿足 Dominion Energy 維吉尼亞客戶核准成長的需求。一旦完成,計劃將產生超過 800 兆瓦 (MW) 的無碳電力,足以為維吉尼亞州約 20 萬戶家庭提供運作供電。由於可再生能源不需要燃料,預計消費者在前 10 年可節省超過 2.5 億美元的汽油費用。
- 因此,預計該領域投資的增加將在預測期內推動美國可再生能源市場的發展。
政府扶持措施促進市場需求
- 稅額扣抵、補貼和津貼等政府措施可以顯著降低可再生能源部署的初始成本。這些激勵措施使可再生能源計劃在財務上更加可行並對投資者更具吸引力,從而促進市場成長。
- 例如,美國農業部 (USDA) 於 2023 年 3 月宣布,將從 2023 年 4 月 1 日起開始接受價值 10 億美元的補助申請。這些補助金專門用於支持農業生產者和農村中小企業投資可再生能源系統並實施能源效率改進。
- 2021年,美國承諾2030年溫室氣體排放量將比2005年減少50%至52%。美國也承諾到2050年向碳中和經濟轉型。
- 由於這些支持措施,近年來美國可再生能源裝置容量大幅成長。根據美國能源資訊署的數據,可再生能源發電約佔總發電量的23%。由於政府對可再生能源進行各種競標,預計裝置容量將進一步增加。
- 例如,2023年6月,內政部土地管理局對內華達州公用事業規模太陽能開發進行了競標,最高競標為1.0515億美元。此次拍賣包括阿馬戈薩沙漠中佔地 23,675 英畝的四塊地塊,預計將為電網增加約 3 吉瓦的可再生能源。
- 此外,美國內政部於 2024 年 4 月公佈了兩項擬議的離岸風力發電競標,一項位於奧勒岡州州海岸,另一項位於緬因灣。
- 因此,政府的支持措施預計將在預測期內推動美國可再生能源市場的發展。
美國可再生能源產業概況
美國可再生能源市場較為分散。市場的主要企業包括(排名不分先後)維斯塔斯風力系統公司、西門子歌美颯可再生能源公司、通用電氣公司、第一太陽能公司和Sunrun公司。
其他好處
- Excel 格式的市場預測 (ME) 表
- 3 個月分析師支持
目錄
第1章簡介
- 調查範圍
- 市場定義
- 研究場所
第 2 章執行摘要
第3章調查方法
第4章市場概況
- 介紹
- 2029年可再生能源裝置容量及預測(單位:GW)
- 可再生能源結構 (美國, 2023)
- 最新趨勢和發展
- 政府法規和措施
- 市場動態
- 促進因素
- 政府支持措施和獎勵
- 環境問題
- 抑制因素
- 石化燃料補貼
- 促進因素
- 供應鏈分析
- PESTLE分析
第5章 市場區隔(按電源)
- 風力
- 陽光
- 水力發電
- 生質能源
- 其他能源(地熱和可再生城市廢棄物)
第6章 競爭狀況
- 併購、合資、聯盟、協議
- 主要企業策略
- 公司簡介
- General Electric Company
- First Solar Inc.
- Sunrun Inc.
- NextEra Energy Inc.
- Vestas Wind Systems AS
- Mitsubishi Heavy Industries Ltd
- Siemens Gamesa Renewable Energy SA
- Canadian Solar Inc
- Trina Solar Co. Ltd
- JinkoSolar Holding Co. Ltd
- 市場排名/佔有率(%)分析
第7章 市場機會及未來趨勢
- 整合能源儲存技術
簡介目錄
Product Code: 49226
The United States Renewable Energy Market size in terms of installed base is expected to grow from 480.08 gigawatt in 2025 to 790.19 gigawatt by 2030, at a CAGR of 10.48% during the forecast period (2025-2030).
Key Highlights
- Over the medium term, factors such as increasing solar and wind energy installations, supportive government policies, declining solar panel costs, and additional subsidies on renewables are expected to drive the renewable energy market during the forecast period.
- On the other hand, factors like a booming natural gas market competing with renewable energy and the limited energy supply from variable renewable energy sources are a few factors expected to restrain the US renewable energy market during the forecast period.
- Nevertheless, the US government announced a framework to invest USD 555 billion in funding for clean energy programs. This is expected to be an opportunity for the country's renewable energy market.
United States Renewable Energy Market Trends
Solar Energy to Witness Significant Growth
- The solar power industry in the United States has become increasingly accessible and widespread, reaching new heights in 2023. According to the Solar Energy Industries Association (SEIA), the US solar industry added an impressive 32.4 GW of new electric generating capacity in 2023, marking a significant milestone.
- This growth was observed across all solar market segments, leading to a total installed capacity of around 188 GW nationwide. The utility-scale industry played a crucial role, contributing 22.5 GW of new capacity, while nearly 800,000 US citizens installed solar systems in their homes.
- The United States aims to install an average of 30 GW of solar capacity annually until 2025, with plans to ramp up to 60 GW per year from 2025 to 2030. This ambitious goal is expected to drive rapid development in the solar photovoltaic (PV) market, with cumulative solar installed capacity expected to reach 673 GW by 2034, enough to power over 100 million homes.
- A notable project underscoring this growth is the Edwards & Sanborn Solar + Energy Storage project, launched by Terra-Gen and Mortenson in January 2024. This massive renewable energy endeavor spans 4,600 acres and includes 1.9 million First Solar panels, with a solar capacity of 875 megawatts direct current (MWdc) and nearly 3.3 gigawatt-hours (GWh) of energy storage. It also features a 1.3 GW interconnection capacity, making it the largest in the United States.
- The solar energy industry's rapid growth can be attributed to favorable government policies, such as the Solar Investment Tax Credit, declining costs, and increasing demand for clean electricity across private and public sectors.
- For instance, in June 2023, the US Environmental Protection Agency (EPA) launched a USD 7 billion grant competition under President Biden's Investing in America initiative. This program aims to enhance access to affordable, clean solar energy for millions of low-income households. The Solar for All competition, funded by the Greenhouse Gas Reduction Fund established by the Inflation Reduction Act, will award up to 60 grants to various entities, including states, municipalities, tribal governments, and nonprofit organizations, to develop and expand programs that support residential solar in underserved and low-income communities.
- Further illustrating this momentum, in April 2023, the Virginia State Corporation Commission (SCC) approved almost two dozen additional solar and energy storage projects to help meet the expanding needs of Dominion Energy Virginia customers. When completed, the projects will generate more than 800 megawatts (MW) of carbon-free electricity, which will be enough to power about 200,000 Virginian homes at full capacity. Consumers are expected to save more than USD 250 million in gasoline over the first ten years of operation because renewable energy does not require fuel.
- Therefore, increasing investments in the sector are expected to drive the US renewable energy market during the forecast period.
Supportive Government Policies to Drive Market Demand
- Government policies, such as tax credits, grants, and subsidies, can significantly reduce the upfront costs of renewable energy installations. These incentives make renewable energy projects more financially viable and attractive to investors, driving market growth.
- For instance, in March 2023, the US Department of Agriculture (USDA) revealed that starting from April 1, applications would be accepted for grants worth USD 1 billion. These grants specifically aim to assist agricultural producers and rural small businesses in investing in renewable energy systems and implement energy-efficiency improvements.
- In 2021, the United States committed to achieving a 50% to 52% reduction in greenhouse gas pollution compared to 2005 levels by 2030. The United States has also pledged to transition to a carbon-neutral economy by 2050.
- With these supportive policies, the installed capacities of renewable energy have grown significantly in recent years in the country. According to the US Energy Information Administration, the electricity generated through renewable energy was around 23% of the total electricity generated. This capacity is expected to increase further due to the government's various auctions for renewable energy.
- For instance, in June 2023, under the Department of the Interior, the Bureau of Land Management conducted an auction for utility-scale solar energy development in Nevada, raising USD 105.15 million in top bids. The auction involved four parcels spanning 23,675 acres in the Amargosa Desert, potentially adding nearly 3 GW of renewable energy to the electrical grid.
- Further, in April 2024, the US Department of the Interior revealed two proposed auctions for offshore wind energy development, one off the coast of Oregon and the other in the Gulf of Maine.
- Therefore, supportive government policies are expected to drive the renewable energy market in the United States during the forecast period.
United States Renewable Energy Industry Overview
The US renewable energy market is fragmented. Some of the major players in the market (in no particular order) include Vestas Wind Systems AS, Siemens Gamesa Renewable Energy SA, General Electric Company, First Solar Inc., and Sunrun Inc.
Additional Benefits:
- The market estimate (ME) sheet in Excel format
- 3 months of analyst support
TABLE OF CONTENTS
1 INTRODUCTION
- 1.1 Scope of the Study
- 1.2 Market Definition
- 1.3 Study Assumption
2 EXECUTIVE SUMMARY
3 RESEARCH METHODOLOGY
4 MARKET OVERVIEW
- 4.1 Introduction
- 4.2 Renewable Energy Installed Capacity and Forecast in GW, till 2029
- 4.3 Renewable Energy Mix, United States, 2023
- 4.4 Recent Trends and Developments
- 4.5 Government Policies and Regulations
- 4.6 Market Dynamics
- 4.6.1 Drivers
- 4.6.1.1 Supportive Government Policies and Incentives
- 4.6.1.2 Environmental Concerns
- 4.6.2 Restraints
- 4.6.2.1 Fossil Fuel Subsidies
- 4.6.1 Drivers
- 4.7 Supply Chain Analysis
- 4.8 PESTLE Analysis
5 MARKET SEGMENTATION - BY SOURCE
- 5.1 Wind
- 5.2 Solar
- 5.3 Hydropower
- 5.4 Bioenergy
- 5.5 Other Sources (Geothermal and Renewable Municipal Waste)
6 COMPETITIVE LANDSCAPE
- 6.1 Mergers and Acquisitions, Joint Ventures, Collaborations, and Agreements
- 6.2 Strategies Adopted by Leading Players
- 6.3 Company Profiles
- 6.3.1 General Electric Company
- 6.3.2 First Solar Inc.
- 6.3.3 Sunrun Inc.
- 6.3.4 NextEra Energy Inc.
- 6.3.5 Vestas Wind Systems AS
- 6.3.6 Mitsubishi Heavy Industries Ltd
- 6.3.7 Siemens Gamesa Renewable Energy SA
- 6.3.8 Canadian Solar Inc
- 6.3.9 Trina Solar Co. Ltd
- 6.3.10 JinkoSolar Holding Co. Ltd
- 6.4 Market Ranking/Share(%) Analysis
7 MARKET OPPORTUNITIES AND FUTURE TRENDS
- 7.1 Integration of Energy Storage Technologies
02-2729-4219
+886-2-2729-4219
 2025-2029 年全球可再生能源市場
 美國的再生能源證書市場評估:各類能源,各容量,各最終用途,各地區,機會,預測,2018年~2032年
 全球再生能源證書(REC)市場評估:依能源類型、容量、最終用途、地區、機會和預測(2018-2032年)
 全球再生能源證書市場 - 2025 - 2032
 北歐可再生能源 -市場佔有率分析、行業趨勢和統計、成長預測(2025-2030 年)
 南亞可再生能源 -市場佔有率分析、行業趨勢和統計、成長預測(2025-2030 年)
 德國可再生能源:市場佔有率分析、產業趨勢與統計、成長預測(2025-2030 年)
 東南亞可再生能源 -市場佔有率分析、產業趨勢與統計、成長預測(2025-2030)
 東歐可再生能源 -市場佔有率分析、產業趨勢與統計、成長預測(2025-2030)
 東非可再生能源 -市場佔有率分析、產業趨勢與統計、成長預測(2025-2030)
▼