


 |
市場調查報告書
商品編碼
1939163
穿戴式科技:市場佔有率分析、產業趨勢與統計、成長預測(2026-2031)Wearable Technology - Market Share Analysis, Industry Trends & Statistics, Growth Forecasts (2026 - 2031) |
||||||
※ 本網頁內容可能與最新版本有所差異。詳細情況請與我們聯繫。
穿戴式科技市場預計將從 2025 年的 2,193 億美元成長到 2026 年的 2,573.5 億美元,預計到 2031 年將達到 5,727.3 億美元,2026 年至 2031 年的複合年成長率為 17.35%。
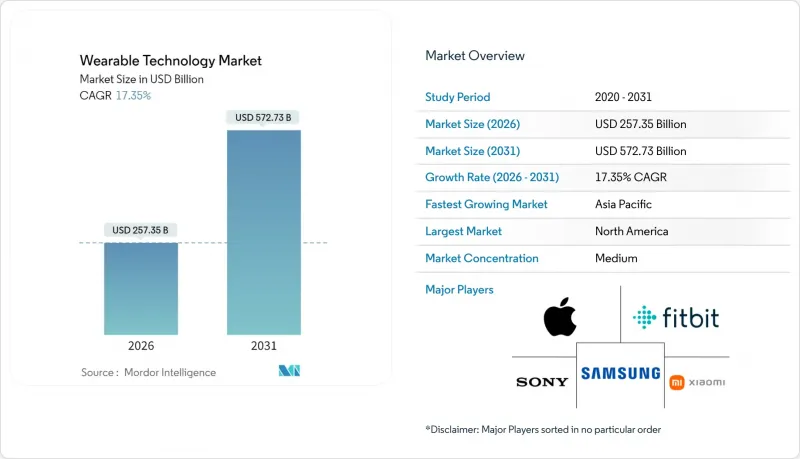
這凸顯了該行業的快速擴張以及富含感測器的互聯設備的商業性可行性。推動這一趨勢的因素包括:美國食品藥物管理局 (FDA) 批准人工智慧驅動的醫療穿戴式裝置、企業在擴增實境顯上的支出,以及固態電池的突破性進展緩解了長期以來的功率密度限制。北美是最大的收入來源,但隨著零件製造在地化和各國政府推動醫療服務數位化,亞太地區正經歷最快的成長。智慧型手錶在設備領域保持主導地位,而頭戴式顯示器則在一線工作人員的推動下,實現了最快的普及速度。競爭格局正從硬體差異化轉向生態系統主導地位,那些能夠最緊密地整合晶片、軟體和服務的公司將獲得大部分價值。
全球穿戴式科技市場趨勢與洞察
人工智慧驅動的臨床級感測器
監管機構正在加快核准人工智慧驅動的生物感測器,並將穿戴式裝置定位為預防保健中的決策支援工具。美國食品藥物管理局(FDA)的數位健康卓越中心簡化了審查流程,而像Trinity Biotech這樣的創新企業已經推出了將代謝數據與預測分析相結合的連續血糖監測儀。韓國科學技術院(KAIST)和香港大學的學術團隊正在將無袖帶血壓測量模組和有機電晶體陣列商業化,這些模組和陣列可在本地處理數據,從而降低延遲並保護隱私。這些進步正在縮小消費級健身設備與臨床診斷之間的差距,增強了支付方對遠端監測服務報銷的信心。醫院將這項技術視為早期療育和避免成本的一種手段,這進一步擴大了穿戴式科技市場的潛在基本客群。
現場工作人員的企業級擴增實境技術
工業擴增實境(AR) 頭戴設備可提高危險和分散式環境中的效率。高露潔棕欖公司進行了 63 次虛擬協作,降低了差旅成本和停機時間。殼牌公司在 12 個國家部署了本質安全型 AR 穿戴式設備,以支援危險區域的維護工作。富士通公司利用 AR 指導減少了 19% 的組裝工作量。鋼鐵製造商 KSP 透過安全帽式視覺化技術將生產率提高了 40%。投資回收期通常不到一年,這使得營運團隊更容易做出決策。隨著遠端專家應用的普及,企業正在大規模下單,從而推動了穿戴式技術市場的成長。
資料隱私合規的負擔
穿戴式裝置會收集生物識別數據,因此受到諸如GDPR和伊利諾州BIPA等嚴格法規的約束。製造商必須整合用戶同意管理和設備內匿名化技術,這增加了開發成本並延緩了產品上市時間。跨境資料傳輸的限制進一步加劇了雲端分析的複雜性。缺乏法律資源的小規模供應商面臨高昂的合規成本,這限制了新進入者的數量,並減緩了穿戴式科技市場的成長。
細分市場分析
2026年至2031年間,頭戴式顯示器以19.02%的複合年成長率成為成長最快的穿戴式科技產品,而智慧型手錶手錶在2025年仍保持著穿戴式科技市場最大的佔有率,達到45.60%。隨著企業採用免持顯示器進行維護、培訓和物流管理,這一成長動能正推動整個穿戴式科技市場的發展。 Meta公司自2023年底開始售出200萬副Ray-Ban智慧眼鏡,並計劃將年銷量提升至1000萬副,這印證了消費者對低調眼鏡產品的需求。谷歌與Warby Parker達成的1.5億美元合作協議,拓展了時尚眼鏡的款式選擇,降低了時尚眼鏡的進入門檻。
耳部穿戴式裝置領域也正在經歷多元化發展,蘋果公司的一項專利展示了一種入耳式健康監測設備,有望減少人們對腕戴式裝置的依賴。智慧服裝仍處於起步階段,但約翰霍普金斯大學的纖維電池技術表明,這種可水洗的儲能設備有望將電子紡織品推向主流市場。隨著智慧型手錶平均售價的下降,腕帶面臨著商品化的風險,但用於擴增實境(AR)控制的神經輸入腕帶仍保持著一定的市場需求。這些變化共同推動穿戴式科技市場進一步豐富。
第二代智慧眼鏡將行動電話無線功能與微型LED顯示器結合,無需行動電話連接即可實現通知優先排序、導航疊加和即時翻譯等功能。原始設備製造商(OEM)正致力於輕量化設計和配鏡支持,以擴大目標使用者群體。該品類的快速擴張將確保設備多樣性保持在高水平,並推動穿戴式科技市場持續成長。
到2025年,感測器將佔據穿戴式科技市場最大佔有率,達到28.70%,這反映了市場對多模態資料流的需求。同時,固態電池將以19.85%的複合年成長率超越所有其他組件,為高級應用場景提供能源基礎。 TDK的晶片級電池和三星續航力一週的原型電池便是很好的例子,它們展示了更安全的化學技術如何實現更薄的機殼。處理器和記憶體正受惠於3D堆疊技術,台積電計畫採用面板級封裝技術,將CPU、GPU和記憶體整合到單一基板上。
顯示器將過渡到軟性OLED和microLED格式,使曲面和透明表面能夠與眼鏡產品無縫融合。連接IC將整合藍牙、Wi-Fi和UWB功能,簡化基板佈局並減少天線面積。軟體和服務是利潤最高的領域,平台所有者正透過訂閱模式限制功能,從而鞏固生態系統並提高轉換成本。因此,穿戴式科技市場的利潤率和銷售量都在持續成長。
區域分析
北美地區將佔2025年總收入的31.70%,這反映了其在研發領域的主導、雄厚的創業投資資金以及有利的健保政策。美國食品藥物管理局(FDA)在2023年核准了124款新設備,創下年度新紀錄,加快了產品上市速度。美國跨國公司開展的企業級AR試點計畫有助於穩定硬體更新周期。然而,高流失率表明,消費者接受度和價值實現仍面臨持續挑戰。
亞太地區預計將成為穿戴式科技市場的主要成長動力,2026年至2031年間的複合年成長率將達到20.25%。中國大力支持的數位健康政策以及韓國在3奈米晶圓代工廠和固態電池的領先地位,正在加速該地區供應鏈的獨立性。印度健康意識日益增強的中產階級和日本人口老化進一步推動了市場需求。台積電位於亞利桑那州和熊本縣的新晶圓廠增強了供應鏈的韌性,同時確保了關鍵製程技術的局部化。
在歐洲,嚴格的隱私和永續性法規與強勁的工業自動化需求相平衡。 GDPR 和 WEEE 指令增加了合規負擔,但也為擁有完善管治的供應商創造了競爭優勢。德國的智慧工廠計畫和英國國家醫療服務體系 (NHS) 的遠端監控試點計畫為企業提供了源源不絕的潛在客戶。中東、非洲和南美洲等小規模的市場在基礎設施和可支配收入方面相對落後,但隨著連接成本的下降和本地應用生態系統的成熟,它們也展現出一定的市場價值。
其他福利:
- Excel格式的市場預測(ME)表
- 分析師支持(3個月)
目錄
第1章 引言
- 研究假設和市場定義
- 調查範圍
第2章調查方法
第3章執行摘要
第4章 市場情勢
- 市場概覽
- 市場促進因素
- 人工智慧驅動的臨床級感測器
- 面向第一線員工的企業級擴增實境技術
- 擴大穿戴式醫療設備的保險覆蓋範圍
- 邊緣人工智慧和低功耗晶片組
- 固體微型電池
- 對身臨其境型遊戲和電子競技的需求
- 市場限制
- 資料隱私合規的負擔
- 先進包裝供應瓶頸
- 電子廢棄物與永續性的壓力
- 使用者疲勞/設備棄用
- 產業價值鏈分析
- 監管環境
- 技術展望
- 波特五力分析
- 供應商的議價能力
- 消費者議價能力
- 新進入者的威脅
- 替代品的威脅
- 競爭對手之間的競爭
第5章 市場規模與成長預測
- 依設備類型
- 智慧型手錶
- 耳戴式裝置
- 頭戴式顯示器
- 智慧服裝
- 腕帶
- 按組件
- 處理器和記憶體
- 感應器
- 展示
- 電池
- 連接積體電路(連線IC)
- 軟體和服務
- 透過連接技術
- 藍牙和低功耗藍牙
- 蜂窩網路(LTE/5G)
- Wi-Fi
- NFC和UWB
- 衛星通訊和低功耗廣域網
- 按最終用戶行業分類
- 家用電子電器
- 醫療保健
- 產業與商業
- 國防/公共
- 按地區
- 北美洲
- 美國
- 加拿大
- 墨西哥
- 歐洲
- 英國
- 德國
- 法國
- 義大利
- 其他歐洲地區
- 亞太地區
- 中國
- 日本
- 印度
- 韓國
- 其他亞洲地區
- 中東
- 以色列
- 沙烏地阿拉伯
- 阿拉伯聯合大公國
- 土耳其
- 其他中東地區
- 非洲
- 南非
- 埃及
- 其他非洲地區
- 南美洲
- 巴西
- 阿根廷
- 南美洲其他地區
- 北美洲
第6章 競爭情勢
- 市場集中度
- 策略趨勢
- 市佔率分析
- 公司簡介
- Apple Inc.
- Samsung Electronics Co., Ltd.
- Alphabet Inc.(Google LLC)
- Meta Platforms, Inc.(Oculus)
- Sony Group Corporation
- Xiaomi Corporation
- Huawei Technologies Co., Ltd.
- Garmin Ltd.
- Fitbit LLC(Google)
- Microsoft Corporation
- HTC Corporation
- BOE Technology Group Co., Ltd.
- Qualcomm Technologies, Inc.
- Corning Incorporated
- Valencell, Inc.
- Zepp Health Corporation
- Fossil Group, Inc.
- Vuzix Corporation
- Magic Leap, Inc.
- Mobvoi Information Technology Co. Ltd.
第7章 市場機會與未來展望
The wearable technology market is expected to grow from USD 219.30 billion in 2025 to USD 257.35 billion in 2026 and is forecast to reach USD 572.73 billion by 2031 at 17.35% CAGR over 2026-2031.
underscoring the sector's rapid scale-up and the commercial viability of sensor-rich connected devices. Momentum stems from FDA clearances for AI-enabled medical wearables, enterprise spending on augmented reality headsets, and solid-state battery breakthroughs that ease long-standing power-density constraints. North America accounts for the largest revenue pool, yet Asia-Pacific is expanding the fastest as component manufacturing localizes and governments digitize healthcare delivery. Device leadership remains with smartwatches, although head-mounted displays record the steepest uptake, buoyed by frontline workforce deployments. Competition has shifted from hardware differentiation to ecosystem control; the companies that integrate chips, software, and services most tightly are capturing a disproportionate share of value.
Global Wearable Technology Market Trends and Insights
AI-Enabled Clinical-Grade Sensors
Regulators continue to fast-track AI-driven biosensors, positioning wearables as decision-support tools in preventive medicine. FDA's Digital Health Center of Excellence has streamlined review pathways, and innovators such as Trinity Biotech have launched continuous glucose monitors that fuse metabolic data with predictive analytics. Academic groups at KAIST and the University of Hong Kong are commercializing cuff-less blood-pressure modules and organic transistor arrays that process data locally, reducing latency and safeguarding privacy. These advances narrow the gap between consumer fitness gadgets and clinical diagnostics, giving payers confidence to reimburse remote monitoring services. Hospitals view the technology as a route to earlier intervention and cost avoidance, further enlarging the addressable base for the wearable technology market.
Enterprise AR for Frontline Workforce
Industrial augmented reality headsets improve efficiency in hazardous or distributed settings. Colgate-Palmolive logged 63 virtual collaborations that trimmed travel expenses and downtime, while Shell deployed intrinsically safe AR wearables across 12 countries to support maintenance in explosive zones. Fujitsu cut assembly tasks by 19% after integrating AR guidance, and steelmaker KSP achieved 40% productivity gains through helmet-mounted visualization. The payback period often falls below one year, making procurement straightforward for operations teams. As remote-expert applications expand, enterprises are ordering at scale, propelling the wearable technology market.
Data-Privacy Compliance Burden
Wearables harvest biometrics that fall under stringent rules such as GDPR and Illinois BIPA. Manufacturers must embed consent management and on-device anonymization, raising development costs and delaying launch schedules. Cross-border data-transfer limits further complicate cloud analytics. Small vendors lacking legal resources face a higher cost-of-compliance hurdle, tempering new-entry rates and trimming growth for the wearable technology market.
Other drivers and restraints analyzed in the detailed report include:
- Reimbursement Inclusion for Medical Wearables
- Edge AI and Low-Power Chipsets
- User Fatigue and Device Abandonment
For complete list of drivers and restraints, kindly check the Table Of Contents.
Segment Analysis
Head-mounted displays posted the fastest 19.02% CAGR over 2026-2031, yet smartwatches retained the largest 45.60% slice of the wearable technology market share in 2025. This momentum lifts the overall wearable technology market as enterprises adopt hands-free displays for maintenance, training, and logistics. Meta sold 2 million Ray-Ban smart glasses since late 2023 and is scaling to 10 million units annually, validating consumer appetite for discreet eyewear. Google's USD 150 million partnership with Warby Parker expands style options, lowering the fashion barrier to adoption.
Diversification is also visible in ear-wearables, where Apple patents point to in-ear health diagnostics that could reduce reliance on wrist devices. Although smart clothing remains nascent, Johns Hopkins' fiber batteries hint at washable energy storage that could mainstream e-textiles. Wristbands risk commoditization as smartwatch ASPs fall, but neural-input bands maintain niche demand for AR control. Collectively, these shifts enrich the wearable technology market.
Second-generation smart glasses integrate cellular radios and micro-LED displays, allowing notification triage, navigation overlays, and real-time translation without tethering to phones. OEMs focus on weight reduction and prescription-lens support to widen the addressable audience. The category's rapid scale will keep device diversity high, ensuring the wearable technology market continues to grow.
Sensors captured the largest 28.70% contribution to the wearable technology market size in 2025, reflecting the need for multi-modal data streams. At the same time, solid-state batteries are forecast to outpace all components with a 19.85% CAGR, providing the energy foundation for advanced use cases. TDK's chip-scale cells and Samsung's week-long prototypes illustrate how safer chemistries unlock slimmer enclosures. Processors and memory ride the 3D-stacking wave, with TSMC planning panel-level packaging that blends CPUs, GPUs, and memory on a single substrate.
Displays are shifting to flexible OLED and micro-LED formats, enabling curved and transparent surfaces that merge with eyewear. Connectivity ICs co-package Bluetooth, Wi-Fi, and UWB to simplify board layouts and shrink antenna footprints. Software and services represent the highest margin layer, and platform owners increasingly gate features behind subscriptions, cementing ecosystems and elevating switching costs. Both margin pools and unit volumes, therefore, continue to widen for the wearable technology market.
The Wearable Technology Market Report is Segmented by Device Type (Smart Watches, Ear-Wearables, Head-Mounted Displays, and More), Component (Processors and Memory, Sensors, Displays, Batteries, and More), Connectivity Technology (Bluetooth and BLE, Cellular LTE/5G, and More), End-User Industry (Consumer Electronics, Healthcare and Medical, and More), and Geography. The Market Forecasts are Provided in Terms of Value (USD).
Geography Analysis
North America generated 31.70% of 2025 revenue, reflecting R&D leadership, venture funding depth, and favourable reimbursement policy. The FDA authorized 124 novel devices in 2023, its highest annual total, shortening commercialization timelines. Enterprise AR pilots run by U.S. multinationals contribute to steady hardware refresh cycles. Nonetheless, elevated abandonment rates reveal ongoing gaps in consumer onboarding and value delivery.
Asia-Pacific is projected to expand at a 20.25% CAGR over 2026-2031, making it the primary volume engine for the wearable technology market. China's policy support for digital health and Korea's leadership in 3 nm foundry and solid-state batteries accelerate regional supply-chain self-sufficiency. India's fitness-aware middle class and Japan's aging population further stretch demand curves. TSMC's new fabs in Arizona and Kumamoto add resilience yet keep key process know-how in the region.
Europe balances strict privacy and sustainability rules with strong industrial automation demand. GDPR and the WEEE directive increase compliance burden but also create competitive moats for vendors with robust governance. Germany's smart-factory programs and the U.K.'s National Health Service pilots on remote monitoring offer stable enterprise pipelines. Smaller markets in the Middle East, Africa, and South America trail in infrastructure and discretionary income, yet they represent option value as connectivity costs fall, and local app ecosystems mature.
- Apple Inc.
- Samsung Electronics Co., Ltd.
- Alphabet Inc. (Google LLC)
- Meta Platforms, Inc. (Oculus)
- Sony Group Corporation
- Xiaomi Corporation
- Huawei Technologies Co., Ltd.
- Garmin Ltd.
- Fitbit LLC (Google)
- Microsoft Corporation
- HTC Corporation
- BOE Technology Group Co., Ltd.
- Qualcomm Technologies, Inc.
- Corning Incorporated
- Valencell, Inc.
- Zepp Health Corporation
- Fossil Group, Inc.
- Vuzix Corporation
- Magic Leap, Inc.
- Mobvoi Information Technology Co. Ltd.
Additional Benefits:
- The market estimate (ME) sheet in Excel format
- 3 months of analyst support
TABLE OF CONTENTS
1 INTRODUCTION
- 1.1 Study Assumptions and Market Definition
- 1.2 Scope of the Study
2 RESEARCH METHODOLOGY
3 EXECUTIVE SUMMARY
4 MARKET LANDSCAPE
- 4.1 Market Overview
- 4.2 Market Drivers
- 4.2.1 AI-enabled clinical-grade sensors
- 4.2.2 Enterprise AR for frontline workforce
- 4.2.3 Reimbursement inclusion for medical wearables
- 4.2.4 Edge AI and low-power chipsets
- 4.2.5 Solid-state micro-batteries
- 4.2.6 Immersive gaming and e-sports demand
- 4.3 Market Restraints
- 4.3.1 Data-privacy compliance burden
- 4.3.2 Advanced-packaging supply bottlenecks
- 4.3.3 E-waste and sustainability pressure
- 4.3.4 User fatigue / device abandonment
- 4.4 Industry Value-Chain Analysis
- 4.5 Regulatory Landscape
- 4.6 Technological Outlook
- 4.7 Porter's Five Forces Analysis
- 4.7.1 Bargaining Power of Suppliers
- 4.7.2 Bargaining Power of Consumers
- 4.7.3 Threat of New Entrants
- 4.7.4 Threat of Substitute Products
- 4.7.5 Intensity of Competitive Rivalry
5 MARKET SIZE AND GROWTH FORECASTS (VALUE)
- 5.1 By Device Type
- 5.1.1 Smart Watches
- 5.1.2 Ear-wearables
- 5.1.3 Head-Mounted Displays
- 5.1.4 Smart Clothing
- 5.1.5 Wristbands
- 5.2 By Component
- 5.2.1 Processors and Memory
- 5.2.2 Sensors
- 5.2.3 Displays
- 5.2.4 Batteries
- 5.2.5 Connectivity ICs
- 5.2.6 Software and Services
- 5.3 By Connectivity Technology
- 5.3.1 Bluetooth and BLE
- 5.3.2 Cellular (LTE/5G)
- 5.3.3 Wi-Fi
- 5.3.4 NFC and UWB
- 5.3.5 Satellite and LP-WAN
- 5.4 By End-User Industry
- 5.4.1 Consumer Electronics
- 5.4.2 Healthcare and Medical
- 5.4.3 Industrial and Enterprise
- 5.4.4 Defense and Public Safety
- 5.5 By Geography
- 5.5.1 North America
- 5.5.1.1 United States
- 5.5.1.2 Canada
- 5.5.1.3 Mexico
- 5.5.2 Europe
- 5.5.2.1 United Kingdom
- 5.5.2.2 Germany
- 5.5.2.3 France
- 5.5.2.4 Italy
- 5.5.2.5 Rest of Europe
- 5.5.3 Asia-Pacific
- 5.5.3.1 China
- 5.5.3.2 Japan
- 5.5.3.3 India
- 5.5.3.4 South Korea
- 5.5.3.5 Rest of Asia
- 5.5.4 Middle East
- 5.5.4.1 Israel
- 5.5.4.2 Saudi Arabia
- 5.5.4.3 United Arab Emirates
- 5.5.4.4 Turkey
- 5.5.4.5 Rest of Middle East
- 5.5.5 Africa
- 5.5.5.1 South Africa
- 5.5.5.2 Egypt
- 5.5.5.3 Rest of Africa
- 5.5.6 South America
- 5.5.6.1 Brazil
- 5.5.6.2 Argentina
- 5.5.6.3 Rest of South America
- 5.5.1 North America
6 COMPETITIVE LANDSCAPE
- 6.1 Market Concentration
- 6.2 Strategic Moves
- 6.3 Market Share Analysis
- 6.4 Company Profiles (includes Global level Overview, Market level overview, Core Segments, Financials as available, Strategic Information, Market Rank/Share for key companies, Products and Services, and Recent Developments)
- 6.4.1 Apple Inc.
- 6.4.2 Samsung Electronics Co., Ltd.
- 6.4.3 Alphabet Inc. (Google LLC)
- 6.4.4 Meta Platforms, Inc. (Oculus)
- 6.4.5 Sony Group Corporation
- 6.4.6 Xiaomi Corporation
- 6.4.7 Huawei Technologies Co., Ltd.
- 6.4.8 Garmin Ltd.
- 6.4.9 Fitbit LLC (Google)
- 6.4.10 Microsoft Corporation
- 6.4.11 HTC Corporation
- 6.4.12 BOE Technology Group Co., Ltd.
- 6.4.13 Qualcomm Technologies, Inc.
- 6.4.14 Corning Incorporated
- 6.4.15 Valencell, Inc.
- 6.4.16 Zepp Health Corporation
- 6.4.17 Fossil Group, Inc.
- 6.4.18 Vuzix Corporation
- 6.4.19 Magic Leap, Inc.
- 6.4.20 Mobvoi Information Technology Co. Ltd.
7 MARKET OPPORTUNITIES AND FUTURE OUTLOOK
- 7.1 White-space and Unmet-Need Assessment
 全球穿戴式科技市場規模、佔有率、趨勢和成長分析報告(2026-2034年)
 穿戴式科技市場規模、佔有率、趨勢及預測(依產品、應用及地區分類),2026-2034年
 全球穿戴式科技市場,2026-2030年
 按應用和地區分類的穿戴式技術市場日本穿戴式科技市場規模、佔有率、趨勢及預測(依產品、應用及地區分類,2026-2034年)
 穿戴式科技整合市場:全球預測至 2032 年—按產品、組件、連接方式、技術、應用、最終用戶和地區分類的分析
 穿戴式科技市場報告
 穿戴式科技市場(按裝置類型、組件、最終用戶、應用程式和分銷管道)—2025-2032 年全球預測
 穿戴式技術的全球市場(2026年~2036年)
 穿戴式科技市場規模、佔有率、趨勢、產業分析報告:依產品、應用、地區、市場預測2025-2034