


 |
市場調查報告書
商品編碼
2123317
伺服器微處理器:市場佔有率分析、產業趨勢與統計及成長預測(2026-2031 年)Server Microprocessor - Market Share Analysis, Industry Trends & Statistics, Growth Forecasts (2026 - 2031) |
||||||

※ 本網頁內容可能與最新版本有所差異。詳細情況請與我們聯繫。
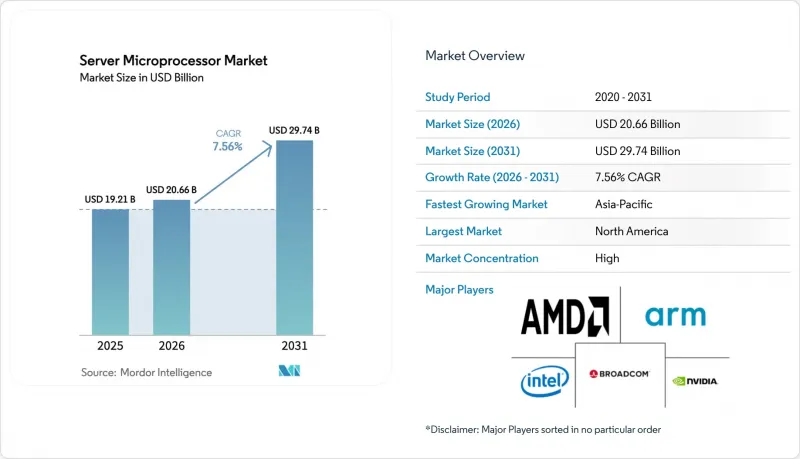
根據 Mordor Intelligence 預測,伺服器微處理器市場規模預計將從 2025 年的 192.1 億美元和 2026 年的 206.6 億美元成長到 2031 年的 297.4 億美元,2026 年至 2031 年的複合年成長率為 7.56%。
本報告按處理器類型(APU、CPU、GPU 等)、指令集架構(x86、ARM、RISC-V 等)、核心數(8 核心或以下、9-32 核心等)、製造流程節點(7nm 或以下、8-14nm 等)、終端用戶產業(超大規模雲端服務供應商、企業資料中心等)和地區進行細分。市場預測以美元 (USD) 為單位。
全球伺服器微處理器市場趨勢及洞察
對高性能、高能源效率CPU的需求日益成長。
資料中心營運商現在正將採購與每瓦效能指標直接掛鉤,因為能源成本目前已佔超大規模資料中心總擁有成本 (TCO) 的 30% 以上。供應商正積極回應,推出採用 3 奈米製程製造的半導體,這些半導體在將向量吞吐量提高一倍的同時,還能降低三分之一的功耗。 AWS 的 Graviton 4 執行個體與同等 x86 虛擬機器相比,成本績效提升了 30%,證明了基於 Arm 架構的設計對主流雲端工作負載的有效性。英特爾的 Xeon 6 Sierra Forest 系列處理器僅採用高效核心,即可實現 205 瓦的 TDP 目標,滿足永續性要求,而無需進行大規模的程式碼重寫。隨著電信業者從空調機房遷移到室外機櫃,他們對功耗限制的要求也更加嚴格,這促使晶片製造商整合封裝內電壓調節器和動態電源門控技術。這些變化正推動伺服器微處理器市場繼續從單純追求時脈頻率轉向以功耗為導向的架構。
全球超大規模資料中心擴張
2024年至2025年間,超過900座超大規模資料中心投入運作,累積資本投資超過2,000億美元。這主要主導沙烏地阿拉伯、印度和北歐國家的營運商,他們將資料中心園區選址在低成本可再生能源電網附近。機架設計強調採用多插槽主機板,將CPU、GPU和網路加速模組整合在單一中介層上,這需要更強的散熱性能和先進的封裝技術。 AWS、Google和Meta正在將其至少三分之一的新增網路服務處理能力轉移到基於Arm架構的處理器上,預計這將降低晶片組件的成本。在新興市場,隱私法的統一化正在推動本地資料存儲,要求營運商在區域內複製計算叢集,從而進一步擴大對插槽的整體需求。隨著這些發展的推進,伺服器微處理器市場正受益於銷售彈性和更廣泛的價格區間。
半導體供應鏈持續中斷
台積電3奈米生產線在2025年第三季的運轉率率達85%,但晶圓需求超過供應20%,導致前置作業時間延長至16週。對極紫外光刻(EUV)設備的出口限制阻礙了中國晶圓廠跟上最先進製程節點的步伐,造成產能分散,並推高了緊急庫存的風險溢價。由於三星的Gate All Around(GAA)製程仍在量產,而英特爾的18埃製程計畫規模仍然小規模,一次地震或地緣政治緊張局勢的升級都可能導致全球超過一半的伺服器晶片停產。供應商正將額外成本直接轉嫁到合約價格中,由於緊急交貨費用,AMD在2025年第二季的毛利率下降了200個基點。設計團隊正在將晶片分割成更小的晶片組,這些晶片組採用成熟的製程節點製造,但這種策略增加了封裝的複雜性,並產生了新的延遲因素。
細分市場分析
從2026年到2031年,GPU出貨量預計將以8.72%的複合年成長率成長,而人工智慧推理向張量引擎的轉移預計將縮小CPU 70.53%的營收領先優勢。這一趨勢表明,伺服器微處理器市場將持續變革時期至2031年。 NVIDIA Blackwell等GPU透過NVLink與基於Arm架構的Grace CPU搭配使用時,可實現20 petaflops的FP4效能,進而支援機架式設計超越1.3 PUE的目標。儘管FPGA在出貨量方面仍處於小眾市場,但它們對於加密卸載和壓縮至關重要,可為雲端服務供應商減少30%的CPU週期。整合APU設計在設備插槽中具有競爭優勢,因為在這些插槽中引入風扇和獨立顯示卡並不實際。在某些推理模式下,Google和AWS的ASIC加速器每瓦效能比GPU高出2-3倍。
異構晶片封裝技術使廠商能夠將CPU、GPU和網路晶片整合到單一散熱器下,從而降低掩模成本並縮短產品上市時間。因此,伺服器微處理器產業正從單晶片核心數量競爭轉向混合晶片組合策略,以最大限度地提高矽晶圓面積效率。儘管傳統CPU銷售停滯不前,但由於加速器的平均售價較高,整個伺服器微處理器市場仍在持續成長。採購團隊現在評估的是整個機架的成本,而不是每個插槽的成本,這使得提供整合堆疊的廠商能夠簽訂多年供貨合約。
儘管預計到2025年x86仍將保持64.91%的市場佔有率,並繼續作為企業軟體相容性的基礎,但Arm預計將佔據四分之一的新插槽佔有率,而RISC-V憑藉其免版稅模式(正獲得超大規模超大規模資料中心業者的支援),預計將以7.97%的複合年成長率成長。高通斥資15億美元收購Ventana表明,傳統行動領導企業正在進軍伺服器市場,以對沖不斷上漲的Arm授權費用。中國對開放管治的偏好與其半導體主權目標相符,促使國內廠商將重點放在雲端建構的RISC-V架構上。
競爭的焦點已從前端性能轉向生態系統工具和長尾軟體支持,低成本的RISC-V開發板正成為微服務和快取層的可靠選擇。 Arm在雲端客製化晶片領域的成功威脅到通用晶片供應商的利潤率,但它也鞏固了設計的多樣性,並確保伺服器微處理器市場避免被單一供應商鎖定。標準組織正致力於統一不同指令集架構(ISA)的韌體介面,以縮短應用程式遷移時間,預計這將使伺服器微處理器產業在預測期內保持強勁成長。
區域分析
北美地區每年在AWS、Azure、Google雲端和Meta等超大規模雲端服務商超過800億美元的資本投資支持下,預計到2025年將佔全球銷售額的39.52%。儘管《晶片法案》(CHIPS Act)提供的527億美元激勵措施旨在到2030年將20%的尖端邏輯半導體產品帶回美國,但美國國內晶圓成本仍然比亞洲晶圓廠高出40%,這給毛利率帶來了壓力。加拿大和墨西哥正利用美墨加協定(USMCA)的貿易條款,透過後端組裝測試業務進一步擴大生產規模。
亞太地區預計將呈現最高的成長率,複合年成長率達9.11%,這主要得益於中國國內Arm和RISC-V架構的研發、印度對AWS的127億美元投資,以及東南亞AWS中立型託管服務的成長。阿里巴巴和騰訊等中國超超大規模資料中心業者已部署了自主研發的128核心Arm處理器,顯示儘管存在出口限制,但中國在技術上已具備同等實力。日本和韓國雖然更專注於記憶體和代工服務而非伺服器CPU設計,但也受益於旨在維護晶片自主權的區域扶持措施。
儘管歐洲、南美以及中東和非洲的需求總合不到全球總量的四分之一,但由於數據主權法強制要求對高度敏感的工作負載進行本地存儲,這一需求正在成長。歐盟430億歐元的晶片法案正在資助德國和義大利的晶圓廠(半導體製造廠),但該地區在伺服器處理器方面仍然嚴重依賴亞洲的契約製造。中東的NEOM園區和阿拉伯聯合大公國的人工智慧投資由於環境溫度高,需要水冷機架,增加了成本,但也促進了區域專業化。南美的成長取決於光纖基礎設施的改善,而新興的非洲市場在電網可靠性提高之前,依賴翻新的x86設備。
其他好處:
- Excel格式的市場預測(ME)表
- 3個月的分析師支持
目錄
第1章:引言
- 研究假設和市場定義
- 調查範圍
第2章:調查方法
第3章執行摘要
第4章 市場狀況
- 市場概覽
- 市場促進因素
- 對高性能、高能源效率CPU的需求日益成長。
- 全球超大規模資料中心的擴張
- 基於雲端的AI/ML工作負載擴展
- 引入利用5G的邊緣運算
- 基於晶片組的模組化設計的普及
- 政府半導體主權計劃
- 市場限制因素
- 企業本地伺服器預算削減
- 半導體供應鏈持續中斷
- 專有ISA的許可成本不斷上漲
- 對資料中心永續性的嚴格監管
- 產業價值鏈分析
- 監理情勢
- 技術展望
- 波特五力分析
第5章 市場規模與成長預測
- 依處理器類型
- APU
- CPU
- GPU
- FPGA
- ASIC加速器
- 依指令集架構
- x86
- ARM
- RISC-V
- Power
- SPARC 及其他
- 以核心數計算
- 8個核心或更少
- 9-32個核心
- 33-64個核心
- 超過64個核心
- 透過製造製程節點
- 7奈米或更小
- 8~14 nm
- 15~28 nm
- >28 奈米
- 按最終用戶行業分類
- 超大規模雲端供應商
- 企業資料中心
- 通訊/邊緣運營商
- 高效能運算和超級運算
- 其他
- 按地區
- 北美洲
- 美國
- 加拿大
- 墨西哥
- 南美洲
- 巴西
- 阿根廷
- 其他南美國家
- 歐洲
- 德國
- 英國
- 法國
- 義大利
- 西班牙
- 其他歐洲國家
- 亞太地區
- 中國
- 日本
- 印度
- 韓國
- ASEAN
- 其他亞太國家
- 中東
- 沙烏地阿拉伯
- 阿拉伯聯合大公國
- 其他中東國家
- 非洲
- 南非
- 奈及利亞
- 其他非洲國家
- 北美洲
第6章 競爭情勢
- 市場集中度
- 策略趨勢
- 市佔率分析
- 公司簡介
- Intel Corporation
- Advanced Micro Devices, Inc.
- NVIDIA Corporation
- Arm Ltd.
- Broadcom Inc.
- Marvell Technology, Inc.
- Ampere Computing LLC
- International Business Machines Corporation
- Huawei Technologies Co., Ltd.
- Fujitsu Limited
- Samsung Electronics Co., Ltd.
- Taiwan Semiconductor Manufacturing Company Limited
- Texas Instruments Incorporated
- MediaTek Inc.
- Alibaba Group Holding Ltd.(T-Head)
- SiFive, Inc.
- Graphcore Limited
- Socionext Inc.
- Tenstorrent Inc.
- Ventana Micro Systems Inc.
- Oracle Corporation
第7章 市場機會與未來展望
According to Mordor Intelligence, the server microprocessor market size is projected to expand from USD 19.21 billion in 2025 and USD 20.66 billion in 2026 to USD 29.74 billion by 2031, registering a CAGR of 7.56% between 2026 to 2031.
This report is Segmented by Processor Type (APU, CPU, GPU, and More), Instruction-Set Architecture (x86, ARM, RISC-V, and More, Core-Count Bracket (Less Than or Equal To 8 Cores, 9-32 Cores), and More), Fabrication Process Node (Less Than or Equal To 7nm, 8-14nm, and More), End-User Industry (Hyperscale Cloud, Enterprise, and More), and Geography. The Market Forecasts are Provided in Terms of Value (USD).
Global Server Microprocessor Market Trends and Insights
Rising Demand for High-Performance, Energy-Efficient CPUs
Data-center operators are linking procurement directly to performance-per-watt metrics because energy now represents more than 30% of total cost of ownership in hyperscale facilities. Vendors have responded with silicon fabricated at 3 nanometers that cuts wattage by a third while doubling vector throughput. AWS Graviton4 instances show 30% better price-performance over comparable x86 virtual machines, validating Arm-based designs in mainstream cloud workloads. Intel's Xeon 6 Sierra Forest variant relies exclusively on efficiency cores to hit a 205-watt TDP target, supporting sustainability mandates without major code rewrites. Telecom operators substituting outdoor cabinets for air-conditioned halls are demanding even tighter envelopes, so chipmakers are integrating on-package voltage regulators and dynamic power-gating functions. These shifts ensure that the server microprocessor market continues to migrate toward architectures optimized for watts rather than pure clock speed.
Expansion of Hyperscale Data Centers Worldwide
More than 900 hyperscale facilities entered service during 2024-2025, and cumulative capital expenditure topped USD 200 billion, led by operators locating campuses near low-cost renewable energy grids in Saudi Arabia, India, and the Nordics. Rack designs emphasize multi-socket boards that host CPU, GPU, and network acceleration tiles on one interposer, tightening thermal coupling and demanding advanced packaging expertise. AWS, Google, and Meta have each shifted at least 1/3 of their new web-serving capacity to Arm-based processors that promise lower silicon bill of materials. Emerging markets are mandating local data residency under converging privacy laws, so operators must replicate compute clusters regionally, further expanding total socket demand. As this footprint grows, the server microprocessor market benefits from volume elasticity and a broader price band.
Ongoing Semiconductor Supply-Chain Disruptions
TSMC's 3 nanometer lines ran at 85% utilization in Q3 2025, yet wafer demand exceeded supply by 20%, lengthening lead times to 16 weeks. Export restrictions on EUV tools block Chinese fabs from matching leading-edge nodes, fragmenting capacity, and raising risk premiums on contingency inventory. Samsung's gate-all-around ramp and Intel's 18-angstrom plan remain subscale, so a single earthquake or geopolitical flare-up could choke more than half of global server chip output. Vendors pass surcharges straight into contract pricing; AMD's Q2 2025 gross margin slid 200 basis points due to expedited wafer fees. Design teams are splitting dies into smaller chiplets made on mature nodes, but that strategy increases packaging complexity and yields new sources of delay.
Other drivers and restraints analyzed in the detailed report include:
- Cloud-Based AI and ML Workload Proliferation
- 5G-Enabled Edge-Computing Roll-outs
- Strict Data-Center Sustainability Regulations
For complete list of drivers and restraints, kindly check the Table Of Contents.
Segment Analysis
GPU shipments expanded at an 8.72% CAGR during 2026-2031 and cut into the CPU's 70.53% revenue lead as AI inference migrated to tensor engines, a trend that will keep the server microprocessor market in transition through 2031. GPUs like NVIDIA Blackwell now deliver 20 petaflops FP4 performance while paired with Arm-based Grace CPUs over NVLink, enabling rack designs that beat sub-1.3 PUE targets. FPGAs remain niche in unit terms but are critical for encryption offload and compression, trimming CPU cycles by 30% for cloud operators. Integrated APU designs are a winning edge in appliance slots where fans and discrete cards are impractical. ASIC accelerators from Google and AWS achieve 2-3 times better performance per watt than GPUs for specific inference patterns.
Heterogeneous chiplet packages enable vendors to slot CPUs, GPUs, and network dies under a single heat spreader, shaving mask costs and improving time-to-market. The server microprocessor industry therefore pivots from monolithic core count races to mixed-die portfolio strategies that maximize silicon area efficiency. Legacy CPU revenues are flattening, but the overall server microprocessor market continues to grow because accelerators carry higher average selling prices. Procurement teams are evaluating total rack cost rather than socket price, enabling vendors that deliver integrated stacks to secure multiyear supply agreements.
x86 retained 64.91% share in 2025 and remains the compatibility anchor for enterprise software, yet Arm captured a quarter of new sockets, and RISC-V is projected to grow at a 7.97% CAGR on a royalty-free model that resonates with hyperscalers. Qualcomm's USD 1.5 billion Ventana acquisition signaled traditional mobile leaders entering the server space to hedge against rising Arm license fees. China's preference for open governance aligns with its semiconductor sovereignty objectives, so domestic vendors are betting on RISC-V for cloud build-outs.
The competitive narrative now hinges on ecosystem tooling and long-tail software support rather than front-end performance, positioning low-cost RISC-V boards as credible for microservices and caching tiers. Arm's success in bespoke cloud silicon threatens merchant suppliers on margin, but it validates the diversity of design and ensures that the server microprocessor market avoids single-vendor lock-in. Standardization groups are aligning firmware interfaces across ISAs to shorten application migration times, which should keep the server microprocessor industry dynamic through the forecast period.
Complete Report Scope:
- By Processor Type
- APU
- CPU
- GPU
- FPGA
- ASIC Accelerators
- By Instruction-Set Architecture
- x86
- ARM
- RISC-V
- Power
- SPARC and Others
- Consumer Electronics
- By Core-Count Bracket
- Less Than or Equal to 8 Cores
- 9-32 Cores
- 33-64 Cores
- More than 64 Cores
- By Fabrication Process Node
- Less Than or Equal to 7 nm
- 8-14 nm
- 15-28 nm
- More than 28 nm
- By End-User Industry
- Hyperscale Cloud Providers
- Enterprise Data-Centers
- Telecom/ Edge Operators
- HPC and Supercomputing
- Other End-User Industries
- By Geography
- North America
- United States
- Canada
- Mexico
- South America
- Brazil
- Argentina
- Rest of South America
- Europe
- Germany
- United Kingdom
- France
- Italy
- Spain
- Rest of Europe
- Asia-Pacific
- China
- Japan
- India
- South Korea
- ASEAN
- Rest of Asia-Pacific
- Middle East
- Saudi Arabia
- United Arab Emirates
- Rest of Middle East
- Africa
- South Africa
- Nigeria
- Rest of Africa
- North America
Geography Analysis
North America generated 39.52% of 2025 revenue, bolstered by more than USD 80 billion in annual hyperscale capital expenditure from AWS, Azure, Google Cloud and Meta. CHIPS Act incentives worth USD 52.7 billion aim to reshore 20% of leading-edge logic by 2030, yet domestic wafer costs remain up to 40% higher than Asian fabs, pressuring gross margins. Canada and Mexico add incremental volume through back-end assembly and test operations that leverage USMCA trade provisions.
Asia-Pacific is projected to post the fastest 9.11% CAGR, driven by China's domestic Arm and RISC-V initiatives, India's USD 12.7 billion AWS investment and Southeast Asia's neutral colocation growth AWS. Chinese hyperscalers such as Alibaba and Tencent already deploy in-house 128-core Arm processors, demonstrating technology parity despite export controls. Japan and South Korea focus on memory and foundry services rather than server CPU design, but still benefit from regional stimuli targeting chip sovereignty.
Europe, South America, the Middle East, and Africa collectively hold under one-quarter of demand yet are expanding as data-sovereignty laws force local storage of sensitive workloads. The EU's EUR 43 billion Chips Act funds fabs in Germany and Italy, though the region still relies on Asian contract manufacturing for most server processors. The Middle East's NEOM campus and UAE AI investments require liquid-cooled racks due to ambient temperatures, adding cost premiums but fostering regional specialization. South American growth hinges on improved fiber infrastructure, while Africa's nascent market leans on refurbished x86 equipment until grid reliability improves.
- Intel Corporation
- Advanced Micro Devices, Inc.
- NVIDIA Corporation
- Arm Ltd.
- Broadcom Inc.
- Marvell Technology, Inc.
- Ampere Computing LLC
- International Business Machines Corporation
- Huawei Technologies Co., Ltd.
- Fujitsu Limited
- Samsung Electronics Co., Ltd.
- Taiwan Semiconductor Manufacturing Company Limited
- Texas Instruments Incorporated
- MediaTek Inc.
- Alibaba Group Holding Ltd. (T-Head)
- SiFive, Inc.
- Graphcore Limited
- Socionext Inc.
- Tenstorrent Inc.
- Ventana Micro Systems Inc.
- Oracle Corporation
Additional Benefits:
- The market estimate (ME) sheet in Excel format
- 3 months of analyst support
TABLE OF CONTENTS
1 INTRODUCTION
- 1.1 Study Assumptions and Market Definition
- 1.2 Scope of the Study
2 RESEARCH METHODOLOGY
3 EXECUTIVE SUMMARY
4 MARKET LANDSCAPE
- 4.1 Market Overview
- 4.2 Market Drivers
- 4.2.1 Rising Demand for High-performance, Energy-efficient CPUs
- 4.2.2 Expansion of Hyperscale Data-centers Worldwide
- 4.2.3 Cloud-based AI/ML Workload Proliferation
- 4.2.4 5G-enabled Edge-computing Roll-outs
- 4.2.5 Chiplet-based Modular Design Adoption
- 4.2.6 Government Semiconductor-sovereignty Programs
- 4.3 Market Restraints
- 4.3.1 Declining on-prem Enterprise Server Budgets
- 4.3.2 Ongoing Semiconductor Supply-chain Disruptions
- 4.3.3 Escalating Licensing Costs of Proprietary ISAs
- 4.3.4 Strict Data-center Sustainability Regulations
- 4.4 Industry Value Chain Analysis
- 4.5 Regulatory Landscape
- 4.6 Technological Outlook
- 4.7 Porter's Five Forces Analysis
- 4.7.1 Bargaining Power of Suppliers
- 4.7.2 Bargaining Power of Buyers
- 4.7.3 Threat of New Entrants
- 4.7.4 Threat of Substitutes
- 4.7.5 Intensity of Competitive Rivalry
5 MARKET SIZE AND GROWTH FORECASTS (VALUE)
- 5.1 By Processor Type
- 5.1.1 APU
- 5.1.2 CPU
- 5.1.3 GPU
- 5.1.4 FPGA
- 5.1.5 ASIC Accelerators
- 5.2 By Instruction-Set Architecture
- 5.2.1 x86
- 5.2.2 ARM
- 5.2.3 RISC-V
- 5.2.4 Power
- 5.2.5 SPARC and Others
- 5.2.6 Consumer Electronics
- 5.3 By Core-Count Bracket
- 5.3.1 Less Than or Equal to 8 Cores
- 5.3.2 9-32 Cores
- 5.3.3 33-64 Cores
- 5.3.4 More than 64 Cores
- 5.4 By Fabrication Process Node
- 5.4.1 Less Than or Equal to 7 nm
- 5.4.2 8-14 nm
- 5.4.3 15-28 nm
- 5.4.4 More than 28 nm
- 5.5 By End-User Industry
- 5.5.1 Hyperscale Cloud Providers
- 5.5.2 Enterprise Data-Centers
- 5.5.3 Telecom/ Edge Operators
- 5.5.4 HPC and Supercomputing
- 5.5.5 Other End-User Industries
- 5.6 By Geography
- 5.6.1 North America
- 5.6.1.1 United States
- 5.6.1.2 Canada
- 5.6.1.3 Mexico
- 5.6.2 South America
- 5.6.2.1 Brazil
- 5.6.2.2 Argentina
- 5.6.2.3 Rest of South America
- 5.6.3 Europe
- 5.6.3.1 Germany
- 5.6.3.2 United Kingdom
- 5.6.3.3 France
- 5.6.3.4 Italy
- 5.6.3.5 Spain
- 5.6.3.6 Rest of Europe
- 5.6.4 Asia-Pacific
- 5.6.4.1 China
- 5.6.4.2 Japan
- 5.6.4.3 India
- 5.6.4.4 South Korea
- 5.6.4.5 ASEAN
- 5.6.4.6 Rest of Asia-Pacific
- 5.6.5 Middle East
- 5.6.5.1 Saudi Arabia
- 5.6.5.2 United Arab Emirates
- 5.6.5.3 Rest of Middle East
- 5.6.6 Africa
- 5.6.6.1 South Africa
- 5.6.6.2 Nigeria
- 5.6.6.3 Rest of Africa
- 5.6.1 North America
6 COMPETITIVE LANDSCAPE
- 6.1 Market Concentration
- 6.2 Strategic Moves
- 6.3 Market Share Analysis
- 6.4 Company Profiles (includes Global level Overview, Market Level Overview, Core Segments, Financials as Available, Strategic Information, Market Rank/Share for Key Companies, Products and Services, and Recent Developments)
- 6.4.1 Intel Corporation
- 6.4.2 Advanced Micro Devices, Inc.
- 6.4.3 NVIDIA Corporation
- 6.4.4 Arm Ltd.
- 6.4.5 Broadcom Inc.
- 6.4.6 Marvell Technology, Inc.
- 6.4.7 Ampere Computing LLC
- 6.4.8 International Business Machines Corporation
- 6.4.9 Huawei Technologies Co., Ltd.
- 6.4.10 Fujitsu Limited
- 6.4.11 Samsung Electronics Co., Ltd.
- 6.4.12 Taiwan Semiconductor Manufacturing Company Limited
- 6.4.13 Texas Instruments Incorporated
- 6.4.14 MediaTek Inc.
- 6.4.15 Alibaba Group Holding Ltd. (T-Head)
- 6.4.16 SiFive, Inc.
- 6.4.17 Graphcore Limited
- 6.4.18 Socionext Inc.
- 6.4.19 Tenstorrent Inc.
- 6.4.20 Ventana Micro Systems Inc.
- 6.4.21 Oracle Corporation
7 MARKET OPPORTUNITIES AND FUTURE OUTLOOK
- 7.1 White-space and Unmet-Need Assessment


