


 |
市場調查報告書
商品編碼
1644934
北美太陽能追蹤器:市場佔有率分析、行業趨勢和成長預測(2025-2030 年)North America Solar Tracker - Market Share Analysis, Industry Trends & Statistics, Growth Forecasts (2025 - 2030) |
||||||
價格
※ 本網頁內容可能與最新版本有所差異。詳細情況請與我們聯繫。
簡介目錄
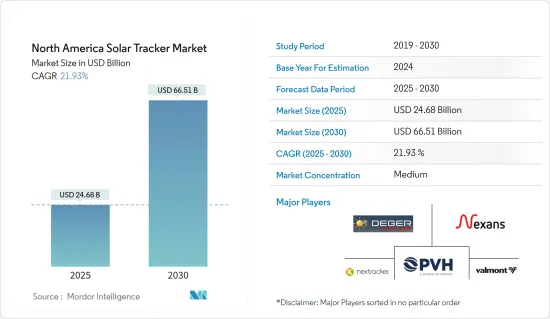
北美太陽能追蹤器市場規模預計在 2025 年為 246.8 億美元,預計到 2030 年將達到 665.1 億美元,預測期內(2025-2030 年)的複合年成長率為 21.93%。
關鍵亮點
- 從中期來看,由於政府採取措施擴大可再生能源在發電組合中的佔有率並增加太陽能的採用,北美的太陽能追蹤器市場預計將成長。
- 另一方面,預計天然氣和其他可再生能源的激烈競爭將在不久的將來阻礙市場成長。
- 隨著太陽能追蹤器提高太陽能板的發電能力,太陽能追蹤器技術的進步預計將為市場創造充足的機會。
- 由於美國政府積極擴大太陽能投資,預計美國將主導市場。
北美太陽能追蹤器市場趨勢
單軸可望實現強勁成長
- 單軸追蹤器是僅使用一個角度作為旋轉軸的設備。這些追蹤器可以將發電能力提高30%。我們列出了一些簡單、有效且低成本的選項來改善您的太陽能系統的功能。
- 根據美國能源資訊署的數據,2022 年,美國公用事業規模發電機的淨發電量約為 4.243 兆千瓦時 (kWh)(約 4.24 兆千瓦時)。大多數地面安裝的太陽能裝置都採用單軸追蹤器,因為這種類型具有經濟優勢且易於安裝。預計這一趨勢在不久的將來還將繼續下去。
- 在美國,截至2022年,淨太陽能發電量將達到145,598 GWh,其中德克薩斯州領先,在建太陽能發電容量約610萬千瓦,其次是加州。這些計劃肯定會對該國的太陽能追蹤器市場產生影響。
- 此外,該國工業參與者推出具有先進技術特點的新產品預計將推動該地區的太陽能追蹤器市場的發展。例如,美國太陽能追蹤系統製造商FTC Solar於2022年9月推出了名為「Pioneer」的新型1P太陽能追蹤系統。該公司採用高速模組懸掛技術和更少的緊固件來製造該產品,從而減少了每兆瓦的工時。
- 預計這些市場發展將在未來幾年推動該地區單軸太陽能追蹤器市場的發展。
預計美國將主導市場
- 在政府機構和私人投資者的共同努力下,美國長期以來一直在太陽能發電的道路上前進。太陽能發電佔可再生能源發電的165.4 TWh(26%),僅次於風能。隨著政府努力擴大太陽能應用,預計未來幾年該能源來源將快速成長。
- 人們對國家高度依賴化石燃料天然氣發電的擔憂日益加劇,加上即將上馬的大型太陽能發電工程,可能成為太陽能追蹤器市場的催化劑。
- 根據美國能源資訊署 (EIA) 和太陽能產業專家的說法,太陽能將在 2022 年至 2023 年新增可再生能源容量方面處於領先地位。公用事業規模太陽能發電工程將佔2022-2023年新增產能的近49%,2023年金額16吉瓦。這項預測背後的根本促進因素是技術成本的下降。
- 推動太陽能發電工程成長的另一個主要因素是太陽能發電工程投資稅額扣抵(ITC) 的延長。對於公用事業規模的太陽能發電工程,美國能源局可提供約 10% 的信貸。此外,2022年太陽能熱能和光伏能源消費量將超過1.8兆英熱單位。這是有史以來的最高消費量,比前一年增加了 300 多兆英熱單位。
- 然而,2023年8月,全球太陽能追蹤器製造商Nextracker Inc.(NXT)和全球高階電子元件製造商Asteelflash(Asteelflash/USI)宣佈為Nextracker開設一條美國Asteelflash製造生產線。 Asteelflash 已擴展其產能,包括專門生產 Nextracker取得專利的的自供電控制器 (SPC) 和高壓電源。
- 預計這些新興市場的發展將在不久的將來帶來超過該地區其他國家的市場成長。
北美太陽能追蹤器產業概況
北美太陽能追蹤器市場適度細分。主要企業(不分先後順序)包括 Nextracker Inc.、PV Hardware Solutions、Valmont Industries Inc.、Deger Canada Inc. 和 Nexans SA。
其他福利
- Excel 格式的市場預測 (ME) 表
- 3 個月的分析師支持
目錄
第 1 章 簡介
- 研究範圍
- 市場定義
- 調查前提
第2章調查方法
第3章執行摘要
第4章 市場概況
- 介紹
- 至2029年的市場規模及需求預測(單位:美元)
- 最新趨勢和發展
- 政府法規和政策
- 市場動態
- 驅動程式
- 政府的有利舉措
- 太陽能利用率不斷提高
- 限制因素
- 越來越多採用替代清潔能源
- 驅動程式
- 供應鏈分析
- 波特五力分析
- 供應商的議價能力
- 消費者議價能力
- 新進入者的威脅
- 替代品的威脅
- 競爭對手之間的競爭
第5章 市場區隔
- 軸類型
- 單軸
- 雙軸
- 地區
- 美國
- 加拿大
- 墨西哥
- 北美其他地區
第6章 競爭格局
- 併購、合資、合作與協議
- 主要企業策略
- 公司簡介
- Nextracker Inc.
- PV Hardware Solutions
- Valmont Industries Inc.
- Deger Canada Inc.
- Nexans SA
- First Sunergy LLC
- Aiva Technology LLC
- Alion Energy Inc.
- DH Solar
- Eppley Laboratory Inc.
- 市場排名/佔有率分析
第7章 市場機會與未來趨勢
- 太陽能追蹤器的技術進步
簡介目錄
Product Code: 93212
The North America Solar Tracker Market size is estimated at USD 24.68 billion in 2025, and is expected to reach USD 66.51 billion by 2030, at a CAGR of 21.93% during the forecast period (2025-2030).
Key Highlights
- Over the medium term, the solar tracker market in the North American region is expected to thrive due to the government's initiatives to expand the renewable energy share in the power generation portfolio and increase the adoption of solar energy.
- On the other hand, the intense competition from natural gas and other renewable energy sources is expected to hinder market growth in the near future.
- Nevertheless, as solar trackers increase the solar power generating capacity of solar panels, thus technological advancements in solar trackers are expected to create ample opportunities for the market.
- The United States is expected to dominate the market due to government initiatives to expand its solar energy portfolio.
North America Solar Tracker Market Trends
Single-Axis Expected to Witness Significant Growth
- Single-axis trackers are devices in which only one angle is used as the axis of rotation. These trackers can increase the power production capacity by 30%. They provide simple, efficient, and low-cost options to improve the functioning of solar energy systems.
- According to the United States Energy Information Administration, In 2022, the net generation of electricity from utility-scale generators in the United States was about 4,243 billion kilowatt hours (kWh) (or about 4.24 trillion kWh). Most of the ground-mounted solar PV installations employed single-axis trackers due to the economical and accessibility benefits of the type. The trend is expected to continue in the near future too, due to the upcoming utility-scale solar projects in the region.
- In the United States, the solar net power generation accounted for 145,598 GWh as of 2022, out of which Texas was the front runner, with around 6.1 GW of solar capacity under construction, followed by California. The projects are inevitably going to affect the solar tracker market in the country.
- Moreover, the new product launches by the industry players in the country, with advanced technical features, are expected to drive the solar tracker market in the region. For example, in September 2022, the US-based solar tracker systems manufacturer FTC Solar launched a new 1P solar tracking system, the Pioneer. The company has used fast-module hang technology and fewer fasteners for making the product, which reduces person-hours per MW.
- Such developments are expected to propel the single-axis solar tracker market in the region in the coming years.
United States Expected to Dominate the Market
- The United States has been on the track of solar progress for a long, with the combined effort of government agencies and private investors. The share of solar energy in the renewable power generation mix was around 165.4TWh (26%), the second ranking after wind energy. The source is expected to have a fast-paced growth in the unfolding scene, too, due to the government's efforts to expand the solar energy portfolio.
- The rising concerns for the high dependency on natural gas for energy generation, a fossil-based resource, and the upcoming utility-scale solar projects in the country will act as the catalyst for the solar tracker market.
- As per the Energy Information Administration and solar industry experts, solar energy leads the new renewable capacity added in the year 2022-2023. The utility-scale solar projects have accounted for nearly 49% of new capacity in 2022-2023, with 16 GW of value in 2023. The falling technology cost is expected to be the sole reason behind the prediction.
- The other major factor responsible for the growth of solar projects is the extension of ITC (Investment Tax Credit) for solar projects. For utility-scale solar projects, the allowance is for around 10% from the US Energy Department. Moreover, the country consumed over 1.8 quadrillion British thermal units of solar thermal and photovoltaic energy in 2022. This was the highest amount consumed yet and an increase of over 300 trillion British thermal units compared to the previous year.
- Moroever, in August 2023, Nextracker Inc. (NXT), a global manufacturer of solar trackers, and Asteelflash/USI, a high-end global electronics component manufacturer, announced the opening of Asteelflash's United States manufacturing line for Nextracker. Asteelflash has expanded its capability to include dedicated production of Nextracker's patented self-powered controller (SPC) and high-voltage power supply.
- Such developments will likely help the country to overshadow the other countries in the region in terms of market growth in the near future.
North America Solar Tracker Industry Overview
The North American solar tracker market is moderately fragmented. Some of the key players (in no particular order) include Nextracker Inc., PV Hardware Solutions, Valmont Industries Inc., Deger Canada Inc., and Nexans SA.
Additional Benefits:
- The market estimate (ME) sheet in Excel format
- 3 months of analyst support
TABLE OF CONTENTS
1 INTRODUCTION
- 1.1 Scope of the Study
- 1.2 Market Definition
- 1.3 Study Assumptions
2 RESEARCH METHODOLOGY
3 EXECUTIVE SUMMARY
4 MARKET OVERVIEW
- 4.1 Introduction
- 4.2 Market Size and Demand Forecast in USD, till 2029
- 4.3 Recent Trends and Developments
- 4.4 Government Policies and Regulations
- 4.5 Market Dynamics
- 4.5.1 Drivers
- 4.5.1.1 Favorable Government Initiatives
- 4.5.1.2 Increasing Adoption of Solar Energy
- 4.5.2 Restraints
- 4.5.2.1 Rising Adoption of Alternative Clean Energy
- 4.5.1 Drivers
- 4.6 Supply Chain Analysis
- 4.7 Porter's Five Forces Analysis
- 4.7.1 Bargaining Power of Suppliers
- 4.7.2 Bargaining Power of Consumers
- 4.7.3 Threat of New Entrants
- 4.7.4 Threat of Substitutes Products and Services
- 4.7.5 Intensity of Competitive Rivalry
5 MARKET SEGMENTATION
- 5.1 Axis-type
- 5.1.1 Single-Axis
- 5.1.2 Dual Axis
- 5.2 Geography
- 5.2.1 United States
- 5.2.2 Canada
- 5.2.3 Mexico
- 5.2.4 Rest of North America
6 COMPETITIVE LANDSCAPE
- 6.1 Mergers and Acquisitions, Joint Ventures, Collaborations, and Agreements
- 6.2 Strategies Adopted by Leading Players
- 6.3 Company Profiles
- 6.3.1 Nextracker Inc.
- 6.3.2 PV Hardware Solutions
- 6.3.3 Valmont Industries Inc.
- 6.3.4 Deger Canada Inc.
- 6.3.5 Nexans SA
- 6.3.6 First Sunergy LLC
- 6.3.7 Aiva Technology LLC
- 6.3.8 Alion Energy Inc.
- 6.3.9 DH Solar
- 6.3.10 Eppley Laboratory Inc.
- 6.4 Market Ranking/Share Analysis
7 MARKET OPPORTUNITIES AND FUTURE TRENDS
- 7.1 Technological Advancements in Solar Trackers
02-2729-4219
+886-2-2729-4219
 太陽能追蹤器的全球市場的評估:各類型,各技術,各用途,各地區,機會,預測(2018年~2032年)太陽能追蹤器的印度市場評估:各類型,各技術,各用途,各地區,機會,預測(2018年度~2032年度)
 2025年雙軸太陽能追蹤器全球市場報告
 全球太陽能追蹤器市場研究報告 - 產業分析、規模、佔有率、成長、趨勢和預測 2025 年至 2033 年
 太陽能追蹤器市場機會、成長動力、產業趨勢分析及 2025-2034 年預測2025 年太陽能追蹤器全球市場報告2025 年發電用太陽能追蹤器全球市場報告
 太陽能追蹤器市場、規模、佔有率、趨勢、行業分析報告(依類型、應用和地區)- 市場預測,2025-2034年中東和非洲太陽能追蹤器 -市場佔有率分析、行業趨勢、統計、成長預測(2025-2030)亞太地區太陽能追蹤器:市場佔有率分析、產業趨勢和成長預測(2025-2030 年)
▼