


 |
市場調查報告書
商品編碼
1645046
北美浮體式海上風電:市場佔有率分析、行業趨勢和統計、成長預測(2025-2030 年)North America Floating Offshore Wind Power - Market Share Analysis, Industry Trends & Statistics, Growth Forecasts (2025 - 2030) |
||||||
價格
※ 本網頁內容可能與最新版本有所差異。詳細情況請與我們聯繫。
簡介目錄
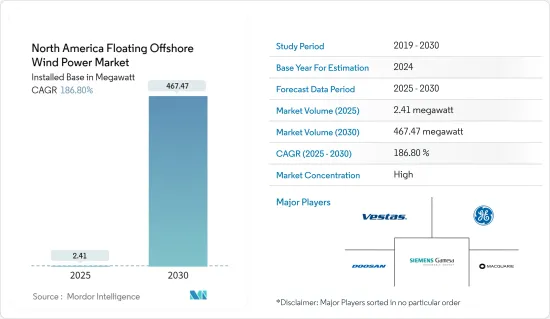
根據裝置容量計算,北美浮體式海上風電市場規模預計將從 2025 年的 2.41 兆瓦成長到 2030 年的 467.47 兆瓦,預測期內(2025-2030 年)的複合年成長率為 186.8%。
主要亮點
- 從中期來看,預計預測期內對離岸風力發電的需求不斷成長以及國際社會對減少二氧化碳排放的承諾將推動所研究市場的成長。
- 另一方面,預計在預測期內,清潔替代能源(主要是天然氣和太陽能)的日益普及將阻礙浮體式海上風電的成長。
- 然而,浮體式海上風電的技術創新和最新技術的採用可能會在預測期內為浮體式海上風電市場帶來機會。
- 美國佔據市場主導地位,並可能在預測期內實現最高的複合年成長率。
北美浮體式海上風電市場趨勢
深水作為關鍵領域
- 深水浮體式海上風電技術是最具經濟可行性的技術。此外,美國離岸風力發電技術資源大部分位於水深超過60公尺的水域。
- 浮體式海上風電技術的設計目標是,一旦安裝渦輪機,吃水相對較淺,並且具有流體動力動態。其他優點包括不受水深限制(大於 30 公尺)、安裝適應各種天氣條件、不受海床土壤條件限制、錨碇系統相對便宜且簡單、安裝和拆除簡單、因波動板引起的移動最小、總體風險低。
- 浮體式深海風電發電工程比陸上風力發電廠有許多優勢。海上風速很快且恆定,且附近沒有陸地,因此干擾較少。
- 根據國際可再生能源機構的《2023年可再生能源容量》資料,到2022年,風電裝置容量將達到1,520萬千瓦,高於2021年的1,400萬千瓦。
- 美國和加拿大都擁有大片沿海和深海區域,非常適合安裝浮體式海上風電。 Sable Island Bank 位於加拿大大西洋地區新斯科細亞省,每年將能夠生產高達 70,000 吉瓦時的電力,幫助加拿大實現 2050 年淨零排放目標。
- 同樣,離岸風電資源足夠豐富,到2050年可以產生美國四分之一的電力。 2023年,美國在羅德島和維吉尼亞沿岸建造了兩座小型風電場。該國首個商業規模風電場將於 2023 年 6 月在馬薩諸塞州瑪莎葡萄園島附近開幕。
- 因此,鑑於上述情況,預計深水領域將在預測期內佔據市場主導地位。
預計美國將主導市場
- 由於旨在促進國內能源生產的「美國優先」政策,美國的風力發電產業享受到政府的大力支持。由於該國擁有大片沿海地區可供租賃,因此浮體式海上風電產業被視為重點發展領域。
- 美國是總設備容量第二大的國家,2022 年裝置容量為 140.1 吉瓦,佔北美總設備容量的 80% 以上。
- 根據能源研究所《2023年世界能源統計評論》的資料,風電發電量將達到 439.2兆瓦時,比 2021 年增加。
- 美國設定了約45,000兆瓦離岸風力發電的採購目標。此外,隨著12個離岸風力發電計劃的開發,預計2026年離岸風力發電約為10.3吉瓦。這些政府措施可能在預測期內促進浮體式海上風電市場的發展。
- 根據國際可再生能源機構2023年的可再生能源容量資料,2022年離岸風力發電容量將達42兆瓦。
- 因此,鑑於上述情況,預計預測期內美國浮體式海上風電市場將顯著成長。
北美浮體式海上風電產業概況
北美浮體式海上風電市場相當分散。該市場的主要企業(不分先後順序)包括維斯塔斯風力系統公司、通用電氣公司、西門子歌美颯再生能源公司、斗山重工業和麥格理集團。
其他福利:
- Excel 格式的市場預測 (ME) 表
- 3 個月的分析師支持
目錄
第 1 章 簡介
- 研究範圍
- 市場定義
- 調查前提
第 2 章執行摘要
第3章調查方法
第4章 市場概況
- 介紹
- 裝置容量及 2028 年預測
- 最新趨勢和發展
- 政府法規和政策
- 市場動態
- 驅動程式
- 採用無碳發電源
- 政府優惠政策
- 限制因素
- 來自替代可再生能源的激烈競爭
- 驅動程式
- 供應鏈分析
- 波特五力分析
- 供應商的議價能力
- 消費者議價能力
- 新進入者的威脅
- 替代品的威脅
- 競爭對手之間的競爭
第5章 市場區隔
- 依深度(僅定性分析)
- 淺水(深度小於30公尺)
- 過渡區(深度30米至60米)
- 深海(深度60公尺以上)
- 地區
- 美國
- 加拿大
- 墨西哥
第6章 競爭格局
- 合併、收購、合作及合資
- 主要企業策略
- 公司簡介
- vestas wind systems a/s
- General Electric Company
- Siemens Gamesa Renewable Energy SA
- Doosan Heavy Industries & Construction
- Macquarie Group
- Equinor ASA
第7章 市場機會與未來趨勢
- 超深離岸風電場變電站平台開發
簡介目錄
Product Code: 50001781
The North America Floating Offshore Wind Power Market size in terms of installed base is expected to grow from 2.41 megawatt in 2025 to 467.47 megawatt by 2030, at a CAGR of 186.8% during the forecast period (2025-2030).
Key Highlights
- Over the medium term, the growing demand for offshore wind power coupled with international commitments to reduce carbon emissions are expected to drive the growth of the market studied during the forecast period.
- On the other hand, increasing adoption of alternate sources of clean power generation, mainly gas and solar power, are expected to hinder the growth of Floating Offshore wind power during the forecast period.
- Nevertheless, technological innovation and adaptation of the latest technologies in Floating Offshore wind power are likely to create opportunities for the Floating Offshore wind power market in the forecast period.
- The United States dominates the market and is also likely to witness the highest CAGR during the forecast period.
North America Floating Offshore Wind Power Market Trends
Deep Water as a Significant Segment
- Deepwater floating offshore wind power technology is the most economically viable technology because, at these depths, the cost of deployment of fixed-base structures is prohibitively high. Additionally, most of the total technical offshore wind resources in the United States lie over water depths greater than 60 m.
- Floating offshore wind power technology design is a relatively shallow draft and hydrodynamic stability after wind turbine installation. Other benefits include depth independence (above 30 meters), broad weather window for installation, insensitivity to subsea soil conditions, relatively cheap and simple mooring systems, simple installation and decommissioning, minimal level of movement due to heave plates, and overall lower risk.
- Floating deepwater offshore wind power projects offer more advantages than onshore wind farms. The wind speeds are higher and constant in the offshore regions, and the areas offer fewer hindrances due to no ground nearby in the vicinity.
- According to the International Renewable Energy Agency Renewable Energy Capacity 2023 data, the installed wind power capacity reached 15.2 GW in 2022, increasing from 14 GW in 2021.
- Both the United States and Canada offer significant coastal and deepwater offshore areas, thus providing excellent floating offshore wind power capacities. The Sable Island Bank in Nova Scotia, Atlantic Canada, could churn up to 70,000 Gigawatt-hours of electricity in a year, thus helping Canada reach its goal of net zero in 2050.
- Similarly, offshore wind resources are plentiful enough to generate up to a quarter of the United States' electricity by 2050, thus helping the country meet its global climate goals. In 2023, the United States had two small wind farms off the Rhode Island and Virginia coasts. The country's first commercial-scale wind farm off Martha's Vineyard was constructed on the foundations, Massachusetts, in June 2023.
- Hence, due to the above points, the deep water segment will dominate the market during the forecast period.
United States Expected to Dominate the Market
- The wind power sector in the United States is receiving immense support from the government due to the America First policy, which aims to boost domestic energy production. The floating offshore wind power sector is considered a major development area, as the country has a large coastal area available for leasing.
- The United States was the second-largest country in terms of total installed wind energy capacity, recording 140.1 GW of capacity in 2022, or more than 80% of the total wind energy capacity in North America.
- According to the Energy Institute Statistical Review of World Energy 2023 data, the electricity generation from wind power reached 439.2 terawatt-hours, increasing from 2021.
- The United States has established nearly 45,000 MW of offshore wind procurement targets. Additionally, around 10.3 GW of offshore wind energy is expected by 2026, with the development of 12 offshore wind energy projects. Such government initiatives are likely to increase the floating offshore wind power market during the forecast period.
- According to the International Renewable Energy Agency Renewable Energy Capacity 2023 data, the offshore wind power capacity reached 42 MW in 2022.
- Hence, owing to the above points, the United States is expected to see significant growth in the Offshore Floating wind power market during the forecast period.
North America Floating Offshore Wind Power Industry Overview
The North American Offshore Floating wind power market is moderately fragmented. Some of the key players in this market (in no particular order) include Vestas Wind Systems AS, General Electric Company, Siemens Gamesa Renewable Energy SA, Doosan Heavy Industries & Construction, and Macquarie Group.
Additional Benefits:
- The market estimate (ME) sheet in Excel format
- 3 months of analyst support
TABLE OF CONTENTS
1 INTRODUCTION
- 1.1 Scope of the Study
- 1.2 Market Definition
- 1.3 Study Assumptions
2 EXECUTIVE SUMMARY
3 RESEARCH METHODOLOGY
4 MARKET OVERVIEW
- 4.1 Introduction
- 4.2 Installed Capacity and Forecast, till 2028
- 4.3 Recent Trends and Developments
- 4.4 Government Policies and Regulations
- 4.5 Market Dynamics
- 4.5.1 Drivers
- 4.5.1.1 Adoption of Carbon Free Electricity Generation Sources
- 4.5.1.2 Favorable Government Policies
- 4.5.2 Restraints
- 4.5.2.1 Tough Competition from Alternative renewable energy sources
- 4.5.1 Drivers
- 4.6 Supply Chain Analysis
- 4.7 Porter's Five Force Analysis
- 4.7.1 Bargaining Power of Suppliers
- 4.7.2 Bargaining Power of Consumers
- 4.7.3 Threat of New Entrants
- 4.7.4 Threat of Substitutes Products and Services
- 4.7.5 Intensity of Competitive Rivalry
5 MARKET SEGMENTATION
- 5.1 By Water Depth (Qualitative Analysis Only)
- 5.1.1 Shallow Water ( less than 30 m Depth)
- 5.1.2 Transitional Water (30 m to 60 m Depth)
- 5.1.3 Deep Water (higher than 60 m Depth)
- 5.2 Geography
- 5.2.1 United States
- 5.2.2 Canada
- 5.2.3 Mexico
6 COMPETITIVE LANDSCAPE
- 6.1 Mergers, Acquisitions, Collaboration and Joint Ventures
- 6.2 Strategies Adopted by Key Players
- 6.3 Company Profiles
- 6.3.1 vestas wind systems a/s
- 6.3.2 General Electric Company
- 6.3.3 Siemens Gamesa Renewable Energy SA
- 6.3.4 Doosan Heavy Industries & Construction
- 6.3.5 Macquarie Group
- 6.3.6 Equinor ASA
7 MARKET OPPORTUNITIES AND FUTURE TRENDS
- 7.1 Developing Ultradeep water Offshore Wind farm Substation Platform
02-2729-4219
+886-2-2729-4219
 離岸風力發電市場規模、佔有率、成長分析,按組件、按水深、按安裝、按容量、按應用、按地區 - 行業預測,2025 年至 2032 年
 浮動離岸風能市場機會、成長動力、產業趨勢分析及2025-2034年預測海上風能市場機會、成長動力、產業趨勢分析及2025-2034年預測離岸風電電纜市場規模、佔有率和成長分析(按類型、材料、安裝類型、最終用途和地區)- 產業預測 2025-2032
 海上可再生能源市場報告:趨勢、預測和競爭分析(至 2031 年)
 2025 年離岸風力發電全球市場報告離岸風力發電市場:2033 年市場分析與預測 - 按類型、產品、服務、技術、組件、應用、安裝類型、設備、最終用戶、解決方案
 離岸風力發電市場:2025-2035年
 亞太地區浮體式海上風電:市場佔有率分析、產業趨勢與成長預測(2025-2030)德國海上風力發電-市場佔有率分析、產業趨勢與統計、成長預測(2025-2030 年)
▼