


 |
市場調查報告書
商品編碼
1684057
亞太水泥 -市場佔有率分析、產業趨勢和成長預測(2025-2030 年)Asia-Pacific Cement - Market Share Analysis, Industry Trends & Statistics, Growth Forecasts (2025 - 2030) |
||||||
價格
※ 本網頁內容可能與最新版本有所差異。詳細情況請與我們聯繫。
簡介目錄
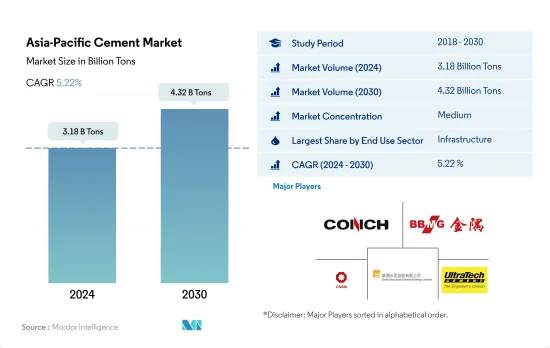
亞太水泥市場規模預計在2024年為31.8億噸,預計到2030年將達到43.2億噸,預測期內(2024-2030年)的複合年成長率為5.22%。
亞太地區的基礎設施支出預計將達到1.74兆美元,這可能會推動水泥需求。
- 2022年該地區水泥消費量較去年與前一年同期比較下降6.37%。下降的主要原因是商業、住宅和工業/機構部門的新占地面積下降。其中,2022年工業及機構及住宅領域新建占地面積分別較2021年下降5.63%及5.39%。至2023年,亞太地區將佔全球水泥市場的約72.53%。
- 預計基礎設施產業將成為該地區最大的水泥消費產業,到2022年將占到39.48%左右。隨著基礎設施項目投資的增加,該行業對水泥的需求預計將會增加。例如,印度的目標是到2030年將基礎建設投資達到4.5兆美元。預測顯示,到2030年該地區的基礎設施投資將達到1.74兆美元,其中2023年至2030年期間水泥產業的成長率為16.03%。
- 商業部門將成為該地區成長最快的水泥消費部門,預計預測期內複合年成長率為 6.48%。預計該地區對購物中心和辦公室等商業空間的需求將大幅增加。預計到 2025 年該地區將出現顯著成長,新商業占地面積與前一年同期比較增加 1.78 億平方英尺。例如,印尼計劃在2025年建成6個購物中心計劃,總面積達29.2萬平方公尺。由於這些趨勢,該地區的商業水泥市場預計將從 2022 年的約 3.36 億噸成長到 2030 年的 5.23 億噸。
雖然越南將成為成長最快的國家,但預計中國將在預測期內保持在亞太地區的領先地位。
- 2022年,亞太地區水泥需求預計將與前一年同期比較減6.4%,主要原因是該地區主要國家中國的需求下降11.3%。預計2023年該地區部分國家的需求將略有下降,預計整體成長率與2022年相比為負0.4%。
- 中國的建築產量一直居高不下,是亞太地區最大的水泥消費國。值得注意的是,到2022年,光是基礎設施領域就將佔亞太地區水泥總需求的79%。然而,由於房地產行業的挑戰和新基礎設施計劃的減少,預計中國水泥需求將在預測期內(2023-2030年)下降。
- 繼中國之後,印度已成為亞太地區第二大水泥消費國。印度住宅領域佔水泥需求的很大一部分,到2022年將佔該產業總需求的61%。與其他地區不同,印度主要依賴混凝土進行建築,這導致水泥需求增加。
- 在該地區的國家中,越南預計將出現最高的水泥需求成長,預測期內水泥需求量的複合年成長率為 7.46%。需求激增可歸因於促進房地產開發的新土地政策,以及政府在2030年建造100萬套經濟適用住宅的雄心勃勃的計劃。
亞太水泥市場趨勢
印度及其他地區零售和辦公空間的成長推動了亞太商業建築業的發展
- 2022年亞太地區零售新增占地面積與前一年同期比較去年同期下降3.23%。造成這項挫折的因素包括監管壓力、通貨膨脹上升和抵押房屋抵押貸款利率飆升等。預計到 2023 年,該地區將復甦,新增商業占地面積約 1.46 億平方英尺。激增的主要原因是外國直接投資(FDI)增加,刺激了對新辦公室、倉庫、零售店和其他設施的需求。其中,預計2023年越南建築業將吸引7,144萬美元的外國直接投資。
- 2020 年,亞太地區新零售占地面積遭遇重大挫折,與 2019 年相比下降了 21.92%。下降的主要原因是政府大規模封鎖擾亂了計劃工作,並嚴重影響了供應鏈、設施和勞動力。然而,隨著限制的放寬,該地區出現了顯著的復甦,2021 年新的商業占地面積躍升 20.98%,達到約 5.26 億平方英尺的占地面積。
- 預計亞太地區新商業占地面積將大幅成長,預計 2030 年將比 2023 年增加 14.1 億平方英尺。這一成長是由對購物中心、辦公空間和零售店不斷成長的需求所推動的。亞太地區已成為世界零售強國,貢獻了全球零售成長的近四分之三。例如,印度前七大城市的甲級辦公大樓市場規模到 2026 年可能成長至 10 億平方英尺,到 2030 年可能成長至 12 億平方英尺。整體而言,預測期內亞太地區新商業占地面積預計複合年成長率為 5.16%。
印度的經濟適用住宅將會增加,到2030年可能達到2,500萬套,該地區的住宅建設也將擴大。
- 2022年亞太地區住宅占地面積與前一年同期比較%。在新冠疫情期間建築活動激增之後,該行業正逐漸恢復正常,而此次建築活動數量出現下降。該地區住宅產業的發展受到人口成長、富裕程度提高和都市化快速發展的推動。預計 2023 年該地區新住宅占地面積將比 2022 年增加 4.1 億平方英尺。
- 2020年,亞太地區新建住宅占地面積較2019年下降約5.06%。這主要是由於政府封鎖、供應鏈中斷、勞動力短缺、建築生產力放緩以及外國投資低迷。然而,隨著限制措施的放寬,該地區出現了強勁復甦,由於新房屋建設增加,2021 年新住宅住宅占地面積激增約 14 億平方英尺。例如,僅在 2021 年,印度住宅房地產市場將在前七大城市推出約 163,000 套住宅。
- 預計預測期內亞太地區住宅新建占地面積的複合年成長率將達到 3.98%。這一成長是由於住宅需求、投資增加和政府的優惠政策所致。預計建造更多經濟適用住宅的重點將振興該地區的住宅建築業並推動其復甦。到 2030 年,預計印度將有超過 40% 的人口居住在都市區,這將需要額外 2,500 萬套經濟適用住宅。預計需求激增將有助於印度住宅房地產市場在 2030 年達到 150 萬套。
亞太地區水泥產業概況
亞太水泥市場適度整合,前五大公司佔50.04%。該市場的主要企業有:安徽海螺水泥股份有限公司、北京金隅集團、中國建築材料集團公司、華潤水泥控股和UltraTech Cement Ltd.(按字母順序排列)。
其他福利
- Excel 格式的市場預測 (ME) 表
- 3個月的分析師支持
目錄
第1章執行摘要和主要發現
第2章 報告要約
第3章 引言
- 研究假設和市場定義
- 研究範圍
- 調查方法
第4章 產業主要趨勢
- 最終用途趨勢
- 商業
- 工業/設施
- 基礎設施
- 住宅
- 重大基礎設施計劃(目前和已宣布)
- 法律規範
- 價值鍊和通路分析
第5章市場區隔
- 最終用途部門
- 商業
- 工業/設施
- 基礎設施
- 住宅
- 產品
- 混合水泥
- 纖維水泥
- 普通波特蘭水泥
- 白水泥
- 其他
- 國家
- 澳洲
- 中國
- 印度
- 印尼
- 日本
- 馬來西亞
- 韓國
- 泰國
- 越南
- 其他亞太地區
第6章競爭格局
- 關鍵策略趨勢
- 市場佔有率分析
- 商業狀況
- 公司簡介
- Adani Group
- Anhui Conch Cement Company Limited
- BBMG Corporation
- China National Building Material Group Corporation
- China Resource Cement Holdings
- SCG
- SIG
- TAIWAN CEMENT LTD.
- UltraTech Cement Ltd.
- Vietnam National Cement Corporation
第 7 章 CEO 的關鍵策略問題CEO 的關鍵策略問題
第 8 章 附錄
- 世界概況
- 概述
- 五力分析框架(產業吸引力分析)
- 全球價值鏈分析
- 市場動態(DRO)
- 資訊來源及延伸閱讀
- 圖片列表
- 關鍵見解
- 資料包
- 詞彙表
簡介目錄
Product Code: 50002010
The Asia-Pacific Cement Market size is estimated at 3.18 billion Tons in 2024, and is expected to reach 4.32 billion Tons by 2030, growing at a CAGR of 5.22% during the forecast period (2024-2030).
Infrastructure spending in Asia-Pacific is expected to reach USD 1.74 trillion and is likely to drive the demand for cement
- In 2022, the cement consumption volume in the region saw a 6.37% decline from the previous year. This drop was primarily driven by reduced new floor area constructions in the commercial, residential, and industrial & institutional sectors. Notably, the industrial & institutional, and residential sectors saw a 5.63% and 5.39% decrease in new floor area, respectively, in 2022, compared to 2021. By 2023, Asia-Pacific accounted for approximately 72.53% of the global cement market.
- The infrastructure sector emerged as the region's largest cement consumer, representing about 39.48% in 2022. With increased investments in infrastructure projects, this sector's cement demand is expected to rise. For instance, India has set its sights on a USD 4.5 trillion infrastructure investment by 2030. Projections indicate that infrastructure spending in the region will hit USD 1.74 trillion by 2030, propelling the cement sector to a 16.03% growth from 2023 to 2030.
- The commercial sector is poised to be the region's fastest-growing cement consumer, with a projected CAGR of 6.48% during the forecast period. The region is poised to experience a significant uptick in demand for commercial spaces, including shopping malls and offices. In 2025, the region is projected to witness a notable surge, adding 178 million sq. ft of new commercial floor area, compared to the previous year. For example, Indonesia has six shopping mall projects slated for completion by 2025, adding up to a total of 292 thousand sq. meters. These trends indicate that the cement market for the commercial sector in the region is set to reach 523 million tons in 2030, up from around 336 million tons in 2022.
Vietnam is the fastest-growing country, while China is expected to maintain its leading position in Asia-Pacific during the forecast period
- In 2022, the demand for cement in Asia-Pacific dropped by 6.4% compared to the previous year, primarily driven by an 11.3% decline in demand from China, which is the region's dominant player. Several countries in the region were expected to see a slight dip in demand in 2023, and the overall growth was projected to be negative, at -0.4%, compared to 2022.
- China, with its consistently high construction output, stands as the largest cement consumer in Asia-Pacific. Notably, in 2022, its infrastructure sector alone accounted for 79% of the region's total cement demand in that sector. However, China's cement demand is anticipated to decline during the forecast period (2023-2030) due to challenges in the real estate industry and a decrease in new infrastructure projects.
- Following China, India emerges as the second-largest consumer of cement in Asia-Pacific. The residential sector in India holds the major share of cement demand, representing 61% of the total demand across sectors in 2022. Unlike some of its regional counterparts, India predominantly relies on concrete for its buildings, driving up the demand for cement.
- Among the countries in the region, Vietnam is projected to witness the highest growth in the demand for cement, and it is expected to register a CAGR of 7.46% by volume during the forecast period. This surge in demand is likely to be attributed to new land policies that bolster real estate development and the government's ambitious plan to construct 1 million affordable housing units by 2030.
Asia-Pacific Cement Market Trends
Rising retail and office spaces in countries such as India to boost the Asia-Pacific commercial construction sector
- In 2022, Asia-Pacific witnessed a 3.23% decline in its commercial new floor area compared to the previous year. This setback was attributed to factors such as regulatory pressures, higher inflation, and a surge in mortgage rates. In 2023, the region rebounded, with commercial construction new floor area increasing by approximately 146 million sq. ft. This surge was primarily driven by a rise in foreign direct investment (FDI), which spurred the demand for new offices, warehouses, retail outlets, and other facilities. Notably, the Vietnamese construction sector attracted an FDI capital of USD 71.44 million in 2023.
- In 2020, the Asia-Pacific region experienced a significant setback in commercial new floor area, with a volume decline of 21.92% compared to 2019. This decline was primarily due to widespread government lockdowns, which disrupted project work and severely impacted supply chains, equipment, and labor. However, as restrictions eased, the region witnessed a remarkable rebound, with its commercial new floor area surging by 20.98% in 2021, reaching a volume of approximately 526 million sq. ft.
- Asia-Pacific's commercial new floor area is projected to witness substantial growth, with an estimated increase of 1.41 billion sq. ft by 2030 compared to 2023. This surge is fueled by a rising demand for shopping malls, office spaces, retail outlets, and more. The Asia-Pacific region is emerging as a global retail powerhouse, contributing to nearly three-quarters of the worldwide retail growth. For instance, the Indian Grade A office market in its top seven cities may to expand to 1 billion sq. ft by 2026 and further to 1.2 billion sq. ft. by 2030. Overall, the commercial new floor area in Asia-Pacific is projected to witness a volume CAGR of 5.16% during the forecast period.
Rising affordable housing units, such as India's likely to reach 25 million by 2030, to augment the residential constructions in the region
- In 2022, the residential new floor area in the Asia-Pacific region saw a volume decline of approximately 5.39% from the previous year. This dip was a result of the sector normalizing after a surge in building activity during the COVID-19 pandemic. The region's residential sector is driven by a growing population, increasing wealth, and rapid urbanization. The residential new floor area in the region was expected to rise by 410 million sq. ft in 2023 compared to 2022.
- In 2020, the residential new floor area in Asia-Pacific declined in volume by around 5.06% compared to 2019. This was primarily due to government-imposed lockdowns, disruptions in the supply chain, labor shortages, reduced construction productivity, and low foreign investments. However, as restrictions eased, the region saw a significant rebound, with the residential new floor area surging by about 1.4 billion sq. ft in 2021, driven by the addition of new residential housing units. For instance, in 2021 alone, the Indian residential real estate market introduced approximately 163 thousand new residential units across its top seven cities.
- The residential new floor area in the Asia-Pacific region is projected to witness a CAGR of 3.98% during the forecast period. This growth can be attributed to the demand for housing, increased investments, and favorable government policies. The focus on constructing more affordable housing units is expected to rejuvenate the residential construction sector in the region, aiding its recovery. By 2030, it is estimated that over 40% of India's population will reside in urban areas, leading to a demand for an additional 25 million affordable housing units. This surge in demand is expected to push the Indian residential real estate market to reach 1.5 million units by 2030.
Asia-Pacific Cement Industry Overview
The Asia-Pacific Cement Market is moderately consolidated, with the top five companies occupying 50.04%. The major players in this market are Anhui Conch Cement Company Limited, BBMG Corporation, China National Building Material Group Corporation, China Resource Cement Holdings and UltraTech Cement Ltd. (sorted alphabetically).
Additional Benefits:
- The market estimate (ME) sheet in Excel format
- 3 months of analyst support
TABLE OF CONTENTS
1 EXECUTIVE SUMMARY & KEY FINDINGS
2 REPORT OFFERS
3 INTRODUCTION
- 3.1 Study Assumptions & Market Definition
- 3.2 Scope of the Study
- 3.3 Research Methodology
4 KEY INDUSTRY TRENDS
- 4.1 End Use Sector Trends
- 4.1.1 Commercial
- 4.1.2 Industrial and Institutional
- 4.1.3 Infrastructure
- 4.1.4 Residential
- 4.2 Major Infrastructure Projects (current And Announced)
- 4.3 Regulatory Framework
- 4.4 Value Chain & Distribution Channel Analysis
5 MARKET SEGMENTATION (includes market size, forecasts up to 2030 and analysis of growth prospects.)
- 5.1 End Use Sector
- 5.1.1 Commercial
- 5.1.2 Industrial and Institutional
- 5.1.3 Infrastructure
- 5.1.4 Residential
- 5.2 Product
- 5.2.1 Blended Cement
- 5.2.2 Fiber Cement
- 5.2.3 Ordinary Portland Cement
- 5.2.4 White Cement
- 5.2.5 Other Types
- 5.3 Country
- 5.3.1 Australia
- 5.3.2 China
- 5.3.3 India
- 5.3.4 Indonesia
- 5.3.5 Japan
- 5.3.6 Malaysia
- 5.3.7 South Korea
- 5.3.8 Thailand
- 5.3.9 Vietnam
- 5.3.10 Rest of Asia-Pacific
6 COMPETITIVE LANDSCAPE
- 6.1 Key Strategic Moves
- 6.2 Market Share Analysis
- 6.3 Company Landscape
- 6.4 Company Profiles
- 6.4.1 Adani Group
- 6.4.2 Anhui Conch Cement Company Limited
- 6.4.3 BBMG Corporation
- 6.4.4 China National Building Material Group Corporation
- 6.4.5 China Resource Cement Holdings
- 6.4.6 SCG
- 6.4.7 SIG
- 6.4.8 TAIWAN CEMENT LTD.
- 6.4.9 UltraTech Cement Ltd.
- 6.4.10 Vietnam National Cement Corporation
7 KEY STRATEGIC QUESTIONS FOR CONCRETE, MORTARS AND CONSTRUCTION CHEMICALS CEOS
8 APPENDIX
- 8.1 Global Overview
- 8.1.1 Overview
- 8.1.2 Porter's Five Forces Framework (Industry Attractiveness Analysis)
- 8.1.3 Global Value Chain Analysis
- 8.1.4 Market Dynamics (DROs)
- 8.2 Sources & References
- 8.3 List of Tables & Figures
- 8.4 Primary Insights
- 8.5 Data Pack
- 8.6 Glossary of Terms
02-2729-4219
+886-2-2729-4219
 混合水泥市場 - 全球產業規模、佔有率、趨勢、機會和預測,細分,按應用、按最終用戶、按類型、按地區、按競爭,2020-2030F
 印尼水泥:市場佔有率分析、產業趨勢與統計、成長預測(2025-2030 年)
 印度水泥:市場佔有率分析、行業趨勢和統計、成長預測(2025-2030 年)
 水泥包裝市場規模、佔有率及成長分析(依材料、包裝類型、產量、最終用途及地區)-2025-2032 年產業預測
 混凝土和水泥,全球市場 2025-2029
 再生混凝土骨材市場規模、佔有率、成長分析、按來源、按產品類型、按加工方法、按應用、按地區 - 產業預測,2025 年至 2032 年
 鋼筋混凝土市場 - 全球產業規模、佔有率、趨勢、機會和預測,按應用、按製造流程、按地區、按競爭進行細分,2020-2030 年預測
 鋁酸鈣水泥市場規模、佔有率和成長分析(按類型、產品類型、功能、最終用途、配銷通路和地區)- 2025-2032 年行業預測
 2025-2033 年水泥市場規模、佔有率、趨勢和預測(按類型、最終用途和地區)
 全球水泥市場:依類型(普通波特蘭水泥、火山灰水泥、白水泥、波特蘭高爐礦渣水泥、混合水泥、其他)、用途和地區的預測(~2032年)
▼