


 |
市場調查報告書
商品編碼
1684581
軟性飲料包裝市場機會、成長動力、產業趨勢分析與預測 2025-2034Soft Drinks Packaging Market Opportunity, Growth Drivers, Industry Trend Analysis, and Forecast 2025-2034 |
||||||
2024 年全球軟性飲料包裝市場規模達到 870 億美元,預計 2025 年至 2034 年期間的複合年成長率為 3.4%。隨著人們對環境議題的認知不斷提高,品牌和消費者都開始傾向於使用環保包裝替代品,這標誌著產業的變革性轉變。在這些替代品中,紙質包裝正逐漸成為領先者,由於其可回收性和減少環境影響,成為塑膠的可行替代品。隨著全球減少浪費的舉措日益受到關注,紙質包裝預計將在未來十年的市場擴張中發揮關鍵作用。此外,技術進步和創新的包裝設計為品牌創造了新的機會,使其能夠提升市場吸引力,同時保持對永續發展的承諾。
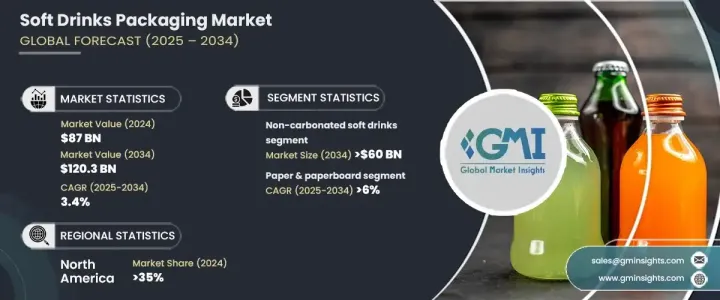
市場按飲料類型分為碳酸軟性飲料和非碳酸軟性飲料。隨著人們對更健康、更天然飲料的需求不斷成長,非碳酸軟性飲料市場預計到 2034 年將創造 600 億美元。非碳酸飲料,如果汁、冰茶、瓶裝水和運動飲料,被視為碳酸軟性飲料的較佳替代品,因為碳酸軟性飲料通常含有高糖分和人工成分。消費者轉向天然和健康飲料正在重塑市場格局,進一步推動對創新和永續包裝解決方案的需求。
| 市場範圍 | |
|---|---|
| 起始年份 | 2024 |
| 預測年份 | 2025-2034 |
| 起始值 | 870億美元 |
| 預測值 | 1203億美元 |
| 複合年成長率 | 3.4% |
按材料分類,市場涵蓋玻璃、金屬、紙和紙板、塑膠和其他材料。 2025 年至 2034 年間,紙和紙板產業預計將以 6% 的強勁複合年成長率成長,成為成長最快的類別。對永續選擇的需求正在加速從一次性塑膠向紙質解決方案的轉變,紙質解決方案被視為可生物分解且對環境更負責。隨著全球對塑膠廢棄物的監管越來越嚴格以及環保意識的增強,越來越多的品牌選擇紙質包裝來滿足消費者的期望和監管標準。
2024 年,北美將佔據全球軟性飲料包裝市場的 35% 佔有率,美國將引領區域成長。美國市場的發展受到消費者對便利性和環保包裝日益成長的偏好的推動。即飲飲料繼續佔據貨架主導地位,促使製造商投資可回收和簡約的包裝設計。此外,嚴格的政府政策和消費者日益增強的永續性意識迫使品牌採用更環保的做法,確保該領域的持續成長和創新。
目錄
第 1 章:方法論與範圍
- 市場範圍和定義
- 基礎估算與計算
- 預測計算
- 資料來源
- 基本的
- 次要
- 付費來源
- 公共資源
第 2 章:執行摘要
第 3 章:產業洞察
- 產業生態系統分析
- 影響價值鏈的因素
- 利潤率分析
- 中斷
- 未來展望
- 製造商
- 經銷商
- 重要新聞及舉措
- 監管格局
- 衝擊力
- 成長動力
- 增加紙質包裝的使用
- 消費者對永續性的需求不斷成長
- 新興市場的成長
- 功能性和優質飲料的創新
- 方便包裝需求不斷成長
- 產業陷阱與挑戰
- 來自替代包裝材料的競爭
- 原料成本上漲
- 成長動力
- 成長潛力分析
- 波特的分析
- PESTEL 分析
第4章:競爭格局
- 介紹
- 公司市佔率分析
- 競爭定位矩陣
- 戰略展望矩陣
第 5 章:市場估計與預測:按材料,2021 年至 2034 年
- 主要趨勢
- 塑膠
- 玻璃
- 金屬
- 紙和紙板
- 其他
第 6 章:市場估計與預測:按產品類型,2021-2034 年
- 主要趨勢
- 瓶子
- 罐頭
- 紙箱
- 袋裝
- 其他
第 7 章:市場估計與預測:按產能,2021-2034 年
- 主要趨勢
- 小包裝(最多250毫升)
- 中包裝(251毫升至1公升)
- 大包裝(1公升以上)
第 8 章:市場估計與預測:按軟性飲料類型,2021-2034 年
- 主要趨勢
- 碳酸飲料
- 非碳酸軟性飲料
第 9 章:市場估計與預測:按地區,2021 年至 2034 年
- 主要趨勢
- 北美洲
- 美國
- 加拿大
- 歐洲
- 英國
- 德國
- 法國
- 義大利
- 西班牙
- 俄羅斯
- 亞太地區
- 中國
- 印度
- 日本
- 韓國
- 澳洲
- 拉丁美洲
- 巴西
- 墨西哥
- 中東及非洲
- 南非
- 沙烏地阿拉伯
- 阿拉伯聯合大公國
第10章:公司簡介
- Amcor
- AptarGroup
- Ardagh Group
- Ball Corporation
- Berry Global Group
- CAN-PACK
- CPMC Holdings
- Crown Holdings
- Graham Packaging
- Graphic Packaging International
- Novelis
- Plastipak Holdings
- SIG
- Silgan Holdings
- Smurfit Kappa
- Tetra Pak
- Visy Industries
- WestRock
The Global Soft Drinks Packaging Market reached USD 87 billion in 2024 and is projected to grow at a CAGR of 3.4% from 2025 to 2034. This steady growth reflects the sector's dynamic response to shifting consumer preferences and regulatory pressures, particularly the heightened demand for sustainable packaging solutions. As awareness of environmental issues rises, brands and consumers alike are gravitating towards eco-friendly packaging alternatives, signaling a transformative shift in the industry. Among these alternatives, paper-based packaging is emerging as a frontrunner, offering a viable substitute for plastic due to its recyclability and reduced environmental footprint. With global initiatives aimed at minimizing waste gaining traction, the adoption of paper packaging is expected to play a pivotal role in the market's expansion over the next decade. Furthermore, technological advancements and innovative packaging designs are creating new opportunities for brands to enhance their market appeal while maintaining a commitment to sustainability.
The market is segmented by type of drink into carbonated soft drinks and non-carbonated soft drinks. The non-carbonated soft drinks segment is projected to generate USD 60 billion by 2034, driven by an increasing demand for healthier, more natural beverage options. Non-carbonated drinks, such as fruit juices, iced teas, bottled water, and sports drinks, are viewed as superior alternatives to carbonated soft drinks, which often contain high sugar content and artificial ingredients. This consumer shift towards natural and health-oriented beverages is reshaping the market landscape, further boosting the demand for innovative and sustainable packaging solutions.
| Market Scope | |
|---|---|
| Start Year | 2024 |
| Forecast Year | 2025-2034 |
| Start Value | $ 87 Billion |
| Forecast Value | $120.3 Billion |
| CAGR | 3.4% |
By material, the market encompasses glass, metal, paper and paperboard, plastic, and other materials. The paper and paperboard segment is poised to grow at a robust CAGR of 6% between 2025 and 2034, making it the fastest-growing category. The demand for sustainable options is accelerating the shift from single-use plastics to paper-based solutions, which are seen as biodegradable and more environmentally responsible. As global regulations tighten around plastic waste and environmental awareness intensifies, brands are increasingly opting for paper packaging to meet consumer expectations and regulatory standards.
In 2024, North America held a 35% share of the global soft drinks packaging market, with the United States spearheading regional growth. The US market is driven by rising consumer preferences for convenience and eco-friendly packaging. Ready-to-drink beverages continue to dominate the shelves, prompting manufacturers to invest in recyclable and minimalist packaging designs. Furthermore, stringent government policies and growing consumer consciousness about sustainability are compelling brands to adopt greener practices, ensuring continued growth and innovation in this segment.
Table of Contents
Chapter 1 Methodology & Scope
- 1.1 Market scope & definitions
- 1.2 Base estimates & calculations
- 1.3 Forecast calculations
- 1.4 Data sources
- 1.4.1 Primary
- 1.4.2 Secondary
- 1.4.2.1 Paid sources
- 1.4.2.2 Public sources
Chapter 2 Executive Summary
- 2.1 Industry synopsis, 2022-2034
Chapter 3 Industry Insights
- 3.1 Industry ecosystem analysis
- 3.1.1 Factor affecting the value chain
- 3.1.2 Profit margin analysis
- 3.1.3 Disruptions
- 3.1.4 Future outlook
- 3.1.5 Manufacturers
- 3.1.6 Distributors
- 3.2 Key news & initiatives
- 3.3 Regulatory landscape
- 3.4 Impact forces
- 3.4.1 Growth drivers
- 3.4.1.1 Increasing use of paper packaging
- 3.4.1.2 Rising consumer demand for sustainability
- 3.4.1.3 Growth of emerging markets
- 3.4.1.4 Innovation in functional and premium beverages
- 3.4.1.5 Increasing demand for convenience packaging
- 3.4.2 Industry pitfalls & challenges
- 3.4.2.1 Competition from alternative packaging materials
- 3.4.2.2 Rising raw material costs
- 3.4.1 Growth drivers
- 3.5 Growth potential analysis
- 3.6 Porter's analysis
- 3.7 PESTEL analysis
Chapter 4 Competitive Landscape, 2024
- 4.1 Introduction
- 4.2 Company market share analysis
- 4.3 Competitive positioning matrix
- 4.4 Strategic outlook matrix
Chapter 5 Market Estimates & Forecast, By Material, 2021-2034 (USD Billion & Kilo Tons)
- 5.1 Key trends
- 5.2 Plastic
- 5.3 Glass
- 5.4 Metal
- 5.5 Paper & paperboard
- 5.6 Others
Chapter 6 Market Estimates & Forecast, By Product Type, 2021-2034 (USD Billion & Kilo Tons)
- 6.1 Key trends
- 6.2 Bottles
- 6.3 Cans
- 6.4 Cartons
- 6.5 Pouches
- 6.6 Others
Chapter 7 Market Estimates & Forecast, By Capacity, 2021-2034 (USD Billion & Kilo Tons)
- 7.1 Key trends
- 7.2 Small packaging (Up to 250 ml)
- 7.3 Medium packaging (251 ml to 1 liter)
- 7.4 Large packaging (Above 1 liter)
Chapter 8 Market Estimates & Forecast, By Soft Drink Type, 2021-2034 (USD Billion & Kilo Tons)
- 8.1 Key trends
- 8.2 Carbonated soft drinks
- 8.3 Non-carbonated soft drinks
Chapter 9 Market Estimates & Forecast, By Region, 2021-2034 (USD Billion & Kilo Tons)
- 9.1 Key trends
- 9.2 North America
- 9.2.1 U.S.
- 9.2.2 Canada
- 9.3 Europe
- 9.3.1 UK
- 9.3.2 Germany
- 9.3.3 France
- 9.3.4 Italy
- 9.3.5 Spain
- 9.3.6 Russia
- 9.4 Asia Pacific
- 9.4.1 China
- 9.4.2 India
- 9.4.3 Japan
- 9.4.4 South Korea
- 9.4.5 Australia
- 9.5 Latin America
- 9.5.1 Brazil
- 9.5.2 Mexico
- 9.6 MEA
- 9.6.1 South Africa
- 9.6.2 Saudi Arabia
- 9.6.3 UAE
Chapter 10 Company Profiles
- 10.1 Amcor
- 10.2 AptarGroup
- 10.3 Ardagh Group
- 10.4 Ball Corporation
- 10.5 Berry Global Group
- 10.6 CAN-PACK
- 10.7 CPMC Holdings
- 10.8 Crown Holdings
- 10.9 Graham Packaging
- 10.10 Graphic Packaging International
- 10.11 Novelis
- 10.12 Plastipak Holdings
- 10.13 SIG
- 10.14 Silgan Holdings
- 10.15 Smurfit Kappa
- 10.16 Tetra Pak
- 10.17 Visy Industries
- 10.18 WestRock
 飲料包裝:市場佔有率分析、行業趨勢和統計數據、成長預測(2025-2030 年)
 酒精飲料包裝市場規模、佔有率和成長分析(按產品、材料、應用和地區)- 2025-2032 年產業預測
 2025 年酒精飲料包裝全球市場報告飲料包裝市場:依產品類型、應用和地區
 熱填充包裝市場報告:趨勢、預測和競爭分析(至 2031 年)
 飲料容器市場機會、成長動力、產業趨勢分析及 2025-2034 年預測飲料包裝市場規模、佔有率和成長分析(按材料、產品、數量、應用和地區)- 2025-2032 年行業預測飲料包裝市場機會、成長動力、產業趨勢分析與 2025 - 2034 年預測中東和非洲軟性飲料包裝:市場佔有率分析、產業趨勢、成長預測(2025-2030)亞太地區飲料包裝:市場佔有率分析、產業趨勢、成長預測(2025-2030)