


 |
市場調查報告書
商品編碼
1699425
數位看板市場機會、成長動力、產業趨勢分析及 2025-2034 年預測Digital Signage Market Opportunity, Growth Drivers, Industry Trend Analysis, and Forecast 2025-2034 |
||||||
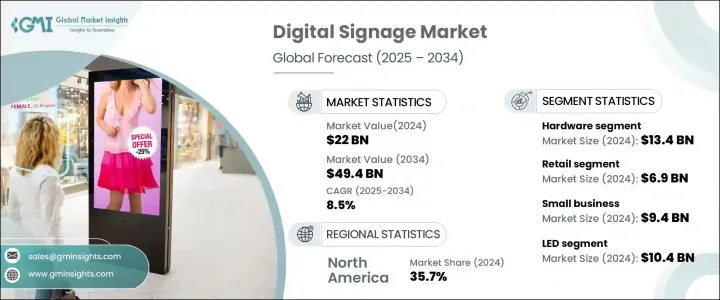
2024 年全球數位看板市場價值為 220 億美元,預計 2025 年至 2034 年期間的複合年成長率將達到 8.5%。這一成長主要得益於數位戶外 (DOOH) 廣告和人工智慧驅動內容的日益普及。企業正迅速從靜態廣告看板轉向動態數位顯示螢幕,提供即時內容更新、增強參與度和精準定位的廣告。對雲端支援、物聯網驅動的數位看板的需求正在上升,這使得企業能夠遠端管理內容並利用人們對 DOOH 廣告日益成長的興趣。 5G技術的部署進一步促進了無縫內容管理,確保了即時更新和個人化的推廣策略。
人工智慧整合是推動市場擴張的另一個關鍵因素。人工智慧數位顯示器可實現即時內容調整、受眾分析和個人化廣告。企業正在利用這些功能來分析消費者行為並提供有針對性的促銷。隨著零售店、交通樞紐和智慧城市擴大採用人工智慧標牌,對互動式和語音控制顯示器的需求持續激增。人工智慧的進步正在提高廣告的精準度,使企業能夠更有效地與受眾互動。
| 市場範圍 | |
|---|---|
| 起始年份 | 2024 |
| 預測年份 | 2025-2034 |
| 起始值 | 220億美元 |
| 預測值 | 494億美元 |
| 複合年成長率 | 8.5% |
就組件而言,市場分為硬體、軟體和服務。硬體領域由於顯示技術的進步仍將是最大的領域,到 2024 年其價值將達到 134 億美元。企業正在從 LCD 螢幕轉向節能的 LED、OLED 和 MicroLED 顯示器,這些顯示器可提供卓越的影像品質、更低的功耗和增強的耐用性。對 4K 和 8K 標誌的需求正在上升,特別是在需要高解析度視覺效果以獲得沉浸式廣告體驗的領域。
應用領域多元,涵蓋零售、醫療保健、飯店、交通、教育、企業環境和銀行業。零售業是占主導地位的行業,受互動式標牌和人工智慧個人化投資增加的推動,零售業的規模到 2024 年將達到 69 億美元。零售商正在整合這些數位顯示器,以增強消費者參與度、簡化廣告並提高營運效率。
根據最終用戶,市場分為小型企業、中型企業和大型企業。受訂閱式數位看板軟體價格實惠的推動,小型企業在 2024 年的收入將達到 94 億美元。即插即用標牌解決方案的出現使得小型企業能夠以最少的技術專長和投資採用數位廣告。
在顯示器類型中,LED顯示器佔據最大佔有率,到2024年將達到104億美元。其高亮度和耐候性使其成為戶外廣告和大型商業顯示器的理想選擇。 LED 面板成本的下降和製造流程的進步進一步促進了其應用。
室內數位看板的價值到 2024 年將達到 138 億美元,由於對店內顯示器、自助服務亭和互動式品牌參與解決方案的需求不斷成長,室內數位看板仍將佔據主導地位。用於導航和虛擬輔助的觸控螢幕標誌的普及度持續上升,增強了消費者體驗。
隨著零售商擴大使用小型數位顯示器進行動態定價、產品推薦和店內促銷,小型數位顯示器(尤其是 32 吋以下的數位顯示器)的市場規模到 2024 年將達到 60 億美元。這些經濟高效的解決方案迎合了尋求以可負擔的價格進入數位廣告領域的小型企業的需求。
互動內容是成長最快的部分,預計複合年成長率為 11.5%。觸控螢幕功能、運動感應器和人工智慧驅動的個人化正在徹底改變數位標牌,自助訂購亭和虛擬試穿解決方案越來越受歡迎。零售商和商業空間正在迅速採用這些技術來增強客戶參與度。
2024 年,北美佔據市場主導地位,佔有 35.7% 的佔有率,企業大力投資人工智慧驅動的內容管理和定向廣告。政府支持智慧城市發展和基礎設施改善的舉措進一步推動了該地區數位看板解決方案的採用。
目錄
第1章:方法論與範圍
- 市場範圍和定義
- 基礎估算與計算
- 預測計算
- 資料來源
- 基本的
- 次要
- 付費來源
- 公共資源
第2章:執行摘要
第3章:行業洞察
- 產業生態系統分析
- 供應商矩陣
- 利潤率分析
- 技術與創新格局
- 專利分析
- 重要新聞和舉措
- 監管格局
- 衝擊力
- 成長動力
- 對供應鏈透明度的需求不斷成長
- 顯示技術的進步
- 互動內容的需求不斷增加
- 智慧城市和基礎建設的成長
- 降低成本並提高投資報酬率
- 零售業的採用率不斷提高
- 產業陷阱與挑戰
- 初期投資及維護成本高
- 內容管理的複雜性
- 成長動力
- 成長潛力分析
- 波特的分析
- PESTEL分析
第4章:競爭格局
- 介紹
- 公司市佔率分析
- 競爭定位矩陣
- 戰略展望矩陣
第5章:市場估計與預測:按顯示類型,2021 - 2034 年
- 主要趨勢
- 液晶顯示器
- 引領
- OLED
- 其他
第6章:市場估計與預測:按組件,2021 - 2034 年
- 主要趨勢
- 硬體
- 軟體
- 服務
第7章:市場估計與預測:按地區,2021 - 2034 年
- 主要趨勢
- 室內的
- 戶外的
第8章:市場估計與預測:依顯示器尺寸,2021 - 2034 年
- 主要趨勢
- 低於32英寸
- 32至52英寸
- 52吋以上
第9章:市場估計與預測:依內容類型,2021 - 2034 年
- 主要趨勢
- 靜止的
- 動態的
- 互動的
第10章:市場估計與預測:依最終用途,2021 - 2034 年
- 主要趨勢
- 小型企業
- 中型企業
- 大型企業
第 11 章:市場估計與預測:按應用,2021 年至 2034 年
- 主要趨勢
- 零售
- 衛生保健
- 飯店業
- 運輸
- 教育
- 公司的
- 銀行業
- 其他
第 12 章:市場估計與預測:按地區,2021 年至 2034 年
- 主要趨勢
- 北美洲
- 美國
- 加拿大
- 歐洲
- 英國
- 德國
- 法國
- 義大利
- 西班牙
- 歐洲其他地區
- 亞太地區
- 中國
- 印度
- 日本
- 韓國
- 澳新銀行
- 亞太其他地區
- 拉丁美洲
- 巴西
- 墨西哥
- 拉丁美洲其他地區
- MEA
- 阿拉伯聯合大公國
- 南非
- 沙烏地阿拉伯
- MEA 其餘地區
第13章:公司簡介
- BrightSign LLC
- Cisco Systems
- Daktronics
- Elo Touch Solutions
- Four Winds Interactive
- LG Electronics
- Mvix Digital Signage
- Navori Labs
- NEC Corporation
- Onelan Limited
- Panasonic Corporation
- Philips Professional Display Solutions
- Planar Systems
- Samsung Electronics
- Scala, Inc.
- Sharp Corporation
- Sony Corporation
- Toshiba Global Commerce Solutions
- ViewSonic Corporation
- Visix, Inc.
The Global Digital Signage Market, valued at USD 22 billion in 2024, is expected to expand at an 8.5% CAGR from 2025 to 2034. This growth is primarily fueled by the increasing adoption of digital out-of-home (DOOH) advertising and AI-driven content. Businesses are rapidly transitioning from static billboards to dynamic digital displays that offer real-time content updates, enhanced engagement, and precision-targeted advertising. The demand for cloud-supported, IoT-powered digital signage is rising, enabling businesses to manage content remotely and capitalize on the growing interest in DOOH advertising. The deployment of 5G technology further facilitates seamless content management, ensuring real-time updates and personalized promotional strategies.
AI integration is another critical factor driving market expansion. AI-powered digital displays enable real-time content adjustments, audience analytics, and personalized advertising. Businesses are leveraging these capabilities to analyze consumer behavior and deliver targeted promotions. With the growing adoption of AI-driven signage in retail stores, transportation hubs, and smart cities, the demand for interactive and voice-controlled displays continues to surge. Advancements in AI are enhancing advertising precision, allowing businesses to engage with their audiences more effectively.
| Market Scope | |
|---|---|
| Start Year | 2024 |
| Forecast Year | 2025-2034 |
| Start Value | $22 Billion |
| Forecast Value | $49.4 Billion |
| CAGR | 8.5% |
In terms of components, the market is categorized into hardware, software, and services. The hardware segment, valued at USD 13.4 billion in 2024, remains the largest due to advancements in display technology. Businesses are shifting from LCD screens to energy-efficient LED, OLED, and MicroLED displays, which offer superior image quality, lower power consumption, and enhanced durability. The demand for 4K and 8K signage is rising, particularly in sectors that require high-resolution visuals for immersive advertising experiences.
The application landscape is diverse, encompassing retail, healthcare, hospitality, transportation, education, corporate environments, and banking. Retail, the dominant segment, reached USD 6.9 billion in 2024, driven by increased investment in interactive signage and AI-powered personalization. Retailers are integrating these digital displays to enhance consumer engagement, streamline advertising, and improve operational efficiency.
Based on end users, the market is segmented into small businesses, medium businesses, and large enterprises. Small businesses accounted for USD 9.4 billion in 2024, driven by the affordability of subscription-based digital signage software. The emergence of plug-and-play signage solutions allows smaller enterprises to adopt digital advertising with minimal technical expertise and investment.
Among display types, LED displays held the largest share at USD 10.4 billion in 2024. Their high brightness and weather resistance make them ideal for outdoor advertising and large-scale commercial displays. Declining LED panel costs and manufacturing advancements further boost their adoption.
Indoor digital signage, valued at USD 13.8 billion in 2024, remains dominant due to growing demand for in-store displays, self-service kiosks, and interactive brand engagement solutions. The popularity of touchscreen signage for navigation and virtual assistance continues to rise, enhancing consumer experiences.
Smaller digital displays, particularly those under 32 inches, reached USD 6 billion in 2024, as retailers increasingly use them for dynamic pricing, product recommendations, and in-store promotions. These cost-effective solutions cater to small businesses seeking affordable entry into digital advertising.
Interactive content is the fastest-growing segment, with a projected CAGR of 11.5%. Touchscreen functionality, motion sensors, and AI-driven personalization are revolutionizing digital signage, with self-ordering kiosks and virtual try-on solutions gaining popularity. Retailers and commercial spaces are rapidly adopting these technologies to enhance customer engagement.
North America led the market in 2024, holding a 35.7% share, with businesses heavily investing in AI-driven content management and targeted advertising. Government initiatives supporting smart city development and infrastructure enhancements further drive the adoption of digital signage solutions in the region.
Table of Contents
Chapter 1 Methodology & Scope
- 1.1 Market scope & definition
- 1.2 Base estimates & calculations
- 1.3 Forecast calculation
- 1.4 Data sources
- 1.4.1 Primary
- 1.4.2 Secondary
- 1.4.2.1 Paid sources
- 1.4.2.2 Public sources
Chapter 2 Executive Summary
- 2.1 Industry 360º synopsis, 2021 - 2034
Chapter 3 Industry Insights
- 3.1 Industry ecosystem analysis
- 3.2 Vendor matrix
- 3.3 Profit margin analysis
- 3.4 Technology & innovation landscape
- 3.5 Patent analysis
- 3.6 Key news and initiatives
- 3.7 Regulatory landscape
- 3.8 Impact forces
- 3.8.1 Growth drivers
- 3.8.1.1 Rising demand for supply chain transparency
- 3.8.1.2 Advancements in display technology
- 3.8.1.3 Increasing demand for interactive content
- 3.8.1.4 Growth of smart cities and infrastructure development
- 3.8.1.5 Cost reduction and improved ROI
- 3.8.1.6 Increasing adoption in the retail sector
- 3.8.2 Industry pitfalls & challenges
- 3.8.2.1 High initial investment and maintenance costs
- 3.8.2.2 Content management complexity
- 3.8.1 Growth drivers
- 3.9 Growth potential analysis
- 3.10 Porter's analysis
- 3.10.1 Supplier power
- 3.10.2 Buyer power
- 3.10.3 Threat of new entrants
- 3.10.4 Threat of substitutes
- 3.10.5 Industry rivalry
- 3.11 PESTEL analysis
Chapter 4 Competitive Landscape, 2023
- 4.1 Introduction
- 4.2 Company market share analysis
- 4.3 Competitive positioning matrix
- 4.4 Strategic outlook matrix
Chapter 5 Market Estimates & Forecast, By Display Type, 2021 - 2034 (USD million)
- 5.1 Key trends
- 5.2 LCD
- 5.3 LED
- 5.4 OLED
- 5.5 Others
Chapter 6 Market Estimates & Forecast, By Component, 2021 - 2034 (USD million)
- 6.1 Key trends
- 6.2 Hardware
- 6.3 Software
- 6.4 Services
Chapter 7 Market Estimates & Forecast, By Location, 2021 - 2034 (USD million)
- 7.1 Key trends
- 7.2 Indoor
- 7.3 Outdoor
Chapter 8 Market Estimates & Forecast, By Display Size, 2021 - 2034 (USD million)
- 8.1 Key trends
- 8.2 Below 32 inches
- 8.3 32 to 52 inches
- 8.4 Above 52 inches
Chapter 9 Market Estimates & Forecast, By Content Type, 2021 - 2034 (USD million)
- 9.1 Key trends
- 9.2 Static
- 9.3 Dynamic
- 9.4 Interactive
Chapter 10 Market Estimates & Forecast, By End Use, 2021 - 2034 (USD million)
- 10.1 Key trends
- 10.2 Small Businesses
- 10.3 Medium Businesses
- 10.4 Large Enterprises
Chapter 11 Market Estimates & Forecast, By Application, 2021 - 2034 (USD million)
- 11.1 Key trends
- 11.2 Retail
- 11.3 Healthcare
- 11.4 Hospitality
- 11.5 Transportation
- 11.6 Education
- 11.7 Corporate
- 11.8 Banking
- 11.9 Others
Chapter 12 Market Estimates & Forecast, By Region, 2021 - 2034 (USD million)
- 12.1 Key trends
- 12.2 North America
- 12.2.1 U.S.
- 12.2.2 Canada
- 12.3 Europe
- 12.3.1 UK
- 12.3.2 Germany
- 12.3.3 France
- 12.3.4 Italy
- 12.3.5 Spain
- 12.3.6 Rest of Europe
- 12.4 Asia Pacific
- 12.4.1 China
- 12.4.2 India
- 12.4.3 Japan
- 12.4.4 South Korea
- 12.4.5 ANZ
- 12.4.6 Rest of Asia Pacific
- 12.5 Latin America
- 12.5.1 Brazil
- 12.5.2 Mexico
- 12.5.3 Rest of Latin America
- 12.6 MEA
- 12.6.1 UAE
- 12.6.2 South Africa
- 12.6.3 Saudi Arabia
- 12.6.4 Rest of MEA
Chapter 13 Company Profiles
- 13.1 BrightSign LLC
- 13.2 Cisco Systems
- 13.3 Daktronics
- 13.4 Elo Touch Solutions
- 13.5 Four Winds Interactive
- 13.6 LG Electronics
- 13.7 Mvix Digital Signage
- 13.8 Navori Labs
- 13.9 NEC Corporation
- 13.10 Onelan Limited
- 13.11 Panasonic Corporation
- 13.12 Philips Professional Display Solutions
- 13.13 Planar Systems
- 13.14 Samsung Electronics
- 13.15 Scala, Inc.
- 13.16 Sharp Corporation
- 13.17 Sony Corporation
- 13.18 Toshiba Global Commerce Solutions
- 13.19 ViewSonic Corporation
- 13.20 Visix, Inc.
 拉丁美洲數位電子看板:市場佔有率分析、產業趨勢與統計、成長預測(2025-2030 年)美國數位電子看板:市場佔有率分析、產業趨勢與統計、成長預測(2025-2030 年)
 2025年數數位電子看板看板軟體全球市場報告2025年數位電子看板位看板全球市場報告
 2025 年至 2033 年智慧 LED 室內看板市場報告,按螢幕尺寸(小於 32 吋、32-35 吋、55 吋以上)、最終用戶(零售、企業、公共、體育等)和地區分類
 2025-2029 年全球教育數位電子看板
 半導體缺陷檢討系統的全球市場:~2031年
 數位數位電子看板軟體市場規模、佔有率和成長分析(按軟體類型、服務類型、部署、應用和地區)- 產業預測 2025-2032
 全球數位電子看板市場(2025-2029)
 全球醫療保健數位電子看板市場