

 |
市場調查報告書
商品編碼
1699429
VR 頭戴裝置市場機會、成長動力、產業趨勢分析及 2025-2034 年預測VR Headsets Market Opportunity, Growth Drivers, Industry Trend Analysis, and Forecast 2025-2034 |
||||||
2024 年全球 VR 頭戴裝置市場規模達到 91 億美元,預計 2025 年至 2034 年期間將達到 19.7% 的強勁複合年成長率。人工智慧 (AI) 與 VR 技術的日益融合極大地改變了用戶體驗,使虛擬環境更加智慧、更具互動性。人工智慧透過創建即時適應用戶行為的響應式虛擬設定來增強 VR 應用。隨著人工智慧的融入,製造流程的進步和生產規模的擴大正在降低 VR 頭戴裝置的成本,使公司能夠以更實惠的價格提供這些設備。隨著生產成本的下降,VR 頭戴裝置越來越受到更廣泛的消費者群體的青睞,促進了其廣泛普及。價格承受能力的不斷提高,加上遊戲、教育和其他行業對沉浸式內容的需求不斷成長,預計將在未來十年維持市場的成長軌跡。
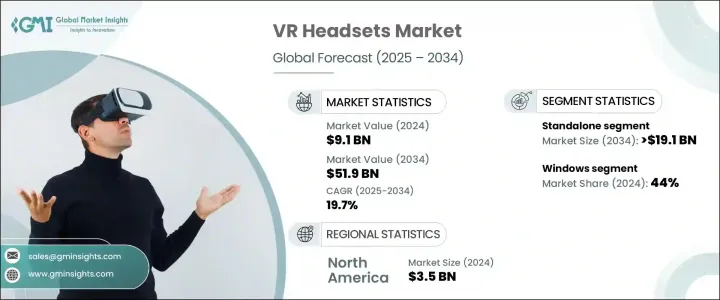
根據產品類型,VR 頭戴式裝置市場分為獨立設備、有線設備和智慧型手機設備。其中,VR一體機正迅速成為消費者的首選。 2024 年,獨立市場創造了約 34 億美元的收入,預計到 2034 年將超過 191 億美元。這些設備越來越受歡迎,因為它們提供了一體化解決方案,而無需 PC 或遊戲機等額外硬體。獨立耳機配有內建處理器、感應器和顯示器,使其更易於設定和使用。它們的無線功能增加了用戶的便利性並提高了行動性,從而吸引了許多尋求無憂 VR 體驗的用戶。
| 市場範圍 | |
|---|---|
| 起始年份 | 2024 |
| 預測年份 | 2025-2034 |
| 起始值 | 91億美元 |
| 預測值 | 519億美元 |
| 複合年成長率 | 19.7% |
依作業系統分析,VR 頭戴裝置市場分為 Windows、iOS 和 Android。 2024 年,Windows 市場佔據主導地位,創造了約 40 億美元的收入,佔了近 44% 的整體市場佔有率。這一領導地位得益於 Windows 與 VR 硬體的廣泛相容性及其強大的軟體開發生態系統。基於 Windows 的系統以提供在多個行業運行高級 VR 應用程式所需的高效能功能而聞名。由於用戶尋求具有強大圖形和處理支援的無縫虛擬實境體驗,該作業系統在遊戲界的強大地位也促進了其主導的市場佔有率。
從地區來看,北美在 VR 頭戴裝置市場佔據重要地位,2024 年的價值約為 35 億美元。預計該地區在 2025 年至 2034 年期間的複合年成長率將達到 19.7%。娛樂、醫療保健和教育等行業對 VR 的採用迅速成長,以及對新興 VR 技術的投資不斷增加,並繼續推動整個地區的需求。
目錄
第1章:方法論與範圍
- 市場範圍和定義
- 基礎估算與計算
- 預測參數
- 資料來源
- 基本的
- 次要
- 付費來源
- 公共資源
第2章:執行摘要
第3章:行業洞察
- 產業生態系統分析
- 影響價值鏈的因素
- 利潤率分析
- 中斷
- 未來展望
- 製造商
- 經銷商
- 零售商
- 衝擊力
- 成長動力
- 沉浸式科技的進步
- 擴大5G網路擴展
- 增加可支配收入
- 產業陷阱與挑戰
- 初期投資高
- 健康和安全問題
- 成長動力
- 消費者購買行為分析
- 人口趨勢
- 影響購買決策的因素
- 消費者產品採用
- 首選配銷通路
- 成長潛力分析
- 監管格局
- 定價分析
- 波特的分析
- PESTEL分析
第4章:競爭格局
- 介紹
- 公司市佔率分析
- 競爭定位矩陣
- 戰略展望矩陣
第5章:市場估計與預測:按類型,2021-2034
- 主要趨勢
- 繫留
- 獨立
- 支援智慧型手機
第6章:市場估計與預測:依組件,2021-2034
- 主要趨勢
- 硬體
- 軟體
第7章:市場估計與預測:依作業系統,2021 年至 2034 年
- 主要趨勢
- 視窗
- iOS
- 安卓
第8章:市場估計與預測:依連結技術,2021 年至 2034 年
- 主要趨勢
- 藍牙
- HDMI
- 無線上網
- 其他(NFC等)
第9章:市場估計與預測:按應用,2021 年至 2034 年
- 主要趨勢
- 遊戲和娛樂
- 教育
- 衛生保健
- 零售與電子商務
- 軍事與國防
- 工程與設計
- 其他
第 10 章:市場估計與預測:按配銷通路,2021 年至 2034 年
- 主要趨勢
- 線上
- 電子商務
- 公司網站
- 離線
- 超市和百貨公司
- 專賣店
- 遊戲商店
- 其他(B2B頻道、訂閱服務等)
第 11 章:市場估計與預測:按地區,2021 年至 2034 年
- 主要趨勢
- 北美洲
- 美國
- 加拿大
- 歐洲
- 德國
- 英國
- 法國
- 義大利
- 西班牙
- 歐洲其他地區
- 亞太地區
- 中國
- 印度
- 日本
- 韓國
- 亞太其他地區
- 拉丁美洲
- 巴西
- 墨西哥
- 拉丁美洲其他地區
- MEA
- 阿拉伯聯合大公國
- 沙烏地阿拉伯
- 南非
- MEA 其餘地區
第12章:公司簡介
- Google LLC
- HP Inc.
- HTC Corporation
- Lenovo Group Limited
- Magic Leap, Inc.
- Meta Platforms, Inc.
- Microsoft Corporation
- Pico Interactive, Inc.
- Pimax Technology (Shanghai) Co., Ltd.
- Razer Inc.
- Samsung Electronics Co., Ltd.
- Shenzhen Baofeng Mojing Technology Co., Ltd.
- Sony Group Corporation
- Valve Corporation
- Xiaomi Corporation
The Global VR Headsets Market reached USD 9.1 billion in 2024 and is projected to witness a robust growth rate of 19.7% CAGR from 2025 to 2034. The increasing integration of artificial intelligence (AI) with VR technology has significantly transformed user experiences, making virtual environments smarter and more interactive. AI is enhancing VR applications by creating responsive virtual settings that adapt to user behavior in real time. Along with AI integration, advancements in manufacturing processes and scaling production are driving down the cost of VR headsets, allowing companies to offer these devices at more affordable prices. As production expenses decline, VR headsets are becoming more accessible to a broader consumer segment, encouraging widespread adoption. The growing affordability, combined with a rising demand for immersive content in gaming, education, and other industries, is expected to sustain the market's growth trajectory over the next decade.
Based on product type, the VR headsets market is segmented into standalone, tethered, and smartphone-enabled devices. Among these, standalone VR headsets are rapidly becoming the preferred choice for consumers. In 2024, the standalone segment generated around USD 3.4 billion and is anticipated to exceed USD 19.1 billion by 2034. These devices are gaining popularity as they offer an all-in-one solution without the need for additional hardware such as PCs or gaming consoles. Standalone headsets come with built-in processors, sensors, and displays, making them easier to set up and use. Their wireless functionality adds to user convenience and improves mobility, making them attractive to a wide range of users seeking hassle-free VR experiences.
| Market Scope | |
|---|---|
| Start Year | 2024 |
| Forecast Year | 2025-2034 |
| Start Value | $9.1 Billion |
| Forecast Value | $51.9 Billion |
| CAGR | 19.7% |
When analyzed by operating system, the VR headsets market is segmented into Windows, iOS, and Android. The Windows segment dominated the market in 2024, generating approximately USD 4 billion and holding nearly 44% of the overall market share. This leadership position is supported by Windows' extensive compatibility with VR hardware and its robust software development ecosystem. Windows-based systems are known for offering high-performance capabilities necessary for running advanced VR applications across multiple industries. The operating system's strong foothold in the gaming community has also contributed to its dominant market share, as users seek seamless VR experiences with powerful graphics and processing support.
Regionally, North America held a significant position in the VR headsets market, with a value of around USD 3.5 billion in 2024. The region is expected to register a CAGR of 19.7% between 2025 and 2034. The rapid growth of VR adoption across industries such as entertainment, healthcare, and education, along with increasing investments in emerging VR technologies, continues to fuel demand across the region.
Table of Contents
Chapter 1 Methodology & Scope
- 1.1 Market scope & definition
- 1.2 Base estimates & calculations
- 1.3 Forecast parameters
- 1.4 Data sources
- 1.4.1 Primary
- 1.4.2 Secondary
- 1.4.2.1 Paid sources
- 1.4.2.2 Public sources
Chapter 2 Executive Summary
- 2.1 Industry 3600 synopsis, 2021 - 2034
Chapter 3 Industry Insights
- 3.1 Industry ecosystem analysis
- 3.1.1 Factor affecting the value chain
- 3.1.2 Profit margin analysis
- 3.1.3 Disruptions
- 3.1.4 Future outlook
- 3.1.5 Manufacturers
- 3.1.6 Distributors
- 3.1.7 Retailers
- 3.2 Impact forces
- 3.2.1 Growth drivers
- 3.2.1.1 Advancements in immersive technology
- 3.2.1.2 Expanding 5G network expansion
- 3.2.1.3 Increasing disposable income
- 3.2.2 Industry pitfalls & challenges
- 3.2.2.1 High initial investment
- 3.2.2.2 Health and Safety Concerns
- 3.2.1 Growth drivers
- 3.3 Consumer buying behavior analysis
- 3.3.1 Demographic trends
- 3.3.2 Factors affecting buying decisions
- 3.3.3 Consumer product adoption
- 3.3.4 Preferred distribution channel
- 3.4 Growth potential analysis
- 3.5 Regulatory landscape
- 3.6 Pricing analysis
- 3.7 Porter's analysis
- 3.8 PESTEL analysis
Chapter 4 Competitive Landscape, 2024
- 4.1 Introduction
- 4.2 Company market share analysis
- 4.3 Competitive positioning matrix
- 4.4 Strategic outlook matrix
Chapter 5 Market Estimates & Forecast, By Type, 2021-2034 (USD Billion) (Million Units)
- 5.1 Key Trends
- 5.2 Tethered
- 5.3 Standalone
- 5.4 Smartphone enabled
Chapter 6 Market Estimates & Forecast, By Component, 2021-2034 (USD Billion) (Million Units)
- 6.1 Key trends
- 6.2 Hardware
- 6.3 Software
Chapter 7 Market Estimates & Forecast, By Operating System, 2021 – 2034, (USD Billion) (Million Units)
- 7.1 Key trends
- 7.2 Windows
- 7.3 iOS
- 7.4 Android
Chapter 8 Market Estimates & Forecast, By Connectivity Technology, 2021 – 2034, (USD Billion) (Million Units)
- 8.1 Key trends
- 8.2 Bluetooth
- 8.3 HDMI
- 8.4 Wi-Fi
- 8.5 Others (NFC, etc.)
Chapter 9 Market Estimates & Forecast, By Application, 2021 – 2034, (USD Billion) (Million Units)
- 9.1 Key trends
- 9.2 Gaming & entertainment
- 9.3 Education
- 9.4 Healthcare
- 9.5 Retail & ecommerce
- 9.6 Military & defense
- 9.7 Engineering & design
- 9.8 Others
Chapter 10 Market Estimates & Forecast, By Distribution Channel, 2021 – 2034, (USD Billion) (Million Units)
- 10.1 Key trends
- 10.2 Online
- 10.2.1 E-commerce
- 10.2.2 Company websites
- 10.3 Offline
- 10.3.1 Supermarkets & department stores
- 10.3.2 Specialty stores
- 10.3.3 Gaming stores
- 10.3.4. Others (B2B channels, subscription services, etc.)
Chapter 11 Market Estimates & Forecast, By Region, 2021 – 2034, (USD Billion) (Million Units)
- 11.1 Key trends
- 11.2 North America
- 11.2.1 U.S.
- 11.2.2 Canada
- 11.3 Europe
- 11.3.1 Germany
- 11.3.2 U.K.
- 11.3.3 France
- 11.3.4 Italy
- 11.3.5 Spain
- 11.3.6 Rest of Europe
- 11.4 Asia Pacific
- 11.4.1 China
- 11.4.2 India
- 11.4.3 Japan
- 11.4.4 South Korea
- 11.4.5 Rest of Asia Pacific
- 11.5 Latin America
- 11.5.1 Brazil
- 11.5.2 Mexico
- 11.5.3 Rest of Latin America
- 11.6 MEA
- 11.6.1 UAE
- 11.6.2 Saudi Arabia
- 11.6.3 South Africa
- 11.6.4 Rest of MEA
Chapter 12 Company Profiles (Business Overview, Financial Data, Product Landscape, Strategic Outlook, SWOT Analysis)
- 12.1 Google LLC
- 12.2 HP Inc.
- 12.3 HTC Corporation
- 12.4 Lenovo Group Limited
- 12.5 Magic Leap, Inc.
- 12.6 Meta Platforms, Inc.
- 12.7 Microsoft Corporation
- 12.8 Pico Interactive, Inc.
- 12.9 Pimax Technology (Shanghai) Co., Ltd.
- 12.10 Razer Inc.
- 12.11 Samsung Electronics Co., Ltd.
- 12.12 Shenzhen Baofeng Mojing Technology Co., Ltd.
- 12.13 Sony Group Corporation
- 12.14 Valve Corporation
- 12.15 Xiaomi Corporation
 2025年虛擬與擴增實境的人工智慧全球市場報告
 2025年製造業擴增實境與虛擬實境全球市場報告
 基於位置的虛擬實境娛樂 (LBE) 市場:全球產業分析、規模、佔有率、成長、趨勢和預測(2025-2032 年)
 擴增實境與虛擬實境 2025-2029
 2025 年 AR/VR 晶片全球市場報告
 虛擬實境VR頭戴裝置全球市場 2025-2029
 VR頭戴裝置市場規模、佔有率、成長分析,按終端設備、按產品類型、按應用、按地區 - 行業預測,2025 年至 2032 年
 擴增實境硬體
 虛擬實境中人工智慧的全球市場:市場規模、佔有率、趨勢分析報告 - 按技術、平台、應用、地區分類的展望和預測,2024-2031年
 AR 和 VR 軟體市場:按類型、按平台、按軟體類型、按配置、按最終用戶 - 2025-2030 年全球預測