


 |
市場調查報告書
商品編碼
1632065
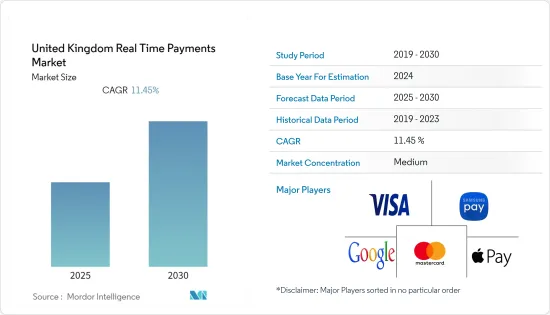
英國即時付款:市場佔有率分析、行業趨勢、統計數據和成長預測(2025-2030)United Kingdom Real Time Payments - Market Share Analysis, Industry Trends & Statistics, Growth Forecasts (2025 - 2030) |
||||||
※ 本網頁內容可能與最新版本有所差異。詳細情況請與我們聯繫。
英國即時付款市場預計在預測期內複合年成長率為 11.45%。
據估計,2021年英國將記錄34億筆即時交易,為企業和消費者節省9.5億美元的成本。這導致額外創造了32億美元的經濟產出,相當於該國GDP的0.10%。
到 2026 年,即時交易預計將成長至 58 億筆,為消費者和企業節省的淨成本將達到 18 億美元。這佔該國預計 GDP 的 0.11%,將有助於創造 38 億美元的額外經濟產出。這意味著即時付款的潛在經濟效益仍未開發。
根據 Cebr 的說法,如果所有費用都是即時進行的,理論上到 2026 年可能會使官方 GDP 增加 2.7%。儘管消費者獲得即時付款既簡單又便宜,英國的付款仍然嚴重依賴傳統工具,尤其是銀行卡。
在COVID-19大流行期間,即時付款的佔有率相對較高(佔所有交易的9.2%),但到2021年,英國消費者和企業從即時付款中獲得的淨收益將達到9.5億美元。 。
其中最大的一項是付款系統內交易成本降低所帶來的淨節省。以每筆交易計算,英國即時付款目前的平均付款成本比所有非即時價格的加權平均組合低 14.1%。
英國即時付款市場趨勢
對高度便捷的付款方式的需求日益成長
在英國,封鎖措施導致 2020 年至 2021 年大部分經濟停擺。企業也轉向在家工作,減少差旅費用和在市中心的支出。景氣和消費者信心下降導致消費者減少可自由支配支出和商業投資,導致 2020-21 年 GDP 下降 9.8%。
除了上述因素導致支付總額下降外,2020 年英國個人和企業的支付方式也發生了變化。這包括人們更多地使用非接觸式、線上和行動錢包管道,主要以現金付款為代價。疫情也影響了英國即時付款市場。
2020年,新冠肺炎疫情席捲全球,大大影響了我們的生活和工作方式。毫不奇怪,這對英國付款額產生了影響,2020 年英國支付金額下降了 11% 至 356 億日圓。
此外,2020 年卡片付款總額有所下降,但卡片付款的佔有率增加,2020 年超過一半(52%)的付款是卡片付款的。這是因為許多零售商鼓勵刷卡和非接觸式使用,而且由於封鎖,許多人選擇網路購物。同時,實體店和接觸密集型服務被關閉。
減少對現金的依賴
- 在英國,2020年現金付款持續長期下降,受疫情影響,現金使用量與前一年同期比較下降35%。自 2017 年以來,現金使用量每年減少約 15%,因此這種下降在 2020 年加速。這主要是由於疫情對現金使用的影響,現金付款比許多其他付款受到更大的影響。
- 結果,許多現金較多的企業關門,零售商因擔心現金成為 COVID-19 傳播媒介而推動非接觸式付款。
- 然而,2020 年,現金仍然是英國第二常用的付款方式,佔付款的不到五分之一。儘管付款總量有所下降,但隨著企業和消費者擴大使用線上和行動銀行進行付款和匯款,更快的支付出現了強勁成長。
- 尤其是行動銀行持續強勁成長,用戶不斷擴大他們可以使用這些服務執行的業務範圍,不僅限於檢查餘額,還包括一次性付款和其他財務管理。
- 英國356億筆支付中的大部分是由消費者支付的,佔十分之九的支付。 81% 的消費者付款用於自發性購買,其餘 19% 用於經常性帳單和承諾。
英國即時付款產業概況
隨著消費者偏好的快速變化,英國即時付款市場已成為利潤豐厚的選擇,並吸引了大量投資。具有巨大的成長潛力,市場隨著新參與企業變得越來越分散。服務提供者正在建立夥伴關係以促進產品創新。
2021年,英國金融市場研究顯示,年輕人比老年人更有可能使用Apple Pay、Google Pay或Samsung Pay。 2020 年,近三分之一(32%,即 1,730 萬)成年人口使用行動付款,較 2019 年增加了 740 萬(75%)。在使用行動付款的人中,84% 的人進行了支付。這些註冊用戶中有一半 (50%) 每兩週或更長時間付款一次。
其他好處:
- Excel 格式的市場預測 (ME) 表
- 3 個月的分析師支持
目錄
第1章簡介
- 研究假設和市場定義
- 調查範圍
第2章調查方法
第3章執行摘要
第4章市場洞察
- 市場概況
- 產業吸引力-波特五力分析
- 供應商的議價能力
- 買家/消費者的議價能力
- 新進入者的威脅
- 替代品的威脅
- 競爭公司之間的敵對關係
- 英國付款版圖的演變
- 與英國無現金交易擴張相關的主要市場趨勢
- COVID-19 對英國付款市場的影響
第5章市場動態
- 市場促進因素
- 提高網路普及率
- 傳統銀行業趨勢下降
- 對高度便捷的付款方式的需求日益成長
- 市場挑戰
- 線上付款詐騙增加的威脅
- 缺乏政府監管
- 市場機會
- 隨著政府政策鼓勵數位付款的發展,即時付款可望在一般民眾中普及。
- 數位付款產業的關鍵法規和標準
- 英國各地的監管情況
- 可能造成監管障礙的經營模式
- 經營狀況變化帶來的發展空間
- 關鍵案例和使用案例分析
第6章 市場細分
- 按付款類型
- P2P
- P2B
第7章 競爭格局
- 公司簡介
- ACI Worldwide Inc.
- Fiserv Inc.
- Paypal Holdings Inc.
- Mastercard Inc.
- Google LLC(Google Pay)
- VISA Inc.
- Apple Inc.(Apple Pay)
- Samsung Electronics(UK)Limited(Samsung Pay)
- Diners Club International
- Finastra Limited
第8章投資分析
第9章 市場未來展望
The United Kingdom Real Time Payments Market is expected to register a CAGR of 11.45% during the forecast period.
The UK recorded 3.4 billion real-time transactions in 2021, which resulted in an estimated cost savings of USD 950 million for businesses and consumers. This helped unlock USD 3.2 billion of additional economic output, representing 0.10% of the country's GDP.
With real-time transactions rising to 5.8 billion in 2026, net savings for consumers and businesses are forecast to climb to USD 1.8 billion. That would help to generate an additional USD 3.8 billion of economic output, equivalent to 0.11% of the country's forecasted GDP. That means the potential economic benefits of real-time payments remain untapped.
According to the Cebr, the theoretical impact of all charges being real-time could add 2.7% to formal GDP by 2026. Payments in the UK are still very much tied to traditional tools - especially cards - despite being easy and cheap for consumers to access real-time payments.
During the COVID-19 pandemic, a relatively strong real-time payments mix share (9.2% of all transactions), in 2021, net benefits for consumers and businesses of real-time payments hit USD 950 million in the United Kingdom.
The largest component of this was net savings through the transaction costs within the payments system. On a per-transaction basis, real-time payments in the UK currently have a 14.1% lower average payments cost than the weighted average mix of all non-real-time prices.
UK Real Time Payments Market Trends
Growing Requirement of Convenient Payment Options
In the United Kingdom, lockdowns resulted in large parts of the economy shutting down for details 2020-2021. Businesses also switched to working from home, reducing expenditure on travel and spending in city centers. The fall in business and consumer confidence saw consumers reduce discretionary spending while lower levels of business investment resulted in GDP falling by 9.8% in 2020-21.
Keeping above mentioned factors contributing to the fall in total payment volumes, 2020 in the UK also saw changes in how people and businesses paid. This included people making greater use of contactless, online, and mobile wallet channels, largely at the expense of cash payments. This is a permanent change to people's behavior, as in many other parts of people's lives; the pandemic has also affected UK real-time payment markets.
In 2020, the coronavirus pandemic hit the world, significantly impacting how most of us live and work. Unsurprisingly this also affected payment volumes in the UK, which declined by 11% to 35.6 billion in 2020.
Moreover, overall card payments in 2020 declined, and their share of payments increased, with over half (52%) of all payments made by cards in 2020. This was due to many retailers encouraging card and contactless use, along with lockdowns resulting in many people opting to shop online. At the same time, physical stores and contact-intensive services were shut down.
Declining Cash Dependency
- In the United Kingdom, cash payments continued their long-term decline in 2020, with the pandemic resulting in cash use falling by 35% compared to the previous year. Since 2017 cash use had been declining by around 15% each year, so 2020 represented an acceleration of this decline. This is largely attributed to the impact of the pandemic on cash use, with cash payments being affected to a greater degree than many other payments.
- They resulted in retailers pushing contactless payment options amid fears about cash being a vector for COVID-19 transmission, while many businesses with high levels of cash spend were closed.
- However, cash remained the second most frequently used payment method in the UK in 2020, being used for just under a fifth of the total number of payments made. Despite overall payment volumes falling, strong growth was seen in Faster Payments as businesses and consumers increasingly used online and mobile banking to make payments and transfer money.
- Mobile banking, in particular, continued to grow strongly, with users continually widening the range of tasks they perform using such services, exploring beyond checking their balances to make one-off payments and manage other aspects of their finances.
- Consumers made the large majority of the 35.6 billion payments in the UK, accounting for nearly nine out of ten costs. Spontaneous purchases accounted for 81% of payments made by consumers, with the other 19% of payments being made for regular bills and commitments
UK Real Time Payments Industry Overview
With consumer preferences changing rapidly, the United Kingdom real-time payments market has become a lucrative option and thus, has attracted a huge amount of investments. Due to the huge growth potential, the market is moving towards fragmentation due to the new entrants. The service providers are engaging in partnerships to promote product innovation.
In 2021, according to UK Finance market research, younger people were more likely than older people to use either Apple Pay, Google Pay, or Samsung Pay. Nearly a third (32%, 17.3 million people) of the adult population had registered for mobile payments in 2020, an increase of 7.4 million people (75%) compared with 2019. Of those noted for mobile payments, 84% of these people recorded a payment. Half (50%) of these registered users made payments fortnightly or more frequently.
Additional Benefits:
- The market estimate (ME) sheet in Excel format
- 3 months of analyst support
TABLE OF CONTENTS
1 INTRODUCTION
- 1.1 Study Assumptions and Market Definitions
- 1.2 Scope of the Study
2 RESEARCH METHODOLOGY
3 EXECUTIVE SUMMARY
4 MARKET INSIGHTS
- 4.1 Market Overview
- 4.2 Industry Attractiveness-Porter's Five Forces Analysis
- 4.2.1 Bargaining Power of Suppliers
- 4.2.2 Bargaining Power of Buyers/Consumers
- 4.2.3 Threat of New Entrants
- 4.2.4 Threat of Substitute Products
- 4.2.5 Intensity of Competitive Rivalry
- 4.3 Evolution of the payments landscape in the United Kingdom
- 4.4 Key market trends pertaining to the growth of cashless transaction in the United Kingdom
- 4.5 Impact of COVID-19 on the payments market in the United Kingdom
5 MARKET DYNAMICS
- 5.1 Market Drivers
- 5.1.1 Increased Internet Penetration
- 5.1.2 Decreasing Traditional Banking trend
- 5.1.3 Growing Requirement of Convenient Payment Options
- 5.2 Market Challenges
- 5.2.1 Threat of Growing Online Payment Fraud
- 5.2.2 Lack of Government Regulation
- 5.3 Market Opportunities
- 5.3.1 Government Policies Encouraging the Growth of Digital Paymentis expected to aid the growth of Real Time Payment methods amongst commoners
- 5.4 Key Regulations and Standards in the Digital Payments Industry
- 5.4.1 Regulatory Landscape Across the United Kingdom
- 5.4.2 Business Models with Potential Regulatory Roadblocks
- 5.4.3 Scope for Development in Lieu of Evolving Business Landscape
- 5.5 Analysis of major case studies and use-cases
6 Market Segmentation
- 6.1 By Type of Payment
- 6.1.1 P2P
- 6.1.2 P2B
7 Competitive Landscape
- 7.1 Company Profiles
- 7.1.1 ACI Worldwide Inc.
- 7.1.2 Fiserv Inc.
- 7.1.3 Paypal Holdings Inc.
- 7.1.4 Mastercard Inc.
- 7.1.5 Google LLC (Google Pay)
- 7.1.6 VISA Inc.
- 7.1.7 Apple Inc. (Apple Pay)
- 7.1.8 Samsung Electronics (UK) Limited (Samsung Pay)
- 7.1.9 Diners Club International
- 7.1.10 Finastra Limited
8 Investment Analysis
9 Future Outlook of the Market
 即時支付市場-全球產業規模、佔有率、趨勢、機會及預測(按組件、組織規模(中小企業和大型企業)、最終用戶、地區和競爭格局分類,2020-2030 年預測)
 按組件、部署模式、組織規模、交易類型、應用程式和最終用戶分類的即時支付市場 - 全球預測 2025-2032 年
 2025年全球即時支付市場報告
 即時支付:市場佔有率分析、行業趨勢、統計數據和成長預測(2025-2030 年)
 日本即時支付市場報告(按支付類型(P2P、P2B)和地區)2025-2033 年
 即時付款:2025-2029 年全球市場
 即時付款市場:按組件、按付款類型、按部署模式、按地區
 印度的即時付款市場的評估:各類型,各認證方法,各終端用戶,各地區,機會,預測,2018年~2032年中國即時付款市場:市場佔有率分析、產業趨勢與統計、成長預測(2025-2030 年)中東和非洲即時付款:市場佔有率分析、行業趨勢、統計數據、成長預測(2025-2030 年)