


 |
市場調查報告書
商品編碼
1635524
北美抽水蓄能能源:市場佔有率分析、產業趨勢與成長預測(2025-2030)North America Pumped Hydro Storage - Market Share Analysis, Industry Trends & Statistics, Growth Forecasts (2025 - 2030) |
||||||
價格
※ 本網頁內容可能與最新版本有所差異。詳細情況請與我們聯繫。
簡介目錄
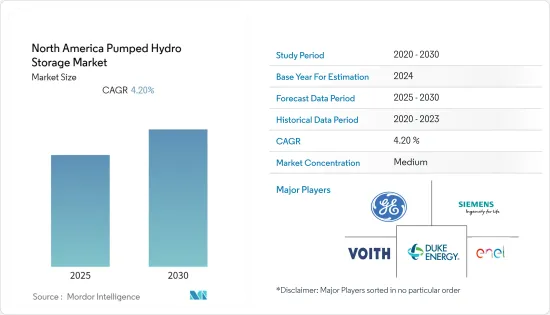
北美抽水蓄能能源市場預計在預測期內複合年成長率為4.2%。
2020 年市場受到 COVID-19 大流行的負面影響。目前市場處於大流行前的水平。
主要亮點
- 從長遠來看,可變再生能源來源的整合和確保電網穩定性等各種因素預計將在預測期內推動抽水蓄能水力發電(PHS)市場的發展。
- 另一方面,PHS計劃的環境和社會影響以及來自其他能源儲存技術的日益激烈的競爭預計將在預測期內限制市場研究。
- 美國和加拿大目前正在開發多種新型PSH技術,未來預計將增加PSH技術在能源儲存的開發和採用,同時降低成本和環境影響,因此,市場將出現一些機會。
- 由於全國發電工程的增加,美國預計將主導市場。
北美抽水蓄能發電市場趨勢
閉合迴路市場預計將主導市場
- 在閉合迴路系統中,建造抽水蓄能電站並人工建造一個或兩個水庫,並且沒有自然水流入任一水庫。儲存大量能量的唯一方法是將一大片水體放置在靠近第二個水體的地方,但盡可能高。在某些地方,這種情況自然發生。在某些地方,一個或兩個水體都是人工創造的。抽水蓄能系統的能量密度較低,導致水庫之間的高差和流量較大。
- 閉合迴路抽水蓄能具有高度靈活性、可靠性和高功率。閉合迴路抽水蓄能系統比開放回路抽水蓄能系統對環境的影響較小,因為它們不與現有河流系統連接。此外,它可以安裝在需要電網支援的地方,因此無需安裝在現有河流附近。
- 截至2021年,美國抽水蓄能發電容量已達到約2,191.2萬千瓦,較近年有所成長。根據美國能源局太平洋西北國家實驗室 (PNNL) 科學家 2021 年發布的一項研究,近年來閉合迴路系統的初步許可和許可申請數量大幅增加。
- 此外,2022年6月,美國能源局水力發電技術辦公室調查並宣布,全國有數千個地點適合閉合迴路抽水蓄能發電。美國閉合迴路蓄能能源資源評估是一項旨在確定閉合迴路PSH站點的大規模研究,對於開發商和相關人員來說是重要的參考。該研究以 30 公尺解析度進行了空間測繪,並確定了近 15,000 個未來可以最有效地部署這種 PSH 技術的位置。
- 鑑於上述幾點和近期趨勢,預計閉合迴路將在預測期內佔據市場主導地位。
美國主導市場
- 美國是該地區最大的水力發電用戶,也是抽水蓄能等現代化水力發電能源儲存系統的重要用戶。政府正在努力增加該國的水力發電能力。
- 抽水蓄能水力發電系統通常將水抽入上水庫所使用的電力多於利用所儲存的水發電的電力。 2021年,美國抽水蓄能夏季淨發電量排名前五的州為加州、維吉尼亞、南卡羅來納州、密西根州和喬治亞。
- 2022年5月,聯邦能源管理委員會報告稱,批准了27個抽水發電工程,總設備容量約為1,890萬千瓦。其中運作中24個,總設備容量約16.5GW。此外,自 2014 年初以來,FERC 已向三個擬議的抽水發電工程頒發了許可證。其餘的抽水蓄能電站是聯邦政府擁有的設施,例如田納西河谷管理局的浣熊山電站,還有一些由美國陸軍工兵團營運。
- 此外,2022 年 10 月,美國能源局水電技術辦公室舉措,鼓勵電力開發商和其他機構透過彈性電力系統水力發電和水創新 (HydroWIRES) 提升水力發電在電網中的作用計劃宣佈為感興趣的相關人員提供獲得技術援助的機會。此技術援助機會旨在為開發商和相關人員提供專業知識和能力,以解決抽水發電工程開發中的評估障礙。
- 鑑於上述情況,預計美國將在預測期內主導抽水蓄能能源市場。
北美抽水蓄能能源產業概況
北美抽水蓄能能源市場適度細分。該市場的主要企業包括(排名不分先後)通用電氣公司、西門子股份公司、Enel SpA、杜克能源公司和 Voith GmbH &Co.KGaA。
其他好處
- Excel 格式的市場預測 (ME) 表
- 3 個月分析師支持
目錄
第1章簡介
- 調查範圍
- 市場定義
- 研究場所
第 2 章執行摘要
第3章調查方法
第4章市場概況
- 介紹
- 至2027年市場規模及需求預測(單位:十億美元)
- 北美抽水蓄能發電容量(GW)及預測至2027年
- 北美水力發電裝置容量及預測(GW 基數,2027 年)
- 北美水力發電量(太瓦時,2013-2021)
- 最新趨勢和發展
- 政府法規和措施
- 市場動態
- 促進因素
- 抑制因素
- 供應鏈分析
- 波特五力分析
- 供應商的議價能力
- 消費者議價能力
- 新進入者的威脅
- 替代品的威脅
- 競爭公司之間敵對關係的強度
第5章市場區隔
- 按類型
- 開放回路
- 閉合迴路
- 按地區
- 美國
- 加拿大
- 墨西哥
第6章 競爭狀況
- 併購、合資、聯盟、協議
- 主要企業策略
- 公司簡介
- General Electric Company
- Siemens AG
- Enel SpA
- Duke Energy Corporation
- Voith GmbH & Co. KGaA
第7章 市場機會及未來趨勢
簡介目錄
Product Code: 93041
The North America Pumped Hydro Storage Market is expected to register a CAGR of 4.2% during the forecast period.
The market was negatively impacted by the COVID-19 pandemic in 2020. Presently, the market has reached pre-pandemic levels.
Key Highlights
- Over the long term, various factors, such as the integration of variable renewable energy sources and ensuring grid stability, are expected to drive the pumped hydro storage (PHS) market during the forecast period.
- On the other hand, the environmental and social impacts of PHS projects, coupled with increasing competition from other energy storage technologies, are expected to restrain the market studied during the forecast period.
- Nevertheless, several novel PSH technologies are currently under development in the United States and Canada, which are expected to increase the development and deployment of PSH technology for energy storage while reducing costs and environmental impacts in the future, thus creating several opportunities for the market during the forecast period.
- The United States is expected to dominate the market due to growing pumped hydro storage projects across the country.
North America Pumped Hydro Storage Market Trends
Closed-loop Segment Expected to Dominate the Market
- In closed-loop systems, pumped hydro storage plants are created, in which one/both the reservoirs are artificially built, and no natural inflows of water are involved with either reservoir. The only way to store a substantial amount of energy is by locating a large body of water near the second body of water but as high above as possible. In some places, this happens naturally. In others, one or both water bodies are artificial. The moderately low energy density of pumped storage systems entails either large differences in height or large flows between reservoirs.
- Closed-loop pumped hydro storage offers high flexibility, reliability, and high-power output. Since the closed-loop pumped-hydro systems are not connected to existing river systems, their impact on the environment is less compared to open-loop pumped hydro storage systems. Moreover, they can be located where support to the grid is required and therefore do not need to be positioned near an existing river.
- As of 2021, the pumped hydro storage capacity of the United States reached around 21.912 GW, which is growing compared with recent years. According to a study published by scientists from the US Department of Energy's Pacific Northwest National Laboratory (PNNL) in 2021, the number of preliminary permits and licensing applications for closed-loop systems has considerably increased in recent years.
- Furthermore, in June 2022, the US Department of Energy's Water Power Technologies Office researched and stated that thousands of locations across the country are suitable for closed-loop pumped storage hydropower. The closed-loop pumped storage hydropower resource assessment for the United States is a large-scale study to identify closed-loop PSH sites and an important reference for developers and stakeholders. The study used spatial mapping at 30-meter resolution and identified nearly 15,000 sites where this PSH technology can be best deployed in the future.
- Owing to the above points and recent developments, the closed loop segment is expected to dominate the market during the forecast period.
United States to Dominate the Market
- The United States is the largest user of hydropower in the region and a considerable user of modern water energy storage systems like pumped hydro storage. The government is pushing to increase the installed hydro capacity of the country.
- Pumped-storage hydroelectric systems generally use more electricity to pump water to upper water storage reservoirs than they produce with stored water. In 2021, the top five states in the United States with respect to pumped-storage hydroelectricity net summer generation capacity were California, Virginia, South Carolina, Michigan, and Georgia.
- Going forward, in May 2022, the Federal Energy Regulatory Commission reported 27 licensed pumped storage projects with a total installed capacity of nearly 18.9 GW. Of these, 24 are in operation with a total capacity of about 16.5 GW. Furtherly, FERC has issued licenses for three proposed pumped storage projects since the beginning of 2014. The remaining pumped storage plants are federally owned facilities, like the Tennessee Valley Authority's Raccoon Mountain plant, and several operated by the US Army Corps of Engineers.
- Furthermore, in October 2022, the US Department of Energy's Water Power Technologies Office announced an opportunity for power developers and other stakeholders to receive technical assistance to advance hydropower's role on the electric grid through the Hydropower and Water Innovation for a Resilient Electricity System (HydroWIRES) initiative. The technical assistance opportunity aims to provide the developers and stakeholders with national lab expertise and capabilities to address valuation hurdles in pumped hydro storage project development.
- Owing to the above points, the United States is expected to dominate the pumped hydro storage market during the forecast period.
North America Pumped Hydro Storage Industry Overview
The North American pumped hydro storage market is moderately fragmented. Some of the key players in the market (in no particular order) include General Electric Company, Siemens AG, Enel SpA, Duke Energy Corporation, and Voith GmbH & Co. KGaA, among others.
Additional Benefits:
- The market estimate (ME) sheet in Excel format
- 3 months of analyst support
TABLE OF CONTENTS
1 INTRODUCTION
- 1.1 Scope of the Study
- 1.2 Market Definition
- 1.3 Study Assumptions
2 EXECUTIVE SUMMARY
3 RESEARCH METHODOLOGY
4 MARKET OVERVIEW
- 4.1 Introduction
- 4.2 Market Size and Demand Forecast in USD billion, till 2027
- 4.3 North America Pumped Hydro Installed Capacity and Forecast in GW, till 2027
- 4.4 North America Hydro Power Installed Capacity and Forecast in GW, till 2027
- 4.5 North America Hydroelectricity Generation in TWh, 2013-2021
- 4.6 Recent Trends and Developments
- 4.7 Government Policies and Regulations
- 4.8 Market Dynamics
- 4.8.1 Drivers
- 4.8.2 Restraints
- 4.9 Supply Chain Analysis
- 4.10 Porter's Five Forces Analysis
- 4.10.1 Bargaining Power of Suppliers
- 4.10.2 Bargaining Power of Consumers
- 4.10.3 Threat of New Entrants
- 4.10.4 Threat of Substitute Products and Services
- 4.10.5 Intensity of Competitive Rivalry
5 MARKET SEGMENTATION
- 5.1 By Type
- 5.1.1 Open-loop
- 5.1.2 Closed-loop
- 5.2 By Geography
- 5.2.1 United States
- 5.2.2 Canada
- 5.2.3 Mexico
6 COMPETITIVE LANDSCAPE
- 6.1 Mergers and Acquisitions, Joint Ventures, Collaborations, and Agreements
- 6.2 Strategies Adopted by Leading Players
- 6.3 Company Profiles
- 6.3.1 General Electric Company
- 6.3.2 Siemens AG
- 6.3.3 Enel SpA
- 6.3.4 Duke Energy Corporation
- 6.3.5 Voith GmbH & Co. KGaA
7 MARKET OPPORTUNITIES AND FUTURE TRENDS
02-2729-4219
+886-2-2729-4219
 抽水蓄能發電:市場佔有率分析、產業趨勢與統計、成長預測(2025-2030 年)
 2025年全球抽水蓄能市場報告亞太地區抽水蓄能:市場佔有率分析、產業趨勢與成長預測(2025-2030 年)南美洲抽水蓄能儲能:市場佔有率分析、產業趨勢與成長預測(2025-2030)
 抽水蓄能能源市場:按類型、應用和最終用途分類-2025-2030 年全球預測
 抽水蓄能市場規模 - 按系統類型(開迴路、閉迴路、創新)、區域展望和預測,2024 年至 2032 年
 全球抽水蓄能發電市場:市場規模與佔有率分析(依類型(開環、閉環))、工業需求預測(截至2030年)
 抽水蓄能發電市場:按類型和地區分類