


 |
市場調查報告書
商品編碼
1636163
合規排碳權:市場佔有率分析、產業趨勢、成長預測(2025-2030)Compliance Carbon Credit - Market Share Analysis, Industry Trends & Statistics, Growth Forecasts (2025 - 2030) |
||||||
※ 本網頁內容可能與最新版本有所差異。詳細情況請與我們聯繫。
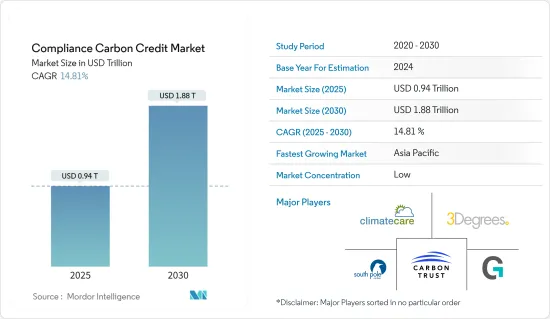
合規排碳權市場規模預計到 2025 年將達到 9,400 億美元,到 2030 年將達到 1.88 兆美元,預測期內(2025-2030 年)複合年成長率為 14.81%。
合規性排碳權市場在限制溫室氣體排放的法律規範下運作,例如排放交易體系(ETS)和總量管制與交易體系。其主要功能是為工業、發電廠和運輸部門等受排放法規約束的營業單位提供一種機制,透過購買排碳權來履行其合規義務。
由於不同國家和地區引入了排放權交易體系和法律規範,監管情況也各不相同。主要合規市場包括歐盟排放交易體系 (EU ETS)、加州的總量管制與交易計畫、區域溫室氣體計劃 (RGGI) 以及中國、韓國和紐西蘭的各種國家計畫。
合規排碳權來自各種排放計劃,包括可再生能源裝置(例如風能、太陽能)、能源效率措施、林業和土地利用計劃(例如造林、重新造林)以及工業流程改善。
合規排碳權市場趨勢
英國脫歐後英國排放交易體系為碳定價定下了基調
- 2020年脫歐後,英國以碳定價機制UK-ETS取代了對EU-ETS的參與。此舉允許英國建立排放交易體系並制定獨立於歐盟的碳定價政策。
- 自2021年1月推出以來,英國排放交易計畫(UK-ETS)中交易的排放排放(UKA)價格經歷了大幅波動。據行業專家稱,價格於2022年8月19日觸及每噸97.75英鎊的高位,顯示強勁的需求和監管因素正在推動價格走高。然而,2023年5月31日,價格跌至每噸51.04英鎊,為2022年1月之前記錄的最低價格。影響價格下跌的因素可能有多種,包括市場狀況的變化、監管調整以及供需動態的變化。
- 2022 年,UK-ETS 產生了總計 4.3 英鎊的可觀收益。該收益代表了碳價格對英國受監管營業單位的財務影響,包括工業設施、發電廠和排放交易計劃涵蓋的其他部門。碳排放收益反映了這些營業單位的合規成本,並有助於政府為氣候相關措施和投資提供資金。
可再生能源發電的投資和創新將推動排碳權的產生
- 許多能源公司正在投資風能、水力發電和太陽能等可再生能源,以減少碳排放。這種向清潔能源發電的轉變創造了從可再生能源計劃中產生合規排碳權的機會。
- 例如,2024 年 2 月,智利在歐洲尋求太陽能、風能和綠氫技術投資者,以使銅礦和其他依賴石化燃料的產業脫碳。在歐盟-智利貿易和投資協定重新談判期間,代表102家公共和私人公司的氫能協會H2Chile主席Marcos Kurka前往歐洲介紹了政府的能源戰略。
- 此外,產業專家認為,區塊鏈技術可以透過與MRV(數位監控、報告和檢驗)系統整合來增強碳市場中排碳權的檢驗。 MRV 系統從衛星影像、物聯網感測器和監控系統等各種來源收集資料。數位 MRV資料經過哈希處理並上傳到區塊鏈以檢驗排碳權。智慧合約透過確保排碳權僅發放給符合特定標準的計劃來自動化檢驗流程。使用去中心化的Oracle,可以將鏈下資訊來源添加到檢驗過程中,從而實現即時排碳權檢驗。
合規排碳權產業概覽
各種認證機構和標準機構根據預先定義的標準和方法對排放計劃進行認證並發放碳權。認證機構之間可能存在競爭,以吸引尋求認證服務的計劃開發商,認證費用、時間表和聲譽的差異會影響認證機構的選擇。排碳權價格和市場動態可能會隨著時間的推移以及不同市場之間的大幅波動,導致定價、流動性和市場行為的分散。這種波動使市場參與企業難以有效預測和駕馭市場狀況。 Carbon Trust、Climate Care、3Degrees 等公司正在參與碳權市場。
其他好處:
- Excel 格式的市場預測 (ME) 表
- 3 個月的分析師支持
目錄
第1章簡介
- 研究成果
- 研究場所
- 調查範圍
第2章調查方法
第3章執行摘要
第4章市場洞察
- 目前的市場狀況
- 科技趨勢
- 產業價值鏈分析
- 政府法規和舉措
第5章市場動態
- 促進因素
- 強化法規政策
- 加大企業永續性努力
- 抑制因素
- 市場複雜性和不確定性
- 機會
- 創新和技術進步
- 產業吸引力-波特五力分析
- 供應商的議價能力
- 消費者/買方議價能力
- 新進入者的威脅
- 替代品的威脅
- 競爭公司之間敵對關係的強度
第6章 市場細分
- 按信用類型
- 可再生能源計劃
- 林業和土地利用
- 能源效率
- 工業流程改進
- 按行業分類
- 能源部門
- 交通運輸部門
- 工業部門
- 農業/林業
- 按地區
- 北美洲
- 美國
- 加拿大
- 歐洲
- 英國
- 德國
- 法國
- 其他歐洲國家
- 亞太地區
- 中國
- 日本
- 印度
- 韓國
- 其他亞太地區
- 中東/非洲
- 拉丁美洲
- 北美洲
第7章 競爭格局
- 公司簡介
- Carbon Trust
- ClimateCare
- 3Degrees
- South Pole
- Gold Standard
- Natural Capital Partners
- Shell New Energies
- Sustainable Travel International
- Forest Carbon
- Atmosfair
- 其他公司
第8章 市場機會及未來趨勢
第9章 附錄
The Compliance Carbon Credit Market size is estimated at USD 0.94 trillion in 2025, and is expected to reach USD 1.88 trillion by 2030, at a CAGR of 14.81% during the forecast period (2025-2030).
The compliance carbon credit market operates under regulatory frameworks that limit greenhouse gas emissions, such as emissions trading schemes (ETS) or cap-and-trade systems. Its primary function is to provide a mechanism for entities subject to emissions regulations, such as industries, power plants, and transportation sectors, to meet compliance obligations by purchasing carbon credits.
Compliance carbon markets operate within a diverse regulatory landscape, with different jurisdictions implementing emissions trading schemes and regulatory frameworks. Major compliance markets include the European Union Emissions Trading System (EU ETS), the California Cap-and-Trade Program, the Regional Greenhouse Gas Initiative (RGGI), and various national schemes in China, South Korea, and New Zealand.
Compliance carbon credits are generated from various emission reduction projects, including renewable energy installations (e.g., wind, solar), energy efficiency initiatives, forestry and land-use projects (e.g., afforestation, reforestation), and industrial process improvements.
Compliance Carbon Credit Market Trends
Charting the Course of Carbon Pricing: UK-ETS Post-Brexit
- After leaving the European Union in 2020, the United Kingdom implemented its carbon pricing mechanism, the UK-ETS, which replaced its participation in the EU-ETS. This transition allowed the United Kingdom to establish its emissions trading system and set its carbon pricing policies independent of the European Union.
- The price of emissions allowances (UKAs) traded on the United Kingdom's Emissions Trading System (UK-ETS) has experienced notable fluctuations since its inception in January 2021. According to industry experts, the price reached a high of GBP 97.75 per metric ton on August 19, 2022, indicating strong demand or regulatory factors driving the price. However, by May 31, 2023, the price dropped to GBP 51.04 per metric ton, marking the lowest price before January 2022. Various factors, including changes in market conditions, regulatory adjustments, or shifts in supply and demand dynamics, could have influenced this decline in price.
- In 2022, the UK-ETS generated significant revenue, totaling GBP 4.3. This revenue represents the financial impact of carbon pricing on regulated entities within the United Kingdom, including industrial facilities, power plants, and other sectors covered by the emissions trading system. The revenue generated from carbon allowances reflects the cost of compliance for these entities and contributes to government funds dedicated to climate-related initiatives and investments.
Renewable Energy Investments and Technological Innovations Driving Carbon Credit Generation
- Many energy companies invest in renewable power sources, including wind, hydroelectric, and solar power, to reduce their carbon footprint. This shift toward cleaner energy production creates opportunities for generating compliance carbon credits from renewable energy projects.
- For instance, in February 2024, Chile embarked on a European hunt for investors in solar, wind, and green hydrogen technologies to decarbonize copper mines and other industries reliant on fossil fuels. During renegotiations of the EU Chile Trade and Investment Agreement, Marcos Kulka, president of H2Chile, a hydrogen association representing 102 publicly and privately owned companies, went to Europe to present his government's energy strategy.
- Further, Industry experts believe blockchain technology can enhance carbon credit validation in the carbon market by integrating with MRV (Digital Monitoring, Reporting, and Verification) systems. MRV systems collect data from various sources, including satellite images, IoT sensors, and monitoring systems. The digital MRV data is hashed and uploaded to the blockchain to verify carbon credits. Smart contracts automate the verification process by ensuring carbon credits are issued only to projects that fulfill specific criteria. Using decentralized oracles, off-chain information feeds can be added to the validation process, allowing for real-time carbon credit validation.
Compliance Carbon Credit Industry Overview
Various certification bodies and standards organizations certify emission reduction projects and issue carbon credits based on predefined criteria and methodologies. Competition may exist among certification bodies to attract project developers seeking certification services, with differences in certification fees, timelines, and reputation influencing their choice of certifier. Carbon credit prices and market dynamics can vary significantly over time and across different markets, leading to pricing, liquidity, and market behavior fragmentation. This variability can make it challenging for market participants to predict and navigate market conditions effectively. Some of the compliant carbon credit market players are Carbon Trust, ClimateCare, and 3Degrees.
Additional Benefits:
- The market estimate (ME) sheet in Excel format
- 3 months of analyst support
TABLE OF CONTENTS
1 INTRODUCTION
- 1.1 Study Deliverables
- 1.2 Study Assumptions
- 1.3 Scope of the Study
2 RESEARCH METHODOLOGY
3 EXECUTIVE SUMMARY
4 MARKET INSIGHTS
- 4.1 Current Market Scenario
- 4.2 Technological Trends
- 4.3 Industry Value Chain Analysis
- 4.4 Government Regulations and Initiatives
5 MARKET DYNAMICS
- 5.1 Drivers
- 5.1.1 Regulatory Mandates and Policies
- 5.1.2 Growing Corporate Sustainability Initiatives
- 5.2 Restraints
- 5.2.1 Market Complexity and Uncertainty
- 5.3 Opportunities
- 5.3.1 Innovation and Technology Advancements
- 5.4 Industry Attractiveness - Porter's Five Forces Analysis
- 5.4.1 Bargaining Power of Suppliers
- 5.4.2 Bargaining Power of Consumers / Buyers
- 5.4.3 Threat of New Entrants
- 5.4.4 Threat of Substitute Products
- 5.4.5 Intensity of Competitive Rivalry
6 MARKET SEGMENTATION
- 6.1 By Type of Credits
- 6.1.1 Renewable Energy Projects
- 6.1.2 Forestry and Land Use
- 6.1.3 Energy Efficiency
- 6.1.4 Industrial Process Improvements
- 6.2 By Sector
- 6.2.1 Energy Sector
- 6.2.2 Transportation
- 6.2.3 Industrial Sector
- 6.2.4 Agriculture and Forestry
- 6.3 By Geography
- 6.3.1 North America
- 6.3.1.1 United States
- 6.3.1.2 Canada
- 6.3.2 Europe
- 6.3.2.1 United Kingdom
- 6.3.2.2 Germany
- 6.3.2.3 France
- 6.3.2.4 Rest of Europe
- 6.3.3 Asia-Pacific
- 6.3.3.1 China
- 6.3.3.2 Japan
- 6.3.3.3 India
- 6.3.3.4 South Korea
- 6.3.3.5 Rest of Asia-Pacific
- 6.3.4 Middle East and Africa
- 6.3.5 Latin America
- 6.3.1 North America
7 COMPETITIVE LANDSCAPE
- 7.1 Overview (Market Concentration and Major Players)
- 7.2 Company Profiles
- 7.2.1 Carbon Trust
- 7.2.2 ClimateCare
- 7.2.3 3Degrees
- 7.2.4 South Pole
- 7.2.5 Gold Standard
- 7.2.6 Natural Capital Partners
- 7.2.7 Shell New Energies
- 7.2.8 Sustainable Travel International
- 7.2.9 Forest Carbon
- 7.2.10 Atmosfair*
- 7.3 Other Companies
8 MARKET OPPORTUNITIES AND FUTURE TRENDS
9 APPENDIX
 2032 年碳補償市場預測:按計劃類型、信用類型、認證標準、最終用戶和地區進行的全球分析
 合規碳權市場機會、成長動力、產業趨勢分析及 2025-2034 年預測
 碳補償/排碳權市場報告:趨勢、預測和競爭分析(至 2031 年)碳抵換/排碳權的全球市場的分析與預測(~2033年):類型,產品,服務,技術,用途,終端用戶,流程,展開,解決方案
 碳抵銷市場 - 2024 年至 2029 年預測自願性碳抵銷的全球市場規模:依產品、應用、地區、範圍和預測2030 年合規碳權市場預測:按類型、應用、最終用戶和地區進行的全球分析2030 年碳抵銷/排碳權市場預測:按類型、計劃類型、最終用戶和地區分類的全球分析碳抵銷市場:按類型、依最終用戶產業、按地區
 碳抵銷市場 - 2018-2028 年全球產業規模、佔有率、趨勢、機會和預測,按類型、專案類型、最終用戶、地區和競爭細分