


 |
市場調查報告書
商品編碼
1637896
美國風力發電-市場佔有率分析、產業趨勢與統計、成長預測(2025-2030)United States Wind Energy - Market Share Analysis, Industry Trends & Statistics, Growth Forecasts (2025 - 2030) |
||||||
價格
※ 本網頁內容可能與最新版本有所差異。詳細情況請與我們聯繫。
簡介目錄
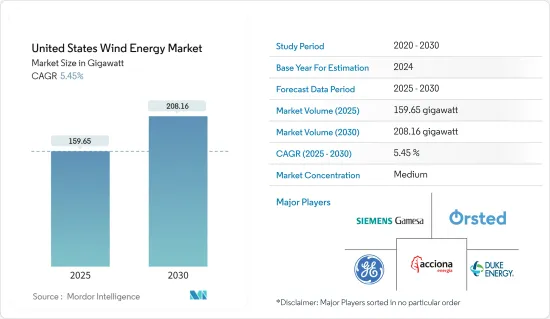
美國風力發電市場規模預計到2025年為159.65吉瓦,預計2030年將達到208.16吉瓦,預測期間(2025-2030年)複合年成長率為5.45%。
主要亮點
- 從中期來看,政府資金和聯邦激勵措施,包括通貨膨脹減少法案(IRA)、稅額扣抵和補貼、風力發電計劃投資以及風力發電機成本降低,將推動美國風力發電市場的成長。
- 另一方面,來自其他可再生能源技術的競爭預計將阻礙研究期間的市場成長。
- 近海地區風力發電產業的擴張預計將在未來幾年創造市場成長機會。
美國風力發電市場趨勢
主導市場的土地領域
- 陸域風力發電是指位於陸地上的風力發電機利用自然氣流所產生的電力。它是美國發展最快的可再生能源技術之一。風力發電機對於未來的無碳能源產業非常重要,因為它們不會排放空氣或水污染物。
- 在過去的五年中,陸上風力發電技術已經發展到可以最大限度地提高每兆瓦裝置功率輸出的程度。儘管2023年天然氣價格下降,但風力發電透過減少氮氧化物和二氧化碳排放,繼續對電網、人類健康和環境產生正面影響。
- 例如,2023年美國陸上風電裝置容量約為150.43GW,較2022年陸上風電裝置容量144.3GW成長4.2%。風力發電的增加是由於通貨膨脹控制法案的稅收優惠,這使得風力發電變得更便宜。此外,風電成本的降低和供應鏈投資的增加也支持了成長。
- 2024年7月,密蘇裡州500兆瓦的高草原風電場開始運作,擁有175台先進風力發電機。該計劃預計每年可為約 12 萬戶家庭發電。這是密蘇裡州 Ameren 45 億美元投資計畫的一部分,該計畫旨在 2030 年增加 3,100 兆瓦的清潔能源產能。 High Prairie 風電場預計將為密蘇裡州到 2050 年實現淨零碳排放的目標做出重大貢獻。
- 根據全球風能理事會的數據,預計2024年至2028年間,中國、美國和歐洲等國家將啟動近653吉瓦的陸上計劃。
- 因此,由於額外的投資、技術進步和經濟成長,陸上風力發電預計在未來幾年將擴大。
加大投資帶動市場
- 由於電力需求不斷增加,美國正在推動風力發電成長以滿足電力需求。在美國聯邦政府和州政府的支持下,許多跨國和本土公司正在投資風力發電產業。
- 2023年9月,拜登政府宣布投資100億美元,加強美國離岸風力發電供應鏈。這項投資預計將包括港口、航運和勞動力發展,可顯著提振投資者信心。該舉措旨在加速向可再生能源的轉變並增強經濟。
- 例如,2024年3月,美國第一個商業規模的離岸風力發電在劍島海岸開幕。該設施將由 16 台渦輪機組成,每台功率 8.2 兆瓦 (MW),總合可發電 130 兆瓦。這一里程碑標誌著美國離岸風力發電向前邁出了重要一步。
- 大西洋的三個主要離岸風力發電計劃正在建設中。麻薩諸塞州的 Vineyard Wind 1 發電量為 800 兆瓦,足以為 40 萬戶家庭供電。 Revolution Wind 位於羅德島州和麻薩諸塞州之間,發電量為 704 兆瓦,足以為 25 萬戶家庭供電。新澤西州海岸附近的 Ocean Wind 發電量為 110 萬千瓦,將為 50 萬戶家庭供電。這些計劃正在提高美國離岸風力發電容量。
- 2023年,美國風力發電量將達到429.5太瓦時,略低於2022年的438.7太瓦時。這意味著風力發電發電量比與前一年同期比較下降了2.1%。儘管出現下降,但 2018 年至 2023 年的總體趨勢反映出顯著成長,風力發電量在五年內成長了 56%。
- 因此,風力發電產業的此類發展預計將推動未來幾年的市場成長。
美國風力發電市場
美國風力發電市場較為分散。主要參與企業包括 Acciona Energia SA、杜克能源公司、奧斯特公司、通用電氣公司和西門子歌美颯可再生能源公司。
其他好處
- Excel 格式的市場預測 (ME) 表
- 3 個月分析師支持
目錄
第1章簡介
- 調查範圍
- 市場定義
- 研究場所
第 2 章執行摘要
第3章調查方法
第4章市場概況
- 介紹
- 至2029年裝置容量及預測(單位:GW)
- 美國可再生能源結構(2023)
- 最新趨勢和發展
- 政府法規和措施
- 市場動態
- 促進因素
- 支持性法規和稅收優惠鼓勵風力發電投資
- 加大風電計劃投資力度
- 抑制因素
- 替代可再生能源技術的競爭加劇
- 促進因素
- 供應鏈分析
- PESTLE分析
- 投資分析
第5章 市場區隔(按地區)
- 土地
- 海上
第6章 競爭狀況
- 併購、合資、聯盟、協議
- 主要企業策略
- 公司簡介
- 風力發電廠營運商
- Acciona Energia SA
- Orsted AS
- Duke Energy Corporation
- NextEra Energy Inc.
- Trident Winds Inc.
- E.ON SE
- EDF SA
- EnBW Energie Baden-Wurttemberg AG
- 設備供應商
- Envision Energy
- General Electric Company
- Siemens Gamesa Renewable Energy
- Vestas Wind Systems AS
- 風力發電廠營運商
- 其他知名公司名單
- 市場排名分析
第7章 市場機會及未來趨勢
- 拓展離岸業務
簡介目錄
Product Code: 48329
The United States Wind Energy Market size is estimated at 159.65 gigawatt in 2025, and is expected to reach 208.16 gigawatt by 2030, at a CAGR of 5.45% during the forecast period (2025-2030).
Key Highlights
- Over the medium term, factors such as government funding and federal incentives, including the Inflation Reduction Act (IRA), tax credits and subsidies, investments in wind energy projects, and decreasing cost of wind turbines are expected to drive the growth of the US wind energy market.
- On the other hand, competition from other renewable energy technologies is expected to hinder the market growth during the study period.
- The expansion of the wind energy industry in the offshore region is likely to create an opportunity for the market to grow in the coming years.
United States Wind Energy Market Trends
The Onshore Segment to Dominate the Market
- Onshore wind energy refers to electricity produced by wind turbines situated on land, harnessing the natural flow of air. It is one of the fastest-growing renewable energy technologies in the United States. Wind turbines do not release air or water pollutants, making them important for a future carbon-free energy industry.
- In the last five years, onshore wind energy technology has advanced to maximize electricity output per installed megawatt. Despite a drop in natural gas prices in 2023, wind energy continued to positively impact the grid, human health, and the environment by reducing emissions of nitrogen oxides and carbon dioxide.
- For instance, in 2023, onshore wind energy installations in the United States were around 150.43 GW, a 4.2% increase compared to the 144.3 GW of onshore wind energy installations in 2022. The increase in wind power is due to tax incentives from the Inflation Reduction Act, which makes wind energy more affordable. Additionally, decreasing wind energy costs and increasing investments in the supply chain boosted its growth.
- In July 2024, the 500 MW High Prairie Wind Farm in Missouri became operational, featuring 175 advanced wind turbines. This project is expected to generate enough electricity to power approximately 120,000 homes annually. It is part of Ameren Missouri's USD 4.5 billion investment plan to add 3,100 MW of clean energy capacity by 2030. The High Prairie Wind Farm is projected to significantly contribute to Missouri's goal of achieving net-zero carbon emissions by 2050.
- According to the Global Wind Energy Council, nearly 653 GW of onshore projects are likely to be commissioned between 2024 and 2028 in countries like China, the United States, and Europe.
- Therefore, onshore wind energy is expected to expand in the coming years with additional investments, technological advances, and economic growth.
Increasing Investments to Drive the Market
- Due to the increasing demand for electricity, the United States is promoting the growth of wind energy to meet power needs. Many multinational corporations and local firms are investing in the wind energy industry with the help of the governments of federal provinces in the United States.
- In September 2023, the Biden administration announced USD 10 billion to strengthen the US offshore wind energy supply chain. This investment is expected to involve developing ports, vessels, and workforce development, which may greatly increase investor confidence. This initiative aims to expedite the shift to renewable energy and fortify the economy.
- For instance, in March 2024, the first commercial-scale offshore wind power plant in the United States, situated off the coast of Thode Island, began delivering power. The facility comprises 16 turbines, each with a capacity of 8.2 megawatts (MW), which can produce 130 MW in total. The infrastructure for offshore wind energy in the United States has advanced significantly with this milestone.
- Three major offshore wind projects are under construction in the Atlantic. Vineyard Wind 1, of Massachusetts, will have an 800 MW capacity to power 400,000 homes. Revolution Wind, between Rhode Island and Massachusetts, will have a 704 MW capacity for 250,000 homes. Ocean Wind, off New Jersey, will have a 1.1 GW capacity to power 500,000 homes. These projects are boosting the US offshore wind energy capacity.
- In 2023, wind energy generation in the United States reached 429.5 TWh, a slight decrease compared to 438.7 TWh in 2022. This represents a 2.1% decline in electricity generation from wind energy sources year-over-year. Despite this reduction, the overall trend from 2018 to 2023 reflected significant growth, with wind energy generation increasing by 56% over the five-year period.
- Hence, such developments in the wind energy industry are expected to drive the growth of the market in the upcoming years.
United States Wind Energy Market New
The US wind energy market is fragmented. Some key players include Acciona Energia SA, Duke Energy Corporation, Oersted A/S, General Electric Company, and Siemens Gamesa Renewable Energy.
Additional Benefits:
- The market estimate (ME) sheet in Excel format
- 3 months of analyst support
TABLE OF CONTENTS
1 INTRODUCTION
- 1.1 Scope of the Study
- 1.2 Market Definition
- 1.3 Study Assumptions
2 EXECUTIVE SUMMARY
3 RESEARCH METHODOLOGY
4 MARKET OVERVIEW
- 4.1 Introduction
- 4.2 Installed Capacity and Forecast in GW, until 2029
- 4.3 United States Renewable Energy Mix, 2023
- 4.4 Recent Trends and Developments
- 4.5 Government Policies and Regulations
- 4.6 Market Dynamics
- 4.6.1 Drivers
- 4.6.1.1 Supportive Regulations and Tax Incentives Boost Wind Energy Investments
- 4.6.1.2 Increasing Investments in Wind Projects
- 4.6.2 Restraints
- 4.6.2.1 Increasing Competition from Alternate Renewable Energy Technologies
- 4.6.1 Drivers
- 4.7 Supply Chain Analysis
- 4.8 PESTLE Analysis
- 4.9 Investment Analysis
5 MARKET SEGMENTATION - BY LOCATION
- 5.1 Onshore
- 5.2 Offshore
6 COMPETITIVE LANDSCAPE
- 6.1 Mergers and Acquisitions, Joint Ventures, Collaborations, and Agreements
- 6.2 Strategies Adopted by Leading Players
- 6.3 Company Profiles
- 6.3.1 Wind Farm Operators
- 6.3.1.1 Acciona Energia SA
- 6.3.1.2 Orsted AS
- 6.3.1.3 Duke Energy Corporation
- 6.3.1.4 NextEra Energy Inc.
- 6.3.1.5 Trident Winds Inc.
- 6.3.1.6 E.ON SE
- 6.3.1.7 EDF SA
- 6.3.1.8 EnBW Energie Baden-Wurttemberg AG
- 6.3.2 Equipment Suppliers
- 6.3.2.1 Envision Energy
- 6.3.2.2 General Electric Company
- 6.3.2.3 Siemens Gamesa Renewable Energy
- 6.3.2.4 Vestas Wind Systems AS
- 6.3.1 Wind Farm Operators
- 6.4 List of Other Prominent Companies
- 6.5 Market Ranking Analysis
7 MARKET OPPORTUNITIES AND FUTURE TRENDS
- 7.1 Expansion in the Offshore Sector
02-2729-4219
+886-2-2729-4219
 2025-2033年風能市場報告(按組件、額定功率、安裝、渦輪機類型、應用和地區)
 中國風力發電:市場佔有率分析、產業趨勢與統計、成長預測(2025-2030)
 日本風力發電-市場佔有率分析、產業趨勢與統計、成長預測(2025-2030)
 義大利風力發電:市場佔有率分析、產業趨勢與統計、成長預測(2025-2030 年)
 2025年風力發電全球市場報告
 風能市場機會、成長動力、產業趨勢分析及2025-2034年預測
 陸域風力發電市場規模、佔有率、成長分析,按發電容量、按風力發電容量、按並聯型類型、按應用、按地區 - 行業預測,2025 年至 2032 年
 風力發電市場規模、佔有率和成長分析(按組件、渦輪機額定值、安裝類型、技術、性別、最終用戶和地區)—2025-2032 年產業預測
 印度風力發電-市場佔有率分析、產業趨勢與統計、成長預測(2025-2030 年)
 法國風力發電:市場佔有率分析、產業趨勢與統計、成長預測(2025-2030)
▼