


 |
市場調查報告書
商品編碼
2124410
美國智慧電視:市場佔有率分析、產業趨勢與統計及成長預測(2026-2031 年)US Smart TV - Market Share Analysis, Industry Trends & Statistics, Growth Forecasts (2026 - 2031) |
||||||

※ 本網頁內容可能與最新版本有所差異。詳細情況請與我們聯繫。
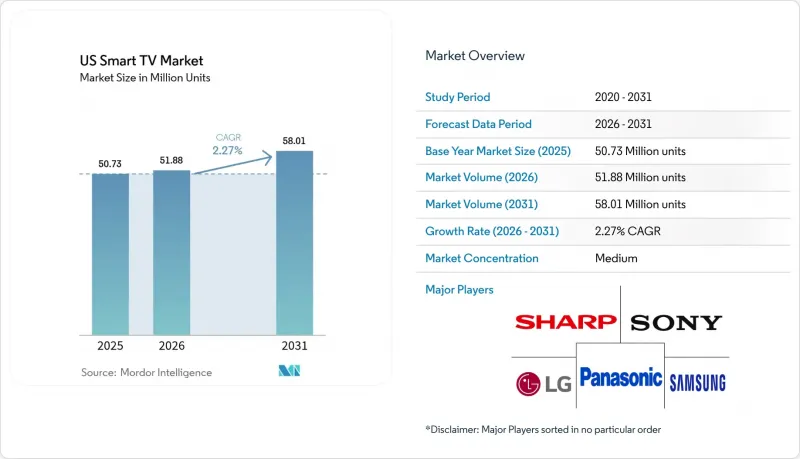
據 Mordor Intelligence 稱,2025 年美國智慧電視市場價值為 5,073 萬台,預計到 2031 年將達到 5,801 萬台,而 2026 年為 5,188 萬台,預測期(2026-2031 年)的複合年成長率為 2.27%。
本報告按螢幕尺寸(45英寸以下、45-54英寸、55-64英寸、65-74英寸、75英寸以上)、解析度類型(高清電視、全高清、4K超高清、8K超高清)、面板技術(LCD/LED、QLED、OLED、Mini-LED)、價格區間(500美元以下、50000 美元以下TV、其他)和地區進行細分。市場預測是基於出貨量(台)。
美國智慧電視市場的趨勢與洞察
快速 4K/8K 升級週期
儘管4K超高清電視的出貨量已超過一半,但製造商正透過推廣8K相容處理器和先進的背光技術來加速技術迭代。三星計畫於2025年發表的RGB mini-LED原型機預計在維持LCD成本的同時,實現OLED等級的對比。 LG的四層堆疊式OLED架構峰值亮度提升了40%,克服了曾經阻礙高階機型普及的HDR限制。這些技術進步正推動現有用戶提前更換,尤其是在串流媒體服務和次世代遊戲主機8K原生內容逐漸普及的情況下。
內建串流功能與應用生態系統
智慧電視作業系統如今已能複製外部電視棒的功能,將應用程式商店、支付和定向廣告整合到電視品牌之下。 Roku OS 仍佔據最大的市場佔有率,但隨著搜尋個人化功能提升用戶觀看時長,Google TV 的市場佔有率正在迅速成長。 LG 報告稱,其 webOS 廣告技術的收入將在 2024 年超過 1 兆韓元,這表明平台經濟正日益抵消硬體利潤率下降帶來的影響。
智慧型手機和平板電腦上的觀賞體驗被蠶食
隨著行動裝置螢幕擴大佔據人們的白天娛樂時間,以往足以促使更換到更大螢幕的「家庭觀看」機會正在減少。美國聯邦貿易委員會 (FTC) 2024 年的一項研究指出,串流平台過度最佳化了行動裝置的使用者介面設計,強化了人們獨自觀看的習慣。然而,遊戲和高品質的電影內容仍然是電視的優勢所在,可以緩解這種「蠶食效應」。
細分市場分析
預計到2025年,55-64吋電視將繼續保持領先地位,出貨量佔有率達34.02%,鞏固其作為主流「最佳尺寸」的地位。然而,75吋以上尺寸的電視預計將以2.69%的複合年成長率成長,超過美國智慧電視市場的整體成長率。早期用戶傾向於選擇目前售價低於2000美元的促銷面板,他們看重的是沉浸式遊戲體驗和戲院級串流媒體播放效果。三星憑藉其microLED供應鏈和積極的促銷策略,佔據了超大尺寸電視市場約三分之一的佔有率。 45吋以下的入門級電視市佔率持續下滑,受到價格低廉的個人平板電腦和邊框更窄、更易於安裝在小戶型公寓的中型電視的衝擊。
安裝人員表示,無線分線盒將安裝時間縮短了近 40%,加速了現有住宅中 75 吋壁掛式螢幕的普及。能源之星數據顯示,每平方英吋的功耗下降速度超過了面板面積的成長速度,緩解了注重節能的消費者對電費的擔憂。綜上所述,這些趨勢表明,大尺寸顯示器將繼續成為美國智慧電視市場的主要驅動力。
4K 超高清已成為必備之選,預計到 2025 年將佔據 54.02% 的市場佔有率。仍在發展中的 8K 市場預計將以 3.17% 的複合年成長率成長,這得益於人工智慧影像增強引擎彌補了片源不足的問題。微軟的 Xbox Series X 和索尼的 PlayStation 5 Pro 都將在 2025 年透過韌體更新支援 8K 輸出,串流媒體服務供應商也已開始在部分市場試行 8K 視訊點播服務。作為提升銷售策略,將 8K 面板與短期分期付款計劃相結合,可以緩解高價帶來的猶豫,並鼓勵早期用戶每 3-4 年更換。目前,全高清電視僅在住宿設施和以價格為先的零售商中作為旗艦產品存在。
OLED 製造商認為,由於亮度提升,8K 相對於高品質 4K HDR 的優勢正在減弱,但研究數據顯示,早期遊戲玩家選擇 8K 電視的比例異常高,僅僅是因為他們可以炫耀自己的跑分成績。隨著壓縮轉碼器的成熟,8K 串流媒體的頻寬開銷將會降低,從而消除大規模部署的最後一個技術障礙。
其他好處
- Excel格式的市場預測(ME)表
- 3個月的分析師支持
目錄
第1章:引言
- 研究假設和市場定義
- 調查範圍
第2章:調查方法
第3章執行摘要
第4章 市場狀況
- 市場概覽
- 市場促進因素
- 快速 4K/8K 升級週期
- 內建串流功能與應用生態系統
- 尺寸大於 65 吋的產品銷售量激增
- CTV廣告合作夥伴與OEM廠商之間的收益分成
- 針對遊戲最佳化的電視功能(VRR、雲端遊戲中心)
- 對符合「能源之星 9.0」標準的節能產品給予稅收優惠
- 市場限制因素
- 智慧型手機和平板電腦上的觀賞體驗被蠶食
- 來自低價中國品牌的價格壓力
- 由於作業系統層面的資料隱私保護機制有缺陷,導致遙測資料價值被抑制。
- 微型LED背光燈供應鏈的波動性
- 價值鏈分析
- 監理情勢
- 技術展望
- 波特五力模型
- 產業價值鏈圖譜
第5章 市場規模與成長預測
- 按螢幕尺寸
- 45英吋或更小
- 45-54英寸
- 55-64英寸
- 65-74英寸
- 75吋或更大
- 按解析度類型
- HDTV
- 全高清
- 4K UHD
- 8K UHD
- 面板技術
- LCD/LED
- QLED
- OLED
- Mini-LED
- 按價格範圍
- 不到500美元
- 500-999美元
- 1,000 美元至 1,999 美元
- 超過2000美元
- 透過作業系統
- Roku OS
- Google/Android TV
- Tizen OS
- webOS
- Fire TV OS
- VIDAA U
第6章 競爭情勢
- 市場集中度
- 策略趨勢
- 市佔率分析
- 供應商市場排名分析
- 公司簡介
- Samsung Electronics Co., Ltd.
- LG Electronics Inc.
- Sony Group Corporation
- TCL Electronics Holdings Ltd.
- VIZIO Holding Corp.
- Hisense Group Co., Ltd.
- Panasonic Holdings Corporation
- Sharp Corporation
- Koninklijke Philips NV
- Skyworth Group Ltd.
- Xiaomi Corp.
- Amazon.com Inc.(Fire TV Devices)
- Apple Inc.(Apple TV & tvOS Integrations)
- Haier Smart Home Co., Ltd.
- Funai Electric Co., Ltd.(Magnavox/Sanyo)
- Westinghouse Electric Corp.
- Sceptre Inc.
- Insignia Systems Inc.(Insignia TV)
- JVC Kenwood Corp.
- Pioneer Corp.
- Seiki Digital Inc.
- Element Electronics LLC
- Hitachi Ltd.
- LeEco(LeTV)
- Metz Consumer Electronics GmbH
- B&O A/S(Bang & Olufsen)
第7章 市場機會與未來展望
According to Mordor Intelligence, the US smart TV market size was valued at 50.73 million units in 2025 and estimated to grow from 51.88 million units in 2026 to reach 58.01 million units by 2031, at a CAGR of 2.27% during the forecast period (2026-2031).
This report is Segmented by Screen Size (Up To 45", 45-54", 55-64", 65-74", 75" & Above), Resolution Type (HDTV, Full HD, 4K UHD, 8K UHD), Panel Technology (LCD/LED, QLED, OLED, Mini-LED), Price Band (less Than USD 500, USD 500-999, and More), Operating System (Roku OS, Google/Android TV, and More), and Geography. The Market Forecasts are Provided in Terms of Volume (Units).
US Smart TV Market Trends and Insights
Rapid 4K/8K upgrade cycle
4K UHD already dominates more than half of shipments, yet manufacturers are shortening the technology cycle by mainstreaming 8K-ready processors and advanced backlighting. Samsung's RGB mini-LED prototypes shown in 2025 promise OLED-level contrast while holding LCD cost parity. LG's four-stack OLED architecture lifts peak brightness by 40%, solving HDR limitations that once slowed premium adoption. These step-changes jointly nudge existing owners toward earlier replacement, especially as streaming and next-gen consoles gradually expose 8K native content.
Built-in streaming and app ecosystems
Smart-TV operating systems now replicate the functionality of external sticks, bringing storefronts, payments, and targeted ads under the television brand. Roku OS still accounts for the largest footprint, but Google TV is the fastest riser as search personalization drives watch-time. LG reports that its webOS ad-tech revenue surpassed KRW 1 trillion in 2024, proof that platform economics increasingly offset hardware margin compression.
Smartphone/tablet viewing cannibalization
Mobile screens increasingly capture daytime entertainment minutes, limiting shared viewing occasions that traditionally justified large-screen upgrades. The Federal Trade Commission's 2024 study highlights how streaming platforms over-index their UI design for handheld devices, reinforcing single-user consumption habits. Yet gaming and premium cinematic content remain television strongholds, tempering the cannibalization effect.
Other drivers and restraints analyzed in the detailed report include:
- Surge in larger-than-65" purchases
- CTV advertising revenue sharing creates new business models
- Price compression from low-cost Chinese brands
For complete list of drivers and restraints, kindly check the Table Of Contents.
Segment Analysis
The 55-64 inch band retained a leading 34.02% shipment share in 2025, confirming its role as the mainstream sweet spot. However, the 75-inch-plus segment is set to grow fastest at 2.69% CAGR, outpacing overall US Smart TV market growth. Early adopters cite immersive gaming and theater-grade streaming as justification for purchasing panels that now cost under USD 2,000 at promotion. Samsung commands roughly one-third of ultra-large formats by leveraging its micro-LED supply chain and aggressive channel promotions. Entry-level sub-45-inch models continue sliding, squeezed by cheap tablets for personal viewing and by mid-sized sets that increasingly fit smaller apartments thanks to bezel minimization.
Installers report that wireless breakout boxes reduce setup time by almost 40%, accelerating acceptance of wall-mounted 75-inch screens in existing homes. ENERGY STAR data suggest power consumption per square inch is falling faster than panel area is rising, muting electricity-cost objections among energy-conscious buyers. Collectively, these trends mean that large-format displays will remain the headline growth driver inside the US Smart TV market.
4K UHD reached 54.02% shipment share in 2025, having already become table stakes. The nascent 8K segment is projected to post a 3.17% CAGR, aided by AI-upscaling engines that mask source-content scarcity. Microsoft's Xbox Series X and Sony's PlayStation 5 Pro both enabled 8K output in 2025 firmware updates, and streaming providers have begun test runs of 8K VOD in limited markets. Upsell tactics pair 8K panels with shorter finance plans to offset sticker shock, ensuring early adopters rotate into the pool every 3-4 years. Full-HD models now survive mainly in hospitality and price-first retail doorbusters.
OLED providers argue that brightness gains close the perceived advantage of 8K over high-quality 4K HDR, but survey data show that early gamers disproportionately choose 8K sets for their benchmarking bragging rights. As compression codecs mature, bandwidth overhead for 8K streams will fall, removing one of the last technical hurdles to mass deployment.
Complete Report Scope:
- By Screen Size
- Up to 45"
- 45-54"
- 55-64"
- 65-74"
- 75" and Above
- By Resolution Type
- HDTV
- Full HD
- 4K UHD
- 8K UHD
- By Panel Technology
- LCD/LED
- QLED
- OLED
- Mini-LED
- By Price Band
- less than USD 500
- USD 500-999
- USD 1,000-1,999
- More than USD 2,000
- By Operating System
- Roku OS
- Google/Android TV
- Tizen OS
- webOS
- Fire TV OS
- VIDAA U
List of Companies Covered in this Report:
- Samsung Electronics Co., Ltd.
- LG Electronics Inc.
- Sony Group Corporation
- TCL Electronics Holdings Ltd.
- VIZIO Holding Corp.
- Hisense Group Co., Ltd.
- Panasonic Holdings Corporation
- Sharp Corporation
- Koninklijke Philips N.V.
- Skyworth Group Ltd.
- Xiaomi Corp.
- Amazon.com Inc. (Fire TV Devices)
- Apple Inc. (Apple TV & tvOS Integrations)
- Haier Smart Home Co., Ltd.
- Funai Electric Co., Ltd. (Magnavox/Sanyo)
- Westinghouse Electric Corp.
- Sceptre Inc.
- Insignia Systems Inc. (Insignia TV)
- JVC Kenwood Corp.
- Pioneer Corp.
- Seiki Digital Inc.
- Element Electronics LLC
- Hitachi Ltd.
- LeEco (LeTV)
- Metz Consumer Electronics GmbH
- B&O A/S (Bang & Olufsen)
Additional Benefits:
- The market estimate (ME) sheet in Excel format
- 3 months of analyst support
TABLE OF CONTENTS
1 INTRODUCTION
- 1.1 Study Assumptions and Market Definition
- 1.2 Scope of the Study
2 RESEARCH METHODOLOGY
3 EXECUTIVE SUMMARY
4 MARKET LANDSCAPE
- 4.1 Market Overview
- 4.2 Market Drivers
- 4.2.1 Rapid 4K/8K upgrade cycle
- 4.2.2 Built-in streaming and app ecosystems
- 4.2.3 Surge in larger-than-65" purchases
- 4.2.4 CTV advertising-revenue sharing with OEMs
- 4.2.5 Gaming-optimized TV features (VRR, cloud gaming hubs)
- 4.2.6 Energy-efficiency tax incentives for "ENERGY STAR 9.0" sets
- 4.3 Market Restraints
- 4.3.1 Smartphone/tablet viewing cannibalization
- 4.3.2 Price compression from low-cost Chinese brands
- 4.3.3 OS-level data-privacy pushback curbing telemetry value
- 4.3.4 Supply-chain volatility in mini-LED backlights
- 4.4 Value Chain Analysis
- 4.5 Regulatory Landscape
- 4.6 Technological Outlook
- 4.7 Porter's Five Forces
- 4.7.1 Bargaining Power of Suppliers
- 4.7.2 Bargaining Power of Buyers
- 4.7.3 Threat of New Entrants
- 4.7.4 Threat of Substitutes
- 4.7.5 Competitive Rivalry
- 4.8 Industry Value-Chain Mapping
5 MARKET SIZE AND GROWTH FORECASTS (VOLUME)
- 5.1 By Screen Size
- 5.1.1 Up to 45"
- 5.1.2 45-54"
- 5.1.3 55-64"
- 5.1.4 65-74"
- 5.1.5 75" and Above
- 5.2 By Resolution Type
- 5.2.1 HDTV
- 5.2.2 Full HD
- 5.2.3 4K UHD
- 5.2.4 8K UHD
- 5.3 By Panel Technology
- 5.3.1 LCD/LED
- 5.3.2 QLED
- 5.3.3 OLED
- 5.3.4 Mini-LED
- 5.4 By Price Band
- 5.4.1 less than USD 500
- 5.4.2 USD 500-999
- 5.4.3 USD 1,000-1,999
- 5.4.4 More than USD 2,000
- 5.5 By Operating System
- 5.5.1 Roku OS
- 5.5.2 Google/Android TV
- 5.5.3 Tizen OS
- 5.5.4 webOS
- 5.5.5 Fire TV OS
- 5.5.6 VIDAA U
6 COMPETITIVE LANDSCAPE
- 6.1 Market Concentration
- 6.2 Strategic Moves
- 6.3 Market Share Analysis
- 6.4 Vendor Market Ranking Analysis
- 6.5 Company Profiles (includes Global level Overview, Market level overview, Core Segments, Financials as available, Strategic Information, Market Rank/Share, Products and Services, Recent Developments)
- 6.5.1 Samsung Electronics Co., Ltd.
- 6.5.2 LG Electronics Inc.
- 6.5.3 Sony Group Corporation
- 6.5.4 TCL Electronics Holdings Ltd.
- 6.5.5 VIZIO Holding Corp.
- 6.5.6 Hisense Group Co., Ltd.
- 6.5.7 Panasonic Holdings Corporation
- 6.5.8 Sharp Corporation
- 6.5.9 Koninklijke Philips N.V.
- 6.5.10 Skyworth Group Ltd.
- 6.5.11 Xiaomi Corp.
- 6.5.12 Amazon.com Inc. (Fire TV Devices)
- 6.5.13 Apple Inc. (Apple TV & tvOS Integrations)
- 6.5.14 Haier Smart Home Co., Ltd.
- 6.5.15 Funai Electric Co., Ltd. (Magnavox/Sanyo)
- 6.5.16 Westinghouse Electric Corp.
- 6.5.17 Sceptre Inc.
- 6.5.18 Insignia Systems Inc. (Insignia TV)
- 6.5.19 JVC Kenwood Corp.
- 6.5.20 Pioneer Corp.
- 6.5.21 Seiki Digital Inc.
- 6.5.22 Element Electronics LLC
- 6.5.23 Hitachi Ltd.
- 6.5.24 LeEco (LeTV)
- 6.5.25 Metz Consumer Electronics GmbH
- 6.5.26 B&O A/S (Bang & Olufsen)
7 MARKET OPPORTUNITIES AND FUTURE OUTLOOK
- 7.1 White-Space and Unmet-Need Assessment

 印度智慧電視和OTT市場:市場佔有率分析、行業趨勢和統計數據以及成長預測(2026-2031)智慧電視:市場佔有率分析、產業趨勢與統計及成長預測(2026-2031)智慧電視OTT串流:市場佔有率分析、產業趨勢與統計、成長預測(2026-2031年)
 智慧電視市場:2026-2032年全球市場預測(依顯示技術、螢幕大小、解析度、銷售管道和應用分類)
 智慧電視市場:按螢幕大小、顯示技術、作業系統和地區分類網路電視市場:2026年至2032年全球預測(依顯示技術、解析度、螢幕大小、作業系統和應用程式分類)
 2026年全球體育賽事線上影片市場報告智慧電視晶片市場:按類型、解析度、最終用戶和地區分類
 智慧電視市場分析及預測(至2035年):依類型、產品類型、技術、組件、應用、功能、安裝類型、最終用戶及模式分類
 全球智慧電視市場規模、佔有率、趨勢和成長分析報告(2026-2034)