


 |
市場調查報告書
商品編碼
1684061
建築修復和維修化學品-市場佔有率分析、行業趨勢和統計、成長預測(2025-2030 年)Construction Repair and Rehabilitation Chemicals - Market Share Analysis, Industry Trends & Statistics, Growth Forecasts (2025 - 2030) |
||||||
※ 本網頁內容可能與最新版本有所差異。詳細情況請與我們聯繫。
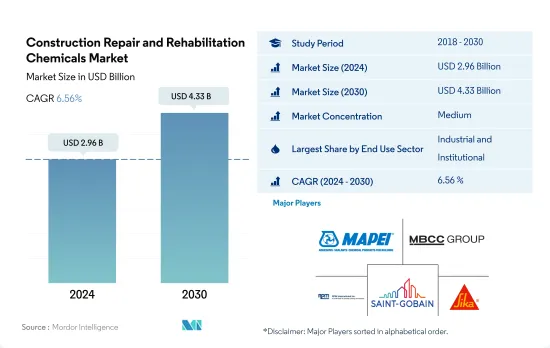
建築修復和維修化學品市場規模估計和預測到 2024 年將達到 29.6 億美元,預計到 2030 年將達到 43.3 億美元,在市場估計和預測期(2024-2030 年)內以 6.56% 的複合年成長率成長。
工業建築的興起可能會推動對建築修復和維修化學品的需求
- 2022 年,全球建築修復和維修化學品市場價值成長了 4.72%,這得益於商業、工業和機構建築行業需求的不斷成長。預計這種成長將在 2023 年持續,預計成長率將比 2022 年提高 4.64%。
- 2022 年,工業和設施產業成為主要消費者,佔建築修復和維修化學品市場的 48.20% 左右。預計2023年該產業的占地面積將增加90.2億平方英尺,主要原因是工業、教育和醫療保健建設投資增加。因此,預計 2023 年該行業對建築修復和維修化學品的需求將成長約 5.25%。
- 展望未來,工業和設施產業預計將保持成長軌跡,2023 年至 2030 年以金額為準的複合年成長率為 7%。預計該產業的全球現有占地面積將在 2023 年達到 3,600 億平方英尺,到 2030 年將進一步達到 4,290 億平方英尺。此外,印度、印尼和越南等經濟體正在快速擴張,這將顯著影響這些國家對工業房地產的需求,以滿足其對高效能工廠的需求。因此,該領域的修復和翻新化學品市場規模預計將從 2023 年的 13.3 億美元飆升至 2030 年的 21.5 億美元。
- 因此,預計預測期內它將經歷顯著成長。
亞太國家GDP成長對建築修復和維修化學品市場未來的影響
- 受建築和基礎設施維修熱潮的推動,2022 年全球建築修復和維修化學品市場以金額為準增加了 5%。這些舉措旨在促進經濟成長並加強能源效率標準。預計到 2023 年,全球建築修復和維修化學品市場以金額為準將進一步成長 4.6%,其中北美和亞太地區將引領這一成長。
- 以中國、日本和印度等國家為首的亞太地區在全球建築修復和維修化學品消費中佔據主導地位。光是這三個國家就將在2022年佔據28%的市場。值得注意的是,微混凝土砂漿對亞太市場貢獻巨大,其次是可注射水泥漿材料。
- 歐洲在建築修復和維修化學品的消費量方面排名第二,其中德國、法國和英國是主要貢獻者。到2022年,這三個國家將佔歐洲市值的近47%。工業、設施和基礎設施部門是歐洲化學品的主要消費者。
- 預計亞太地區建築修復和維修化學品市場將實現最高成長,2023 年至 2030 年期間的以金額為準為 7.12%。這一成長可能受到該地區強勁經濟的推動,包括印度、中國、泰國和日本。尤其是中國和印度的GDP年增率分別為5.2%和5.9%。
建築修復和維修化學品市場的全球趨勢
商業建築投資和辦公空間的增加可能會促進商業部門的發展
- 2022 年,受辦公大樓、飯店和零售商場等房地產需求激增的推動,全球商業建築占地面積增加 2%。尤其值得注意的是印度的零售業,其排名前七的城市的購物中心面積超過 260 萬平方英尺,較 2021 年成長 27%。接下來的一年,即 2023 年,全球商業部門的占地面積預計將激增約 68 億平方英尺,這主要得益於外國直接投資 (FDI) 的激增,從而在全球範圍內產生對新辦公室、倉庫和零售空間的需求。
- 2018年至2021年間,全球商業建築占地面積擴大了6.33%。 2021年,全球近390個大城市的辦公大樓運轉率強勁成長,成長超過80%。此外,從 2021 年第三季開始,辦公空間淨吸收量達到 3,000 萬平方英尺。因此,2021 年全球商業建築占地面積與前一年同期比較增加約 65 億平方英尺。
- 根據預測,預測期內全球商業建築占地面積(以體積計算)的複合年成長率將達到 2.21%。這一成長是由商業建築支出和辦公空間需求的不斷成長所推動的。例如,預計到 2027 年,美國的商業建築支出將達到 6,460 億美元。在印度,預計到 2026 年,前七大城的甲級辦公室市場將擴大至約 10 億平方英尺,到 2030 年將進一步擴大至 12 億平方英尺。
住宅需求的增加和維修投資的增加可能會推動住宅產業的建設
- 2022年,受人口成長、富裕程度提高及都市化快速發展等因素推動,全球住宅現有占地面積將增加1.35%。尤其是住宅建築領域,2023 年占地面積將急劇增加至約 282 億平方英尺,主要是由於住宅單元數量的增加。尤其是美國,預計到2023年將建造2.4119億住宅。
- 2018年至2021年間,全球住宅領域的占地面積以體積計算擴大了約4.05%。 2020年,住宅領域佔全球建設產業的44%,鞏固了其作為最大子部門的地位,並成為全球成長的關鍵驅動力。 2021年全球住宅占地面積將增加約276億平方英尺,光是美國就將完工133萬套住宅,與前一年同期比較增加4%。
- 展望未來,全球住宅占地面積預計將以 1.50% 的複合年成長率成長。這一成長將受到持續的住宅需求、不斷增加的投資和政府的支持性政策的推動。對經濟適用住宅的關注可能會振興全球住宅建築業並有助於經濟復甦。例如,據估計,到 2030 年,印度將需要額外 2,500 萬套經濟適用住宅來滿足其不斷成長的城市人口的需求。此外,歐洲計劃在2030年投資約25億歐元用於住宅維修。
建築修復和維修化學品行業概況
建築修復和維修化學品市場適度整合,前五大公司佔據51.58%的市場佔有率。該市場的主要企業有:MAPEI SpA、MBCC Group、RPM International Inc.、Saint-Gobain 和 Sika AG(按字母順序排列)。
其他福利
- Excel 格式的市場預測 (ME) 表
- 3個月的分析師支持
目錄
第1章執行摘要和主要發現
第2章 報告要約
第3章 引言
- 研究假設和市場定義
- 研究範圍
- 調查方法
第4章 產業主要趨勢
- 最終用途趨勢
- 商業
- 工業/設施
- 住宅
- 法律規範
- 價值鍊和通路分析
第5章市場區隔
- 最終用途類別
- 商業
- 工業/設施
- 基礎設施
- 住宅
- 子產品
- 光纖纏繞系統
- 水泥漿料
- 微混凝土砂漿
- 改質砂漿
- 鋼筋保護材料
- 地區
- 亞太地區
- 按國家
- 澳洲
- 中國
- 印度
- 印尼
- 日本
- 馬來西亞
- 韓國
- 泰國
- 越南
- 其他亞太地區
- 歐洲
- 按國家
- 法國
- 德國
- 義大利
- 俄羅斯
- 西班牙
- 英國
- 其他歐洲國家
- 中東和非洲
- 按國家
- 沙烏地阿拉伯
- 阿拉伯聯合大公國
- 其他中東和非洲地區
- 北美洲
- 按國家
- 加拿大
- 墨西哥
- 美國
- 南美洲
- 按國家
- 阿根廷
- 巴西
- 南美洲其他地區
- 亞太地區
第6章 競爭格局
- 關鍵策略趨勢
- 市場佔有率分析
- 商業狀況
- 公司簡介
- Ardex Group
- Fosroc, Inc.
- MAPEI SpA
- MBCC Group
- MC-Bauchemie
- Remmers Gruppe AG
- RPM International Inc.
- Saint-Gobain
- Sika AG
- Simpson Strong-Tie Company, Inc.
第 7 章 CEO 的關鍵策略問題CEO 的關鍵策略問題
第 8 章 附錄
- 世界概況
- 概述
- 五力分析框架(產業吸引力分析)
- 全球價值鏈分析
- 市場動態(DRO)
- 資訊來源及延伸閱讀
- 圖片列表
- 關鍵見解
- 資料包
- 詞彙表
The Construction Repair and Rehabilitation Chemicals Market size is estimated at 2.96 billion USD in 2024, and is expected to reach 4.33 billion USD by 2030, growing at a CAGR of 6.56% during the forecast period (2024-2030).
Rising industrial construction is likely to drive the demand for repair and rehabilitation chemicals
- The global market for repair and rehabilitation chemicals experienced a 4.72% growth in value in 2022, driven by rising demand from the commercial and industrial and institutional construction sectors. This growth was estimated to continue in 2023, with a projected rate of 4.64% compared to 2022.
- In 2022, the industrial and institutional sector emerged as the dominant consumer, accounting for approximately 48.20% of the repair and rehabilitation chemicals market. This sector's floor area was set to expand by 9.02 billion square feet in 2023, primarily fueled by increased investments in industrial, education, and healthcare construction. Consequently, the demand for repair and rehabilitation chemicals in this sector is expected to rise by about 5.25% in 2023.
- Looking ahead, the industrial and institutional sector is poised to maintain its growth trajectory, with a projected CAGR of 7% in value from 2023 to 2030. The global existing floor area for this sector is forecasted to reach 360 billion square feet in 2023 and further climb to 429 billion square feet by 2030, driven by heightened industrial construction investments worldwide. Furthermore, several economies such as India, Indonesia, and Vietnam have shown rapid expansion that considerably impacted the need for an industrial property to meet the demands of efficient factories in the countries. As a result, the market for repair and rehabilitation chemicals in this sector is anticipated to surge from USD 1.33 billion in 2023 to USD 2.15 billion in 2030.
- Therefore, the market studied is expected to witness substantial growth during the forecast period.
The future of the construction repair and rehabilitation chemicals market is set to be influenced by the GDP growth of Asia-Pacific countries
- The global construction repair and rehabilitation chemicals market witnessed a 5% increase in terms of value in 2022, driven by a surge in building and infrastructure renovations. These initiatives aimed to boost economic growth and enhance energy efficiency standards. The global construction repair and rehabilitation chemicals market is projected to record a further 4.6% growth in 2023 by value, with North America and Asia-Pacific leading the way.
- Asia-Pacific, led by countries such as China, Japan, and India, dominates the global consumption of repair and rehabilitation chemicals. These three nations alone accounted for 28% of the market's value in 2022. Notably, micro-concrete mortars emerged as a significant contributor to the Asia-Pacific market, following injection grouting materials.
- Europe ranks second in terms of repair and rehabilitation chemical consumption, with Germany, France, and the United Kingdom being the primary contributors. In 2022, these three countries represented nearly 47% of Europe's market value. The industrial, institutional, and infrastructure segments are the major consumers of these chemicals in Europe.
- Asia-Pacific is projected to witness the highest growth in the construction repair and rehabilitation chemicals market, with a CAGR of 7.12% in terms of value from 2023 to 2030. This growth is likely to be fueled by the region's robust economies, including India, China, Thailand, and Japan. Notably, China and India's GDPs are growing at annual rates of 5.2% and 5.9%, respectively.
Global Construction Repair and Rehabilitation Chemicals Market Trends
Rising commercial construction investment and office spaces are likely to boost the commercial sector
- In 2022, the global commercial sector witnessed a 2% increase in its floor area, driven by a surge in demand for properties like offices, hotels, and retail malls. Notably, the Indian retail industry saw a significant uptick, with its top seven cities adding over 2.6 million sq. ft of mall space, marking a 27% jump from 2021. The following year, in 2023, the global commercial sector's floor area surged by approximately 6.8 billion sq. ft, largely propelled by a surge in foreign direct investment (FDI), necessitating new offices, warehouses, and retail outlets worldwide.
- Between 2018 and 2021, the global commercial sector's floor area expanded by 6.33% in volume. In 2021, office occupancy witnessed a robust growth of over 80% across nearly 390 metro cities globally. Additionally, from Q3 2021, there was a net absorption of 30 million sq. ft. of office space. Consequently, the global commercial sector's floor area swelled by approximately 6.5 billion sq. ft. in 2021 compared to the previous year.
- Projections indicate that the global commercial sector's floor area will register a CAGR of 2.21% in volume during the forecast period. This growth is fueled by heightened demand for commercial construction spending and office spaces. For instance, commercial construction spending in the United States is set to hit USD 646 billion by 2027. In India, the Grade A office market in the top seven cities is expected to expand to nearly 1 billion sq. ft by 2026 and further to 1.2 billion sq. ft by 2030.
Increasing demand for housing units and investments in renovation are likely to boost residential sector constructions
- In 2022, the global residential sector witnessed a 1.35% increase in its existing floor area, driven by factors like population growth, rising wealth, and rapid urbanization. The residential construction sector, specifically, saw a surge of around 28.2 billion sq. ft in its floor area in 2023, primarily due to a rise in the number of homes. Notably, the United States was projected to have 241.19 million homes by 2023.
- Between 2018 and 2021, the global residential sector's floor area expanded by approximately 4.05% in terms of volume. In 2020, the residential sector accounted for 44% of the global construction industry, solidifying its position as the largest subsector and a key driver of global growth. The global residential floor area grew by about 27.6 billion sq. ft in 2021, with the United States alone completing 1.33 million housing units, marking a 4% increase from the previous year.
- Looking ahead, the global residential sector's floor area is projected to witness a CAGR of 1.50% in terms of volume. This growth will be fueled by sustained housing demand, increased investments, and supportive government policies. The emphasis on affordable housing is set to rejuvenate the global residential construction sector, aiding its recovery. For instance, it is estimated that India will require an additional 25 million affordable housing units by 2030 to meet the needs of its expanding urban population. Additionally, Europe has plans to invest approximately EUR 2.5 billion in residential dwelling renovations by 2030.
Construction Repair and Rehabilitation Chemicals Industry Overview
The Construction Repair and Rehabilitation Chemicals Market is moderately consolidated, with the top five companies occupying 51.58%. The major players in this market are MAPEI S.p.A., MBCC Group, RPM International Inc., Saint-Gobain and Sika AG (sorted alphabetically).
Additional Benefits:
- The market estimate (ME) sheet in Excel format
- 3 months of analyst support
TABLE OF CONTENTS
1 EXECUTIVE SUMMARY & KEY FINDINGS
2 REPORT OFFERS
3 INTRODUCTION
- 3.1 Study Assumptions & Market Definition
- 3.2 Scope of the Study
- 3.3 Research Methodology
4 KEY INDUSTRY TRENDS
- 4.1 End Use Sector Trends
- 4.1.1 Commercial
- 4.1.2 Industrial and Institutional
- 4.1.3 Residential
- 4.2 Regulatory Framework
- 4.3 Value Chain & Distribution Channel Analysis
5 MARKET SEGMENTATION (includes market size, forecasts up to 2030 and analysis of growth prospects.)
- 5.1 End Use Sector
- 5.1.1 Commercial
- 5.1.2 Industrial and Institutional
- 5.1.3 Infrastructure
- 5.1.4 Residential
- 5.2 Sub Product
- 5.2.1 Fiber Wrapping Systems
- 5.2.2 Injection Grouting Materials
- 5.2.3 Micro-concrete Mortars
- 5.2.4 Modified Mortars
- 5.2.5 Rebar Protectors
- 5.3 Region
- 5.3.1 Asia-Pacific
- 5.3.1.1 By Country
- 5.3.1.1.1 Australia
- 5.3.1.1.2 China
- 5.3.1.1.3 India
- 5.3.1.1.4 Indonesia
- 5.3.1.1.5 Japan
- 5.3.1.1.6 Malaysia
- 5.3.1.1.7 South Korea
- 5.3.1.1.8 Thailand
- 5.3.1.1.9 Vietnam
- 5.3.1.1.10 Rest of Asia-Pacific
- 5.3.2 Europe
- 5.3.2.1 By Country
- 5.3.2.1.1 France
- 5.3.2.1.2 Germany
- 5.3.2.1.3 Italy
- 5.3.2.1.4 Russia
- 5.3.2.1.5 Spain
- 5.3.2.1.6 United Kingdom
- 5.3.2.1.7 Rest of Europe
- 5.3.3 Middle East and Africa
- 5.3.3.1 By Country
- 5.3.3.1.1 Saudi Arabia
- 5.3.3.1.2 United Arab Emirates
- 5.3.3.1.3 Rest of Middle East and Africa
- 5.3.4 North America
- 5.3.4.1 By Country
- 5.3.4.1.1 Canada
- 5.3.4.1.2 Mexico
- 5.3.4.1.3 United States
- 5.3.5 South America
- 5.3.5.1 By Country
- 5.3.5.1.1 Argentina
- 5.3.5.1.2 Brazil
- 5.3.5.1.3 Rest of South America
- 5.3.1 Asia-Pacific
6 COMPETITIVE LANDSCAPE
- 6.1 Key Strategic Moves
- 6.2 Market Share Analysis
- 6.3 Company Landscape
- 6.4 Company Profiles
- 6.4.1 Ardex Group
- 6.4.2 Fosroc, Inc.
- 6.4.3 MAPEI S.p.A.
- 6.4.4 MBCC Group
- 6.4.5 MC-Bauchemie
- 6.4.6 Remmers Gruppe AG
- 6.4.7 RPM International Inc.
- 6.4.8 Saint-Gobain
- 6.4.9 Sika AG
- 6.4.10 Simpson Strong-Tie Company, Inc.
7 KEY STRATEGIC QUESTIONS FOR CONCRETE, MORTARS AND CONSTRUCTION CHEMICALS CEOS
8 APPENDIX
- 8.1 Global Overview
- 8.1.1 Overview
- 8.1.2 Porter's Five Forces Framework (Industry Attractiveness Analysis)
- 8.1.3 Global Value Chain Analysis
- 8.1.4 Market Dynamics (DROs)
- 8.2 Sources & References
- 8.3 List of Tables & Figures
- 8.4 Primary Insights
- 8.5 Data Pack
- 8.6 Glossary of Terms
 建築化學品市場規模、佔有率及成長分析(混凝土外加劑、防水劑、防護被覆劑、黏合劑及密封劑、修補劑及修復劑及地區)- 2025-2032 年產業預測
 中東和非洲的建築化學品:市場佔有率分析、行業趨勢和成長預測(2025-2030 年)亞太建築化學品:市場佔有率分析、產業趨勢與統計、成長預測(2025-2030 年)北美建築化學品:市場佔有率分析、行業趨勢和統計數據、成長預測(2025-2030 年)南美洲建築化學品-市場佔有率分析、產業趨勢與統計、成長預測(2025-2030 年)印度建築化學品-市場佔有率分析、產業趨勢與統計、2025-2030 年成長預測建築化學品:市場佔有率分析、產業趨勢與統計、成長預測(2025-2030 年)歐洲建築化學品市場 -市場佔有率分析、產業趨勢與統計、成長預測(2025-2030 年)泰國建築化學品-市場佔有率分析、產業趨勢與成長預測(2025-2030年)美國建築化學品-市場佔有率分析、產業趨勢與統計、成長預測(2025-2030)