


 |
市場調查報告書
商品編碼
1687903
印度建築化學品-市場佔有率分析、產業趨勢與統計、2025-2030 年成長預測India Construction Chemicals - Market Share Analysis, Industry Trends & Statistics, Growth Forecasts (2025 - 2030) |
||||||
價格
※ 本網頁內容可能與最新版本有所差異。詳細情況請與我們聯繫。
簡介目錄
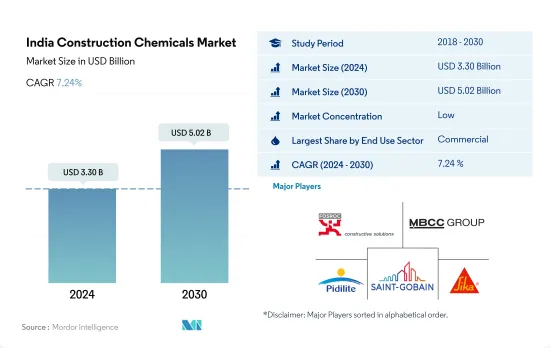
印度建築化學品市場規模預計在 2024 年為 33 億美元,預計到 2030 年將達到 50.2 億美元,預測期內(2024-2030 年)的複合年成長率為 7.24%。
商業和住宅領域推動印度建築化學品市場的成長
- 印度的建築化學品市場是全球盈利第三大、成長率最高的市場。 2022 年,由於建設活動和多個行業支出的增加,市場規模飆升 6.97%。預計到 2023 年,得益於房地產和基礎設施的強勁發展,市場將保持上升趨勢,成長 6.9%。
- 作為資金來源的商業部門(無論是政府機構還是私人組織)主導著建築化學品的需求。與住宅和其他類型的建築相比,這種資金支持使得商業計劃更容易獲得建築化學品的投資。此外,商業建築以其高密度和複雜設計而聞名,需要更多種類的建築化學品。
- 住宅產業緊隨其後,成為建築化學品第二大利潤豐厚的產業。印度作為世界上人口最多的國家,建造了大量住宅,增加了需求和市場規模。此外,對防水解決方案的持續需求進一步增加了這一領域的重要性。
- 預計住宅和商業部門的成長速度與其他部門相同且更快,在市場估計和預測期內(2023-2030 年),複合年成長率分別為 7.9% 和 7.4%。這一成長率被認為是由政府推動住宅建設等舉措以及吸引國內外投資的友好商業環境所推動的。
印度建築化學品市場趨勢
預計到 2030 年,印度甲級辦公室市場規模將達到 12 億平方英尺,進而推動商業建築領域的需求。
- 2022 年,印度新的商業占地面積比 2021 年增加了 6.2%。零售業需求強勁,尤其是在前七大城市(德里國家首都轄區、班加羅爾、海得拉巴、孟買、普納、清奈和加爾各答),購物中心面積超過 260 萬平方英尺,比 2021 年成長 27%。展望 2023 年,由於外國直接投資 (FDI) 的激增刺激了對新辦公、零售和其他設施的需求,該行業的新占地面積預計將激增 3,800 萬平方英尺。尤其是,預計2023年流入建築業的外國直接投資將達到9,600萬美元。
- 2020 年,印度新建商業占地面積較 2019 年下降了 68.3%。下降的主要原因是政府在全國範圍內實施封鎖,導致正在進行的計劃暫停,供應鏈緊張,勞動力供應受到影響。然而,隨著 2021 年限制措施的放寬,出現了強勁復甦,新建占地面積激增約 5.26 億平方英尺。此外,2021 年綠建築舉措顯著增加,約 55% 的商業計劃採用了永續性,進一步刺激了該領域的需求。
- 展望2030年,印度新增商業占地面積預計將達到3.58億平方英尺,較2023年大幅成長。這一成長帶來了對購物中心、辦公空間和其他商業設施的需求。例如,印度七大城市的甲級辦公大樓市場到 2026 年將擴大到 10 億平方英尺,到 2030 年將進一步擴大到 12 億平方英尺。因此,預計該國新的商業占地面積在預測期內將實現 5.26% 的強勁成長率。
住宅需求的增加和房地產行業的擴張將刺激住宅行業的需求
- 2022年,印度住宅占地面積成長9.4%,高於前一年。印度住宅需求激增,七大城市(德里國家首都轄區、班加羅爾、海得拉巴、孟買、普納那、清奈和加爾各答)總合建造約 402,000 套新房,較 2021 年成長 44%。 2023 年第一季,這些城市的住宅銷售量達到 114,000 套,比上年大幅增加 99,500 多套。因此,預計 2023 年印度新住宅占地面積將比 2022 年增加約 7,100 萬平方英尺。
- 2020年,印度住宅產業遭遇挫折,新屋占地面積與前一年同期比較%。下降的原因是全國範圍內的封鎖、供應鏈中斷、勞動力短缺、建築生產率放緩以及外國投資下降。不過,印度住宅房地產市場在2021年有所復甦,前七大城新增住宅約16.3萬套。這一激增導致 2021 年住宅領域新增占地面積與 2020 年相比大幅增加,達到約 6.49 億平方英尺。
- 展望未來,預計 2023 年至 2030 年間印度住宅產業的複合年成長率將達到 2.95%。這一成長得益於持續的住宅需求、不斷增加的投資以及有利的政府政策。特別是到2030年,預計印度40%以上的人口將居住在都市區,這將帶來約2500萬套額外經濟適用住宅的需求。此外,到2030年,主要城市的住宅房地產市場預計將達到150萬套,這將進一步推動該領域的需求。
印度建築化學品產業概況
印度建築化學品市場較為分散,前五大公司佔18.71%的市佔率。該市場的主要企業有:Fosroc, Inc.、MBCC Group、Pidilite Industries Ltd.、Saint-Gobain 和 Sika AG
其他福利
- Excel 格式的市場預測 (ME) 表
- 3個月的分析師支持
目錄
第1章執行摘要和主要發現
第2章 報告要約
第3章 引言
- 研究假設和市場定義
- 研究範圍
- 調查方法
第4章 產業主要趨勢
- 最終用途細分趨勢
- 商業的
- 工業/設施
- 基礎設施
- 住宅
- 重大基礎設施計劃(目前和已宣布)
- 法律規範
- 價值鍊和通路分析
第5章市場區隔
- 最終用途部分
- 商業的
- 工業/設施
- 基礎設施
- 住宅
- 產品
- 膠水
- 按子產品
- 熱熔膠
- 反應性
- 溶劑型
- 水性
- 錨栓和水泥漿
- 按子產品
- 水泥基固定材料
- 樹脂固定
- 其他
- 混凝土外加劑
- 按子產品
- 加速器
- 引氣劑
- 高效減水劑(塑化劑)
- 阻燃劑
- 減縮劑
- 黏度調節劑
- 減水劑(塑化劑)
- 其他
- 混凝土保護漆
- 按子產品
- 丙烯酸纖維
- 醇酸
- 環氧樹脂
- 聚氨酯
- 其他
- 地板樹脂
- 按子產品
- 丙烯酸纖維
- 環氧樹脂
- 聚天冬醯胺
- 聚氨酯
- 其他
- 修復和再生化學品
- 按子產品
- 光纖纏繞系統
- 水泥漿料
- 微混凝土砂漿
- 改質砂漿
- 鋼筋保護材料
- 密封材料
- 按子產品
- 丙烯酸纖維
- 環氧樹脂
- 聚氨酯
- 矽膠
- 其他
- 表面處理化學品
- 按子產品
- 硬化劑
- 脫模劑
- 其他
- 防水解決方案
- 按子產品
- 化學產品
- 膜
- 膠水
第6章競爭格局
- 關鍵策略趨勢
- 市場佔有率分析
- 商業狀況
- 公司簡介
- Ardex Group
- Don Construction Products Ltd.
- ECMAS Group
- Fosroc, Inc.
- MAPEI SpA
- MBCC Group
- Pidilite Industries Ltd.
- Saint-Gobain
- Sika AG
- Thermax Limited
第7章:CEO面臨的關鍵策略問題
第 8 章 附錄
- 世界概況
- 概述
- 五力分析框架(產業吸引力分析)
- 全球價值鏈分析
- 市場動態(DRO)
- 資訊來源及延伸閱讀
- 圖片列表
- 關鍵見解
- 資料包
- 詞彙表
簡介目錄
Product Code: 66762
The India Construction Chemicals Market size is estimated at 3.30 billion USD in 2024, and is expected to reach 5.02 billion USD by 2030, growing at a CAGR of 7.24% during the forecast period (2024-2030).
The commercial and residential sectors are leading the growth of the construction chemicals market in India
- India's construction chemicals market ranks third globally in profitability and is the leader in terms of growth. In 2022, the market surged by 6.97% in value, driven by increased construction activity and spending across several sectors. The market was projected to maintain its upward trajectory in 2023, with a 6.9% increase owing to robust real estate and infrastructure developments.
- The commercial sector dominates the demand for construction chemicals, given its funding sources, be it government or private entities. This financial backing makes investing in construction chemicals more accessible in commercial projects compared to residential or other building types. Moreover, commercial buildings, known for their higher densities and intricate designs, necessitate a wider range of construction chemicals.
- The residential sector follows closely as the second most lucrative sector for construction chemicals. India's status as the world's most populous nation translates into a significant number of residential buildings, driving up demand and market value. Additionally, the sector's consistent demand for waterproofing solutions further bolsters its significance.
- The market's value in the residential and commercial sectors is estimated to rise at similar and faster rates than the rest, recording CAGRs of 7.9% and 7.4% during the forecast period (2023-2030). These growth rates are estimated to be propelled by government initiatives, such as housing unit construction drives, and a business-friendly environment attracting both domestic and foreign investments.
India Construction Chemicals Market Trends
India's Grade A office market is expected to reach 1.2 billion sq. ft by 2030 and is likely to drive the demand for the commercial construction sector
- In 2022, India's new commercial floor area saw a 6.2% volume growth compared to 2021. The retail sector, particularly in the top seven cities (Delhi NCR, Bangalore, Hyderabad, Mumbai, Pune, Chennai, and Kolkata), witnessed robust demand, adding over 2.6 million sq. ft of mall space, a 27% increase from 2021. Looking ahead to 2023, the sector's new floor area is expected to surge by 38 million sq. ft, driven by a surge in foreign direct investment (FDI) fueling the need for new offices, retail outlets, and other facilities. Notably, the FDI equity inflow for construction development in 2023 was projected to hit USD 96 million.
- In 2020, India's commercial new floor area plummeted by 68.3% in volume compared to 2019. This decline was primarily due to a nationwide lockdown imposed by the government, which disrupted ongoing projects, strained supply chains, and impacted labor availability. However, as restrictions eased in 2021, the country witnessed a significant rebound, with the new floor area surging by approximately 526 million sq. ft. Additionally, 2021 saw a notable uptick in green building initiatives, with around 55% of commercial projects embracing sustainability, further bolstering the demand for the sector.
- Looking ahead to 2030, India's commercial new floor area is projected to hit 358 million sq. ft, a significant jump from 2023. This surge drives a growing appetite for shopping malls, office spaces, and other commercial facilities. For instance, India's Grade A office market in the top seven cities is set to expand to 1 billion sq. ft by 2026 and further to 1.2 billion sq. ft by 2030. Consequently, the country's commercial new floor area is poised to witness a robust CAGR of 5.26% during the forecast period.
Rise in demand for housing units and increasing real estate sector to boost residential sector demand
- In 2022, India witnessed a 9.4% growth in residential floor area, outpacing the previous year. The demand for housing in the country surged, with the top seven cities (Delhi NCR, Bangalore, Hyderabad, Mumbai, Pune, Chennai, and Kolkata) collectively adding approximately 402,000 new units, marking a 44% increase from 2021. In Q1 2023, housing sales in these cities reached 1.14 lakh units, a staggering jump of over 99,500 units from the previous year. Consequently, it was projected that the residential new floor area in India would expand by approximately 71 million sq. ft in 2023 compared to 2022.
- In 2020, the residential sector in India faced a setback, witnessing a 6.25% decline in new floor area compared to the previous year. This decline was attributed to the nationwide lockdown, disruptions in the supply chain, labor shortages, reduced construction productivity, and a dip in foreign investments. However, in 2021, the Indian residential real estate market rebounded, adding around 163,000 new residential units across the top seven cities. This surge translated into a significant increase of about 649 million sq. ft in the residential sector's new floor area in 2021 compared to 2020.
- Looking ahead, the residential sector in India is poised to exhibit a CAGR of 2.95% in terms of volume from 2023 to 2030. This growth can be attributed to sustained housing demand, increased investments, and favorable government policies. Notably, by 2030, it is projected that over 40% of India's population will reside in urban areas, driving a demand for approximately 25 million additional affordable housing units. Furthermore, by 2030, the residential real estate market is expected to hit 1.5 million units in key cities, further fueling the demand in the sector.
India Construction Chemicals Industry Overview
The India Construction Chemicals Market is fragmented, with the top five companies occupying 18.71%. The major players in this market are Fosroc, Inc., MBCC Group, Pidilite Industries Ltd., Saint-Gobain and Sika AG (sorted alphabetically).
Additional Benefits:
- The market estimate (ME) sheet in Excel format
- 3 months of analyst support
TABLE OF CONTENTS
1 EXECUTIVE SUMMARY & KEY FINDINGS
2 REPORT OFFERS
3 INTRODUCTION
- 3.1 Study Assumptions & Market Definition
- 3.2 Scope of the Study
- 3.3 Research Methodology
4 KEY INDUSTRY TRENDS
- 4.1 End Use Sector Trends
- 4.1.1 Commercial
- 4.1.2 Industrial and Institutional
- 4.1.3 Infrastructure
- 4.1.4 Residential
- 4.2 Major Infrastructure Projects (current And Announced)
- 4.3 Regulatory Framework
- 4.4 Value Chain & Distribution Channel Analysis
5 MARKET SEGMENTATION (includes market size, forecasts up to 2030 and analysis of growth prospects.)
- 5.1 End Use Sector
- 5.1.1 Commercial
- 5.1.2 Industrial and Institutional
- 5.1.3 Infrastructure
- 5.1.4 Residential
- 5.2 Product
- 5.2.1 Adhesives
- 5.2.1.1 By Sub Product
- 5.2.1.1.1 Hot Melt
- 5.2.1.1.2 Reactive
- 5.2.1.1.3 Solvent-borne
- 5.2.1.1.4 Water-borne
- 5.2.2 Anchors and Grouts
- 5.2.2.1 By Sub Product
- 5.2.2.1.1 Cementitious Fixing
- 5.2.2.1.2 Resin Fixing
- 5.2.2.1.3 Other Types
- 5.2.3 Concrete Admixtures
- 5.2.3.1 By Sub Product
- 5.2.3.1.1 Accelerator
- 5.2.3.1.2 Air Entraining Admixture
- 5.2.3.1.3 High Range Water Reducer (Super Plasticizer)
- 5.2.3.1.4 Retarder
- 5.2.3.1.5 Shrinkage Reducing Admixture
- 5.2.3.1.6 Viscosity Modifier
- 5.2.3.1.7 Water Reducer (Plasticizer)
- 5.2.3.1.8 Other Types
- 5.2.4 Concrete Protective Coatings
- 5.2.4.1 By Sub Product
- 5.2.4.1.1 Acrylic
- 5.2.4.1.2 Alkyd
- 5.2.4.1.3 Epoxy
- 5.2.4.1.4 Polyurethane
- 5.2.4.1.5 Other Resin Types
- 5.2.5 Flooring Resins
- 5.2.5.1 By Sub Product
- 5.2.5.1.1 Acrylic
- 5.2.5.1.2 Epoxy
- 5.2.5.1.3 Polyaspartic
- 5.2.5.1.4 Polyurethane
- 5.2.5.1.5 Other Resin Types
- 5.2.6 Repair and Rehabilitation Chemicals
- 5.2.6.1 By Sub Product
- 5.2.6.1.1 Fiber Wrapping Systems
- 5.2.6.1.2 Injection Grouting Materials
- 5.2.6.1.3 Micro-concrete Mortars
- 5.2.6.1.4 Modified Mortars
- 5.2.6.1.5 Rebar Protectors
- 5.2.7 Sealants
- 5.2.7.1 By Sub Product
- 5.2.7.1.1 Acrylic
- 5.2.7.1.2 Epoxy
- 5.2.7.1.3 Polyurethane
- 5.2.7.1.4 Silicone
- 5.2.7.1.5 Other Resin Types
- 5.2.8 Surface Treatment Chemicals
- 5.2.8.1 By Sub Product
- 5.2.8.1.1 Curing Compounds
- 5.2.8.1.2 Mold Release Agents
- 5.2.8.1.3 Other Product Types
- 5.2.9 Waterproofing Solutions
- 5.2.9.1 By Sub Product
- 5.2.9.1.1 Chemicals
- 5.2.9.1.2 Membranes
- 5.2.1 Adhesives
6 COMPETITIVE LANDSCAPE
- 6.1 Key Strategic Moves
- 6.2 Market Share Analysis
- 6.3 Company Landscape
- 6.4 Company Profiles
- 6.4.1 Ardex Group
- 6.4.2 Don Construction Products Ltd.
- 6.4.3 ECMAS Group
- 6.4.4 Fosroc, Inc.
- 6.4.5 MAPEI S.p.A.
- 6.4.6 MBCC Group
- 6.4.7 Pidilite Industries Ltd.
- 6.4.8 Saint-Gobain
- 6.4.9 Sika AG
- 6.4.10 Thermax Limited
7 KEY STRATEGIC QUESTIONS FOR CONCRETE, MORTARS AND CONSTRUCTION CHEMICALS CEOS
8 APPENDIX
- 8.1 Global Overview
- 8.1.1 Overview
- 8.1.2 Porter's Five Forces Framework (Industry Attractiveness Analysis)
- 8.1.3 Global Value Chain Analysis
- 8.1.4 Market Dynamics (DROs)
- 8.2 Sources & References
- 8.3 List of Tables & Figures
- 8.4 Primary Insights
- 8.5 Data Pack
- 8.6 Glossary of Terms
02-2729-4219
+886-2-2729-4219
 建築化學品市場規模、佔有率及成長分析(混凝土外加劑、防水劑、防護被覆劑、黏合劑及密封劑、修補劑及修復劑及地區)- 2025-2032 年產業預測
 中東和非洲的建築化學品:市場佔有率分析、行業趨勢和成長預測(2025-2030 年)亞太建築化學品:市場佔有率分析、產業趨勢與統計、成長預測(2025-2030 年)北美建築化學品:市場佔有率分析、行業趨勢和統計數據、成長預測(2025-2030 年)南美洲建築化學品-市場佔有率分析、產業趨勢與統計、成長預測(2025-2030 年)建築修復和維修化學品-市場佔有率分析、行業趨勢和統計、成長預測(2025-2030 年)建築化學品:市場佔有率分析、產業趨勢與統計、成長預測(2025-2030 年)歐洲建築化學品市場 -市場佔有率分析、產業趨勢與統計、成長預測(2025-2030 年)泰國建築化學品-市場佔有率分析、產業趨勢與成長預測(2025-2030年)美國建築化學品-市場佔有率分析、產業趨勢與統計、成長預測(2025-2030)
▼