


 |
市場調查報告書
商品編碼
1686626
生物肥料:市場佔有率分析、產業趨勢與統計、成長預測(2025-2030)Biofertilizer - Market Share Analysis, Industry Trends & Statistics, Growth Forecasts (2025 - 2030) |
||||||
※ 本網頁內容可能與最新版本有所差異。詳細情況請與我們聯繫。
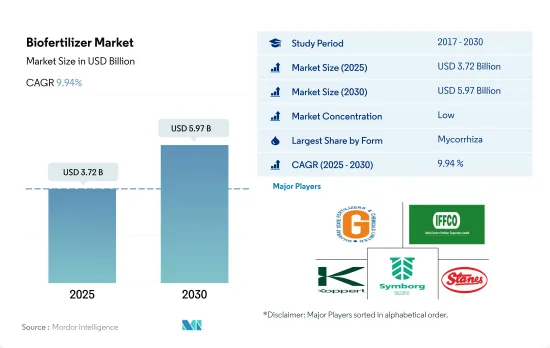
生物肥料市場規模預計在 2025 年將達到 37.2 億美元,預計到 2030 年將達到 59.7 億美元,預測期內(2025-2030 年)的複合年成長率為 9.94%。
- 生物肥料是活的微生物,可以透過調動或增加土壤中的養分供應來增強植物營養。農業中用作生物肥料最常見的微生物是菌根真菌、固氮螺菌、固氮菌、根瘤菌和解磷細菌。
- 其中,菌根真菌是世界上消耗量最大的生物肥料。 2022 年,它佔據生物肥料領域的 36.7%,市值為 10.4 億美元,產量為 170,600 噸。菌根真菌增加植物根部的表面積,增強養分的吸收。
- 根瘤菌是世界上消費量第二大的生物肥料。 2022年,它佔生物肥料領域的24.2%。北美在根瘤菌子區隔中佔據主導地位,當年的市場佔有率為 52.1%。耕地作物在北美根瘤菌子區隔占主導地位,2022 年佔 62.4%。根瘤菌與作物(一種連續作物)具有共生關係。因此,在根瘤菌子區隔中,連作作物占主導地位。在北美,也有大面積的土地種植連續作物。預計北美連續作物市場中的根瘤菌子區隔在預測期內的複合年成長率將達到 10.5%。
- 固氮螺菌佔生物肥料領域的16.3%。北美在固氮螺菌子區隔中佔據主導地位,2022 年佔 45.7%。
- 因此,隨著越來越多的農民尋求永續和環保的解決方案來提高作物產量和土壤健康,全球農業生物製藥市場中的生物肥料部分預計將在未來幾年內成長。
- 生物肥料是活的微生物,能夠透過調動或增加土壤中的養分來增強植物營養。北美和歐洲是全球生物肥料的主要消費地區。
- 2022 年,北美佔全球生物肥料市場的 34.5%。該地區有機作物種植面積在過去一段時間增加了 13.5%,從 2017 年的 140 萬公頃增加到 2021 年的 160 萬公頃。該地區對有機食品的需求正在迅速成長,2021 年北美人均有機食品支出為 109.7 美元。
- 2022年歐洲地區將佔30.7%,成為第二大生物肥料消費國。歐洲是世界上有機農業面積最大的地區,2021年達650萬公頃。歐盟委員會宣布了一項行動計劃,到2030年將成員國的有機農業面積提高到該地區農業用地面積的25.0%。預計這將進一步推動該地區的生物肥料市場。
- 亞太地區是水稻、甘蔗、水果和蔬菜等有機作物的主要生產地。中國和印度是新的領導者,但有機農業僅佔農業總面積的一小部分。 2017年至2021年,該地區的有機農業面積正在增加,預計這一趨勢將推動生物肥料市場的成長。
- 全球有機作物作物面積的增加,尤其是歐洲和北美等地區,以及對有機商品的需求的增加,可能會在預測期內推動對生物肥料的需求。
全球生物肥料市場趨勢
在北美和歐洲,由於人們意識的增強和政府的推動,有機生產達到了歷史最高水準。
- 有機農業已成為永續糧食系統的主要貢獻者,並在全球 187 個國家/地區實踐。截至2021年,全球有機農地面積為7,230萬公頃,2018年至2021年間各地區平均成長2.9%。有機耕地面積為1,440萬公頃,佔有機農地總面積的19.9%。
- 有機農業最強大的市場是北美和歐洲,這兩個地區佔世界有機耕地面積的41.0%。至2022年,歐洲有機耕地面積將達到650萬公頃,相當於全球有機耕地總面積的44.1%。北美和歐洲最重要的有機種植作物是蘋果、草莓、穀物和橄欖。
- 亞太地區的新興國家也加入了有機農業運動,並在生產和供應新鮮有機農產品方面實現自給自足,以滿足國內需求。有機農業趨勢在亞太地區日益興起,2017年至2022年間,該地區有機土地面積將增加18.8%。該地區政府的主要措施也在有機農業擴張趨勢中發揮了關鍵作用。例如,日本的《食品、農業和農村基本計畫》的目標是到2030年將有機農場和有機農地的數量增加兩倍。
- 有機農業的成長得益於人們對其益處的認知不斷提高,例如促進土壤健康、減少環境影響和生產更健康的食品。
人均有機食品支出的成長主要出現在美國和德國,這是由消費者對更健康、更永續食品的需求所推動的。
- 過去幾年,有機食品市場經歷了顯著成長,全球銷售額預計將從 2012 年的 708 億美元成長到 2020 年的 1,206 億美元。有機食品的流行趨勢受到多種因素的推動,包括消費者對更健康、更永續的食品選擇的需求不斷成長,以及對傳統農業對環境影響的認知不斷提高。預計未來幾年全球有機食品市場將持續維持成長趨勢。
- 根據有機貿易協會 2021 年的一項調查,當年有機水果和蔬菜的銷售量成長了約 4.5%,佔有機產品總銷量的 15%。北美在有機產品平均支出方面佔據市場主導地位,2021年美國的人均有機產品支出達到186.7美元,是北美國家中最高的。預計歐洲有機食品市場也將強勁成長,其中德國 2021 年人均有機食品支出最高,為 75.6 美元。
- 有機食品市場仍由消費者可支配收入較高的已開發國家主導,但預計新興國家的有機食品市場也將成長。例如,亞太地區的工人階級不斷壯大,這使得有機食品更容易取得且更便宜,有助於擴大市場。
生物肥料產業概況
生物肥料市場較為分散,前五大公司佔21.14%。市場的主要企業有:古吉拉特邦化肥與化學品有限公司、印度農民化肥合作社有限公司、Koppert Biological Systems Inc.、Symborg Inc. 和 T. Stanes and Company Limited(按字母順序排列)。
其他福利
- Excel 格式的市場預測 (ME) 表
- 3個月的分析師支持
目錄
第1章執行摘要和主要發現
第2章 報告要約
第3章 引言
- 研究假設和市場定義
- 研究範圍
- 調查方法
第4章 產業主要趨勢
- 有機種植區
- 有機產品人均支出
- 法律規範
- 阿根廷
- 澳洲
- 巴西
- 加拿大
- 中國
- 埃及
- 法國
- 德國
- 印度
- 印尼
- 伊朗
- 義大利
- 日本
- 墨西哥
- 荷蘭
- 奈及利亞
- 菲律賓
- 俄羅斯
- 南非
- 西班牙
- 泰國
- 土耳其
- 英國
- 美國
- 越南
- 價值鍊和通路分析
第5章市場區隔
- 形式
- 固氮螺菌
- 固氮菌
- 菌根真菌
- 解磷細菌
- 根瘤菌
- 其他生物肥料
- 作物類型
- 經濟作物
- 園藝作物
- 田間作物
- 地區
- 非洲
- 按國家
- 埃及
- 奈及利亞
- 南非
- 其他非洲國家
- 亞太地區
- 按國家
- 澳洲
- 中國
- 印度
- 印尼
- 日本
- 菲律賓
- 泰國
- 越南
- 其他亞太地區
- 歐洲
- 按國家
- 法國
- 德國
- 義大利
- 荷蘭
- 俄羅斯
- 西班牙
- 土耳其
- 英國
- 其他歐洲國家
- 中東
- 按國家
- 伊朗
- 沙烏地阿拉伯
- 其他中東地區
- 北美洲
- 按國家
- 加拿大
- 墨西哥
- 美國
- 北美其他地區
- 南美洲
- 按國家
- 阿根廷
- 巴西
- 南美洲其他地區
- 非洲
第6章 競爭格局
- 關鍵策略趨勢
- 市場佔有率分析
- 商業狀況
- 公司簡介.
- Andermatt Group AG
- Atlantica Agricola
- Binzhou Jingyang Biological Fertilizer Co. Ltd
- Biostadt India Limited
- Ficosterra
- Gujarat State Fertilizers & Chemicals Ltd
- Indian Farmers Fertiliser Cooperative Limited
- Indogulf BioAg LLC(Biotech Division of Indogulf Company)
- IPL Biologicals Limited
- Kiwa Bio-Tech
- Koppert Biological Systems Inc.
- Microbial Biological Fertilizers International
- Sustane Natural Fertilizer Inc.
- Symborg Inc.
- T.Stanes and Company Limited
第7章:CEO面臨的關鍵策略問題
第 8 章 附錄
- 世界概況
- 概述
- 五力分析框架
- 全球價值鏈分析
- 市場動態(DRO)
- 資訊來源及延伸閱讀
- 圖片列表
- 關鍵見解
- 資料包
- 詞彙表
The Biofertilizer Market size is estimated at 3.72 billion USD in 2025, and is expected to reach 5.97 billion USD by 2030, growing at a CAGR of 9.94% during the forecast period (2025-2030).
- Biofertilizers are living microorganisms that can enhance plant nutrition by either mobilizing or increasing nutrient availability in soils. The most common microorganisms used as biofertilizers in agriculture include mycorrhiza, Azospirillum, Azotobacter, Rhizobium, and phosphate-solubilizing bacteria.
- Among these, mycorrhiza is the most consumed biofertilizer globally. It accounted for 36.7% of the biofertilizer segment in 2022, with a market value of USD 1.04 billion and a volume of 170.6 thousand metric tons. Mycorrhiza increases the root surface area of plants, thus enhancing their nutrient uptake.
- Rhizobium is the second most consumed biofertilizer globally. It accounted for 24.2% of the biofertilizer segment in 2022. North America dominated the rhizobium sub-segment with a market share of 52.1% in the same year. Row crops dominated the rhizobium sub-segment in North America, accounting for 62.4% in 2022. Rhizobium has a symbiotic association with leguminous crops, a category of row crops. Thus, row crops dominated the rhizobium sub-segment. North America also has a large cultivation area of row crops. The rhizobium sub-segment in the North American row crops market is anticipated to record a CAGR of 10.5% during the forecast period.
- Azospirillum accounted for 16.3% of the biofertilizer segment. North America dominated the Azospirillum sub-segment, accounting for 45.7% in 2022.
- Thus, the biofertilizer segment of the global agricultural biologicals market is expected to grow in the coming years as more farmers seek sustainable and eco-friendly solutions to improve crop yields and soil health.
- Biofertilizers are living microorganisms that have the ability to enhance plant nutrition by either mobilizing or increasing nutrient availability in soils. North America and Europe are the major consumers of biofertilizers in the world.
- North America accounted for 34.5% of the global biofertilizer market in 2022. The area under cultivation of organic crops in the region increased by 13.5% during the historical period, from 1.4 million hectares in 2017 to 1.6 million hectares in 2021. The demand for organic food in the region is growing rapidly, with an average per capita spending on organic food products in North America at USD 109.7 in 2021.
- The European region accounted for 30.7% in 2022 and stood as the second-largest consumer of biofertilizers. Europe had the largest area under organic farming in the world, with 6.5 million hectares in 2021. The European Commission has unveiled an action plan to increase the organic area in the member countries to occupy 25.0% of the region's agricultural land area by 2030. This factor is further expected to drive the market for biofertilizers in the region.
- The Asia-Pacific region is a leading producer of organic crops such as rice, sugarcane, and fruits and vegetables. China and India are emerging leaders, although organic farming only accounts for a small portion of their total agricultural area. The organic farming area in the region grew from 2017 to 2021, and this trend is expected to drive growth in the biofertilizer market.
- The increasing organic crop area and increasing demand for organic commodities across the world, particularly in regions like Europe and North America, may drive the demand for biofertilizers during the forecast period.
Global Biofertilizer Market Trends
Organic production is at an all-time high in North America and Europe, due to the increasing awareness and Government initiatives.
- Organic agriculture has emerged as a significant contributor to sustainable food systems, with 187 countries practicing it globally. As of 2021, there was 72.3 million ha of organic agricultural land worldwide, with an average increase of 2.9% across all regions from 2018 to 2021. Organic arable land accounted for 14.4 million ha, representing 19.9% of the total organic agricultural land.
- The strongest markets for organic farming are North America and Europe, accounting for 41.0% of the global organic arable land. In 2022, Europe had 6.5 million ha of organic arable land, equivalent to 44.1% of the overall organic arable agricultural area. The most significant crops grown organically in North America and Europe are apples, strawberries, cereals, and olives.
- Developing countries in Asia-Pacific are also joining the organic agriculture movement and becoming self-sufficient in producing and providing fresh organic produce to meet their domestic demand. The trend of organic farming is gaining momentum in Asia-Pacific, with the region recording an 18.8% increase in organic arable land from 2017 to 2022. The major initiatives by governments in the region also play a vital role in the growing trend of organic farming. For example, Japan's Basic Plan for Food, Agriculture, and Rural Areas aims to triple the number of organic farmers and lands by 2030.
- The growth of organic agriculture is driven by the rising awareness of the benefits of organic farming, such as promoting soil health, reducing environmental impacts, and producing healthier food.
Per capita spending of organic food majorly observed in United States and Germany, attributed to the consumer demand for healthier and sustainable food
- The organic food market experienced significant growth in the past few years, with global sales reaching USD 120.6 billion in 2020, up from USD 70.8 billion in 2012. The trend toward organic food is being driven by several factors, such as increasing consumer demand for healthier, more sustainable food options and a growing awareness of the environmental impact of conventional agriculture. The global organic food market is expected to continue its growth trend over the coming years.
- According to a survey conducted by the Organic Trade Association in 2021, sales of organic fruits and vegetables increased by around 4.5% in the same year, accounting for 15% of the overall organic sales. North America dominates the market in terms of average spending on organic products, with per capita spending in the United States reaching USD 186.7 in 2021, the highest among all North American countries. Europe is also expected to experience significant growth in the organic food market, with Germany accounting for the highest per capita spending of USD 75.6 in 2021.
- While the organic food market is still dominated by developed countries with high consumer disposable incomes, it is also expected to grow in developing nations. For example, the increasing number of working-class people in the Asia-Pacific region may contribute to the market's expansion due to the growing availability and affordability of organic food products.
Biofertilizer Industry Overview
The Biofertilizer Market is fragmented, with the top five companies occupying 21.14%. The major players in this market are Gujarat State Fertilizers & Chemicals Ltd, Indian Farmers Fertiliser Cooperative Limited, Koppert Biological Systems Inc., Symborg Inc. and T.Stanes and Company Limited (sorted alphabetically).
Additional Benefits:
- The market estimate (ME) sheet in Excel format
- 3 months of analyst support
TABLE OF CONTENTS
1 EXECUTIVE SUMMARY & KEY FINDINGS
2 REPORT OFFERS
3 INTRODUCTION
- 3.1 Study Assumptions & Market Definition
- 3.2 Scope of the Study
- 3.3 Research Methodology
4 KEY INDUSTRY TRENDS
- 4.1 Area Under Organic Cultivation
- 4.2 Per Capita Spending On Organic Products
- 4.3 Regulatory Framework
- 4.3.1 Argentina
- 4.3.2 Australia
- 4.3.3 Brazil
- 4.3.4 Canada
- 4.3.5 China
- 4.3.6 Egypt
- 4.3.7 France
- 4.3.8 Germany
- 4.3.9 India
- 4.3.10 Indonesia
- 4.3.11 Iran
- 4.3.12 Italy
- 4.3.13 Japan
- 4.3.14 Mexico
- 4.3.15 Netherlands
- 4.3.16 Nigeria
- 4.3.17 Philippines
- 4.3.18 Russia
- 4.3.19 South Africa
- 4.3.20 Spain
- 4.3.21 Thailand
- 4.3.22 Turkey
- 4.3.23 United Kingdom
- 4.3.24 United States
- 4.3.25 Vietnam
- 4.4 Value Chain & Distribution Channel Analysis
5 MARKET SEGMENTATION (includes market size in Value in USD and Volume, Forecasts up to 2030 and analysis of growth prospects)
- 5.1 Form
- 5.1.1 Azospirillum
- 5.1.2 Azotobacter
- 5.1.3 Mycorrhiza
- 5.1.4 Phosphate Solubilizing Bacteria
- 5.1.5 Rhizobium
- 5.1.6 Other Biofertilizers
- 5.2 Crop Type
- 5.2.1 Cash Crops
- 5.2.2 Horticultural Crops
- 5.2.3 Row Crops
- 5.3 Region
- 5.3.1 Africa
- 5.3.1.1 By Country
- 5.3.1.1.1 Egypt
- 5.3.1.1.2 Nigeria
- 5.3.1.1.3 South Africa
- 5.3.1.1.4 Rest of Africa
- 5.3.2 Asia-Pacific
- 5.3.2.1 By Country
- 5.3.2.1.1 Australia
- 5.3.2.1.2 China
- 5.3.2.1.3 India
- 5.3.2.1.4 Indonesia
- 5.3.2.1.5 Japan
- 5.3.2.1.6 Philippines
- 5.3.2.1.7 Thailand
- 5.3.2.1.8 Vietnam
- 5.3.2.1.9 Rest of Asia-Pacific
- 5.3.3 Europe
- 5.3.3.1 By Country
- 5.3.3.1.1 France
- 5.3.3.1.2 Germany
- 5.3.3.1.3 Italy
- 5.3.3.1.4 Netherlands
- 5.3.3.1.5 Russia
- 5.3.3.1.6 Spain
- 5.3.3.1.7 Turkey
- 5.3.3.1.8 United Kingdom
- 5.3.3.1.9 Rest of Europe
- 5.3.4 Middle East
- 5.3.4.1 By Country
- 5.3.4.1.1 Iran
- 5.3.4.1.2 Saudi Arabia
- 5.3.4.1.3 Rest of Middle East
- 5.3.5 North America
- 5.3.5.1 By Country
- 5.3.5.1.1 Canada
- 5.3.5.1.2 Mexico
- 5.3.5.1.3 United States
- 5.3.5.1.4 Rest of North America
- 5.3.6 South America
- 5.3.6.1 By Country
- 5.3.6.1.1 Argentina
- 5.3.6.1.2 Brazil
- 5.3.6.1.3 Rest of South America
- 5.3.1 Africa
6 COMPETITIVE LANDSCAPE
- 6.1 Key Strategic Moves
- 6.2 Market Share Analysis
- 6.3 Company Landscape
- 6.4 Company Profiles (includes Global Level Overview, Market Level Overview, Core Business Segments, Financials, Headcount, Key Information, Market Rank, Market Share, Products and Services, and Analysis of Recent Developments).
- 6.4.1 Andermatt Group AG
- 6.4.2 Atlantica Agricola
- 6.4.3 Binzhou Jingyang Biological Fertilizer Co. Ltd
- 6.4.4 Biostadt India Limited
- 6.4.5 Ficosterra
- 6.4.6 Gujarat State Fertilizers & Chemicals Ltd
- 6.4.7 Indian Farmers Fertiliser Cooperative Limited
- 6.4.8 Indogulf BioAg LLC (Biotech Division of Indogulf Company)
- 6.4.9 IPL Biologicals Limited
- 6.4.10 Kiwa Bio-Tech
- 6.4.11 Koppert Biological Systems Inc.
- 6.4.12 Microbial Biological Fertilizers International
- 6.4.13 Sustane Natural Fertilizer Inc.
- 6.4.14 Symborg Inc.
- 6.4.15 T.Stanes and Company Limited
7 KEY STRATEGIC QUESTIONS FOR AGRICULTURAL BIOLOGICALS CEOS
8 APPENDIX
- 8.1 Global Overview
- 8.1.1 Overview
- 8.1.2 Porter's Five Forces Framework
- 8.1.3 Global Value Chain Analysis
- 8.1.4 Market Dynamics (DROs)
- 8.2 Sources & References
- 8.3 List of Tables & Figures
- 8.4 Primary Insights
- 8.5 Data Pack
- 8.6 Glossary of Terms
 中國生物肥料市場佔有率分析、產業趨勢與統計、成長預測(2025-2030 年)根瘤菌:市場佔有率分析、產業趨勢與統計、成長預測(2025-2030 年)生物有機肥料:市場佔有率分析、產業趨勢與統計、成長預測(2025-2030 年)美國生物肥料市場:市場佔有率分析、產業趨勢和成長預測(2025-2030 年)
 2025年全球生物肥料市場報告
 全球生物肥料市場研究報告-產業分析、規模、佔有率、成長、趨勢和預測 2025 年至 2033 年2025 年全球根瘤菌肥料市場報告
 2025 年至 2033 年生物肥料市場報告(按類型、作物、微生物、應用方式和地區分類)根瘤菌生物肥料市場評估,依配方、作物類型、應用、最終用途、地區、機會和預測,2018-2032 年生物有機肥料市場 - 2025 年至 2030 年預測