


|
市場調查報告書
商品編碼
1481476
營運商中立網路營運商(CNNO)-市場回顧(2023年第4季):Carrier-Neutral Network Operators - 4Q23 Market Review: Revenues up 5%, Capex up 8%, in 2023, M&A Slows to Trickle as Organic Growth Takes Over, PE Firms Continue to Reshape Sector and GenAI Hype Builds |
|||||||
本報告回顧了營運商中立網路營運商 (CNNO) 市場的成長和發展,追蹤了 2011 年第一季至 2023 年第四季全球 47 家 CNNO 的廣泛財務統計數據。
2023年全年,目標公司營收為997億美元(年增5.1%),資本投資為348億美元(年增7.8%)。截至2023年底,這些國營企業的淨財產、廠房及設備價值為2,611億美元(年增3.9%),僱用員工約11.3萬人(年增2.1%)。
視覺的
報告要點:
- 收入: CNNO 產業的收入將從 2011 年的不到 200 億美元增加到 2023 年的 997 億美元。這一 5.1% 的成長僅略低於去年網路規模產業 6.2% 的成長,並遠超過營運商 2023 年 1% 的營收下降幅度。2023 年收入排名前五名的 CNNO 分別是China Tower (CTC) 、American Tower (ATC)、Equinix、Level 3、Crown Castle。CTC是蜂巢塔,Equinix是資料中心,Level 3是光纖/頻寬。但 ATC 橫跨蜂巢塔、資料中心和光纖,而 Crown Castle 同時擁有蜂巢塔和光纖。兩者都代表了 CNNO 領域基礎設施融合的趨勢,各個實體透過擁有更完整的資產 "平台" 來尋求協同效應。
- 市場在十年內成長了五倍以上,前景也急劇擴大。最重要的是,營運商剝離資產來創建或擴大許多 CNNO。例如,China Tower於2015年進入市場,當時中國政府整合了國內三大國有業者的鐵塔控股權。規模小得多的Uniti Group成立於 2015 年,當時營運商 Windstream 剝離了其大部分被動網路基礎設施。在過去十年中,為了發展 CNNO 部門,出現了許多此類分拆。2011 年以來的併購總額為 2,280 億美元,與同期資本支出 2,910 億美元相差不遠。
- 資本支出: CNNO的資本支出將從2011年的60億美元增加到2023年的348億美元。這比 2022 年的總額增加了近 8%,當時營運商和網路擴展器的資本支出分別下降了 4% 和 5%。CTC 的資本支出最高,其次是 Digital Realty、Equinix、Cellnex 和 NBN Australia。
- 獲利能力: 2023年CNNO的平均淨利率為2.9%,高於2022年的-0.2%,但低於2021年的+6.8%。自由現金流利潤率也為 4.9%,不到 2021 年 10.4% 和 2022 年 11.5% 的一半。利率上升是幾個因素之一。截至 2023 年,CNNO 的資產負債表債務接近 2,430 億美元,現金和投資略高於 1,900 億美元。即使在強勁的需求趨勢下,一些 CNNO 仍負債纍纍,並正在努力精簡管理。
- 員工2023 年,CNNO 約有 113,000 名員工。CNNO 的目標是高效運作其基礎設施,並盡可能自動化以降低勞動成本。然而,由於大多數CNNO進行併購,他們往往需要整合和合理化其資產,然後才能獲得規模和綜效的好處。由於勞動力調整,可能會出現一些延遲。就員工人均收入而言,CNNO 產業到 2023 年將達到 89 萬美元以上,略高於 2022 年的 87 萬美元。與 2023 年網路規模的 584,000 美元和電信公司的 392,000 美元相比,差異非常明顯。
覆蓋範圍
本次審查包括以下公司:
|
|
目錄
- 一、報告亮點
- 2. CNNO板塊概況
- 3.分析
- 四、運行指標
- 5.關鍵統計數據
- 6.細分細分分析
- 7.依公司深入分析
- 8.企業對標
- 9.原始數據
- 10.匯率
- 11.關於我們
This report reviews the growth and development of the carrier-neutral network operator (CNNO) market. The report tracks a wide range of financial stats for 47 CNNOs across the globe, from 1Q11 through 4Q23. For the full-year 2023, the companies covered by this study represented $99.7 billion (B) in revenues (+5.1% YoY), and $34.8 B in capex (+7.8% YoY). At the end of 2023 (EOY23), these CNNOs had $261.1B of net plant, property and equipment (net PP&E) on the books (+3.9% YoY), and employed approximately 113,000 people (+2.1% YoY).
VISUALS
The CNNO market is the smallest of three operator segments tracked by MTN Consulting on a quarterly basis, alongside telco & webscale, but CNNOs play a crucial, complementary role in the communications sector and own and operate a large portion of the world's cell towers, data centers, and fiber networks. In the old days, telcos did it all: they owned all the network infrastructure, they manufactured the switches and transmission gear deployed in the network, and even provided CPE. That model is long since extinct. The telco of 2024 cobbles together its physical network from a mix of owned and leased or rented resources. Cloud providers in the webscale world do the same; while they spend heavily on capex ($192B last year), they generally lease fiber or transmission bandwidth, and only own a portion of their data centers. CNNOs do serve other end markets, including various enterprise verticals (finance, media, and energy), and government. But telcos and webscalers are the biggest targets. CNNOs play a vital role in the network design and cost structure of these operators.
In addition to demand from the telco & webscale markets, other factors driving the development of the CNNO sector over the last decade include: low interest rates (in the past) enabling debt-financed expansion (M&A and capex); the tax advantages of the real estate investment trust (REIT) operating model; and, the growth of the asset pool managed by private equity, a key source of funding for CNNOs. Private equity is the single largest force driving the CNNO market today. Recent developments include: Blackrock acquired Global Infra Partners (1/24); Blackstone partnered with Digital Realty on a $7B hyperscale JV (12/23); Brookfield bought Cyxtera (11/23) and the Indian tower assets of American Tower (1/24); EQT acquired EdgeConneX (1/24); KKR purchased TIM's fiber network NetCo for $24B (1/24). More broadly, a number of large PE firms are creating portofolios of "digital infrastructure" assets, and buying up or funding new CNNOs. They're attempting to create synergies across their digital investees, sometimes through mergers, and synergies with other parts of their investment portfolio. With the rise of GenAI, for instance, some PE firms are investing directly in energy supply in order to ensure competitive rates and terms for the data center players in their portoflio.
Below are some highlights from the report:
- Revenues: from under $20B in 2011, the CNNO sector recorded revenues of $99.7B in 2023. This 5.1% growth is only a bit slower than the 6.2% growth of the webscale sector last year, and far ahead of the 1% revenue decline experienced by telcos in 2023. The largest 5 CNNOs by revenues in 2023 were China Tower (CTC), American Tower (ATC), Equinix, Level 3, and Crown Castle. Three of these are almost entirely focused on one type of infrastructure: cell towers for CTC, data centers for Equinix, and fiber/bandwidth for Level 3. However, ATC has substantial holdings across cell towers, data centers, and fiber, while Crown Castle has both cell towers and fiber. Both are good representations of the trend towards infrastructure convergence in the CNNO sector, where individual corporate entities seek out synergies from owning a more complete "platform" of assets. Many private equity firms are also attempting to create a virtual "platform" through holdings across different portfolio companies, but it's not clear that this can be truly accomplished without a single corporate entity, ideally with public reporting requirements.
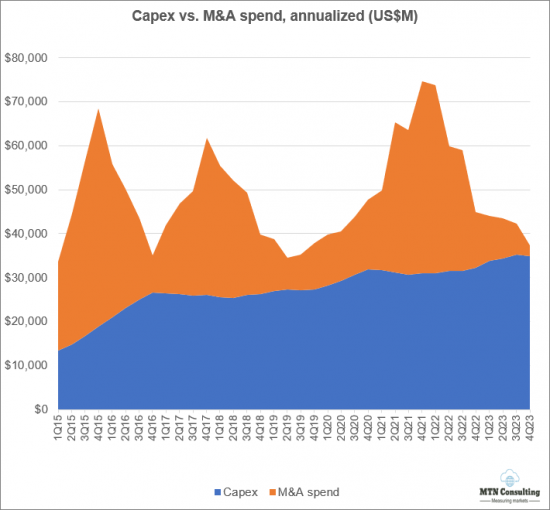
- To grow over five-fold in a decade, the scope of the market has expanded dramatically: most importantly, telcos have spun off assets to create or enlarge many CNNOs. For instance China Tower entered the market in 2015 when the Chinese government merged the tower holdings of that country's three state-owned telcos. On a far smaller scale, US-based Uniti Group was created in 2015 when Windstream, a telco, spun out most of its passive network infrastructure holdings. Many other such spinoffs were accomplished over the last decade in order to grow the CNNO sector. This is why the CNNO sector spends so heavily on M&A: since 2011, M&A spending has totaled $228B, not much less than the $291B capex spend for the same period.
- Capex: from ~$6B in 2011, CNNO capex was $34.8B in 2023. That is up nearly 8% from the 2022 total, in a year when capex for telcos and webscalers fell 4% and 5%, respectively. CTC reported the highest capex, followed by Digital Realty, Equinix, Cellnex, and NBN Australia. A major reason for CNNO's healthy capex last year was widespread enthusiasm for generative AI, and an investor view that CNNO data centers can ride this enthusiasm to faster growth as long as they invest now, in a big way. To speed development, the two largest data center-focused CNNOs are both using creative financing vehicles to build hyperscale-class facilities for the big cloud providers. In December 2023, for instance, Digital Realty announced a $7B JV with Blackstone, to build 4 hyperscale campuses across three metro areas on two continents, supporting an IT load of up to 500MW, or the equivalent power needs of over 300K households.
- Profitability: average net margin for the CNNO sector was 2.9% in 2023, up from -0.2% in 2022 but down from the +6.8% of 2021. Free cash flow margin also disappointed in 2023, amounting to 4.9%, less than half of the 10.4% and 11.5% recorded in 2021-22 respectively. Rising interest rates were one of several factors. CNNOs had nearly $243B of debt on the balance sheets at EOY23, and just over $19B in cash & investments. Even with strong demand trends, some CNNOs are attempting to streamline operations in order to cope with their heavy debt load. American Tower, for instance, sold off its Indian operations for $2.5B in Jan. 2024, to Brookfield.
- Employees: CNNOs ended 2023 with about 113K employees, from 110.7K at EOY2022. CNNOs aim for efficiency in the operation of their infrastructure, and use automation when possible to lower labor costs. However, most CNNOs engage in M&A and hence often need to integrate & rationalize assets before they can reap the scale & synergy benefits. There can be some delay as adjustments to the workforce are made. On a revenue per employee basis, the CNNO sector is impressive, at over $890K per employee in 2023, up slightly from $870K in 2022. This compares to $584K for webscale in 2023, and just $392K for the telco market.
COVERAGE:
The following companies are included in this Market Review:
|
|
Table of Contents
- 1. Report Highlights
- 2. CNNO Segment Overview
- 3. Analysis
- 4. Operating Metrics
- 5. Key Stats
- 6. Segment Drilldown
- 7. Company Drilldown
- 8. Company Benchmarking
- 9. Raw Data
- 10. Exchange Rates
- 11. About
List of Figures and Charts
- 1. Revenues by CNNO type (US$M)
- 2. Revenues single-quarter (US$M)
- 3. CNNO Profitability, annualized (%)
- 4. Capex & M&A spending, single-quarter (US$M)
- 5. Net PP&E by CNNO type (US$M)
- 6. Number of data centers & NRSF per data center (K)
- 7. Bandwidth fiber route miles, Global
- 8. CNNO towers & average tenancy ratio
- 9. Average size of data center, owned vs. leased: Equinix (000s of sq ft)
- 10. Average number of cabinets installed, owned vs. leased: 21ViaNet
- 11. TOP CNNOs (2023): # OF DATACENTERS
- 12. TOP CNNOs (2023): NET RENTABLE SQUARE FEET (NRSF) (MN)
- 13. TOP CNNOs (2023): NRSF PER DATA CENTER (K)
- 14. TOP CNNOs (2023): # OF TOWERS
- 15. TOP CNNOs (2023): NUMBER OF TENANTS
- 16. TOP CNNOs (2023): AVG TENANCY PER OCCUPIED TOWER
- 17. TOP CNNOs (2023): ROUTE MILES OF FIBER
Below charts by total CNNO market, CNNO sub-segments, and by companies:
- 1. Revenues: annual, single-quarter, and annualized (US$M)
- 2. Profitability (Net Profit; Cash from operations; Free cash flow): annual, single-quarter, and annualized (US$M)
- 3. Spending (M&A; Capex): annual, single-quarter, and annualized (US$M)
- 4. Cash & Short-term Investments: annual and single-quarter (US$M)
- 5. Debt (Total debt; Net debt): annual and single-quarter (US$M)
- 6. Property, Plant & Equipment: annual and single-quarter (US$M)
- 7. Key Ratios: Net margin; Capex/revenues; M&A/revenues; Free cash flow/revenues
- 8. Total employees
- 9. Revenue per employee, annualized (US$K)
- 10. FCF per employee, annualized (US$K)
- 11. Net PP&E per employee, annualized (US$K)
Company benchmarking charts:
- 1. 2011 vs. 2023: company benchmark by KPI (Revenues, Net profit, Cash from operations, Capex, Free cash flow, Cash & short-term investments, Net PP&E, Total debt)
- 2. 2011 vs. 2023: company benchmark by key ratio (Capex/revenues; Net margin; FCF margin)
- 3. Top 5 CNNOs by sub-segment: by KPI (Revenues, Net profit, Cash from operations, Capex, Free cash flow, Cash & short-term investments, Net PP&E, Total debt)
- 4. Top 5 CNNOs by sub-segment by Key ratio: Capex/revenues; Net margin; FCF margin
- 5. Top CNNOs by infrastructure type (2023):
- # of towers
- Avg tenancy per occupied tower
- Number of Tenants
- Route miles of fiber
- # of datacenters
- Net rentable square feet (NRSF) (Mn)
 關稅情勢如何影響美國再生能源成本
 關稅情勢對美國的再生能源成本帶來的影響- 數據
 通訊網路營運商市場回顧(2024年第三季):營收復甦,但持續的支出削減導致年度資本支出低於3,000億美元大關
 網路營運商資本支出展望(2024 年第四季版):電信公司持平,但人工智慧驅動的生成式資料中心炒作將推動電信資本支出在 2024 年超過 6,000 億美元,其中 Scalers 預計將引領市場
 網路營運商永續發展策略的全球市場:2024-2029
 Direct-to-Cell 全球市場:2024-2029
 Apps Run The World - 應用市場分析與買家洞察
 虛擬網路營運商世界市場報告(2024 年)
 虛擬網路營運商 (VNO) 的全球市場預測(截至 2030 年):按類型、目標客戶、服務、技術、最終用戶和地區進行分析
 虛擬網路營運商市場- 按服務(行動虛擬網路營運商(MVNO)、固定虛擬網路營運商(FVNO))、按產品(預付費、後付費)、按最終用戶(消費者、企業)、2024 - 2032 年預測