


|
市場調查報告書
商品編碼
1636632
通訊網路營運商市場回顧(2024年第三季):營收復甦,但持續的支出削減導致年度資本支出低於3,000億美元大關Telecommunications Network Operators - 3Q24 Market Review: Telco Topline Rebounds but Annualized Capex Dips Below $300B Mark amid Continued Spending Cuts |
|||||||
本報告回顧了通訊網路營運商市場的成長和發展。本報告對2011年第一季至2024年第三季全球140家電信營運商的財務統計資料進行了廣泛的追蹤。
電信網路營運商2024年第三季年化收入為1.77兆美元,較上年同期成長0.1%;勞動力支出為2,624億美元,成長0.8%,資本支出為2,946億美元,下降7.7%。截至2024年9月,員工人數約445萬人,較前一年減少1.5%。
視覺
報告重點:
營收:通訊營收年增 0.8%至 4,414億美元,2024年第三季年化營收年增 0.1%至 1,7706億美元。在營運商層面,2024年第三季營收成長排名前20位的公司中,每年化成長率排名的有5家:Airtel(4.6%)、America Movil(4.3%)、STC(Saudi Telecom)(4.2%)、Deutsche Telekom (3.3%)和BT(2.5%)。依照同樣的標準,同期成長率最差的公司分別是Vodafone(-6.8%)、KDDI(-5.7%)、NTT(-5.0%)、SoftBank(-3.6%)和BCE(-1.6%)。匯率波動並不是第三季的重要因素,大多數主要貨幣相對於第三季的水準保持相對穩定。
資本支出:截至2024年9月的年度資本支出為711億美元,年減6.1%,2024年第三季的資本支出以年率計算為2,946億美元,較去年同期下降7.7%。在營運商層面,2024年第三季按年化資本支出成長率排名前20名的營運商中有 5 家分別是 BSNL(300.6%)、Telstra(52.3%)、BT(4.8%)、NTT(3.0%)和China Mobile(1.9%)。基於同樣的理由,該時期資本支出成長表現最差的公司包括 Reliance Jio(下降 27.4%)、Verizon(下降 22.5%)、Vodafone(下降20.0%)、Deutsche Telekom(下降 18.1%)和 KDDI(下降 16.3%)。
OPEX/勞動成本:2024年第三季的OPEX 為 1,5079億美元,較去年同期小幅成長 0.9%。若扣除折舊及攤銷,營收年增1.7%至11,794億美元。電信公司營運支出(OPEX)的關鍵組成部分之一是勞動力成本,其中包括工資、薪水、獎金、福利和遣散費。2024年第三季年化勞動成本年增 0.8%,勞動成本佔 OPEX(不包括 D&A)的百分比為 22.2%。
利潤率:2024年第三季的年化 EBITDA 利潤率和 EBIT 利潤率與2023年第三季相比均略有下降。2024年第三季的年化 EBIT 利潤率從2023年第三季的15.5%下降至 14.8%,而2024年第三季的年化 EBITDA 利潤率為 33.4%,低於2023年第三季的34.5%。
區域趨勢:美洲將在 3Q24 保持其作為最大收入地區的地位,佔全球電信收入的37.2%,緊隨其後的是亞洲,佔 36.4%。從資本投資額來看,亞洲佔全球資本投資的38.2%,超過美洲成為第一大地區。這與2022年第三季和2023年第三季的情況有所不同,當時美洲憑藉 AT&T 和 Verizon 的5G 支出排名第一。2024年第三季,歐洲的年化資本密集度最高,為 17.8%,其次是中東和非洲,為 17.0%。
目標企業
|
|
調查區:
|
|
目錄
- 1.報告重點
- 2.摘要
- 3.市場概況
- 4.分析
- 5.關鍵統計:2024年第三季
- 6.員工統計
- 7.業者排名
- 8.公司深入分析
- 9.公司標竿管理
- 10.依國家細分
- 11.依公司及國家細分
- 12.依地區細分
- 13.原始資料
- 14.訂閱者與流量
- 15.匯率
- 16.研究方法與範圍
- 17.關於我們
This report reviews the growth and development of the telecommunications network operator (TNO, or telco) market. The report tracks a wide range of financial stats for 140 telcos across the globe, from 1Q11 through 3Q24. For the annualized 3Q24 period, telcos represented $1.77 trillion (T) in revenues (0.1% growth YoY), $262.4 billion (B) in labor costs (0.8% YoY), and $294.6B in capex (-7.7% YoY). They employed approximately 4.45 million people as of September 2024, down 1.5% from the prior year.
VISUALS
Below are a few highlights from the report:
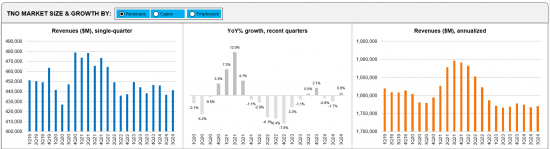
Revenues: Telco topline grew slightly by 0.8% on a YoY basis to post $441.4 B in the latest single quarter ending 3Q24. Revenues for the annualized 3Q24 period were $1,770.6B, up 0.1% YoY over the same period in the previous year. At the operator level, five of the top 20 telcos by topline growth in 3Q24 on an annualized basis include Airtel (4.6%), America Movil (4.3%), STC (Saudi Telecom) (4.2%), Deutsche Telekom (3.3%), and BT (2.5%). By the same criteria, the worst telco growth came from Vodafone (-6.8%), KDDI (-5.7%), NTT (-5.0%), SoftBank (-3.6%), and BCE (-1.6%) during the same period. Note that exchange rate volatility was NOT a major factor in 3Q24, as most major currencies were relatively stable versus 3Q23 levels.
Capex: Capex spending declined by 6.1% on a YoY basis to post $71.1B in the latest single quarter ending September 2024. Capex for the annualized 3Q24 period was $294.6B, down 7.7% YoY over the same period in the previous year. At the operator level, five of the top 20 telcos by capex growth in 3Q24 on an annualized basis include BSNL (300.6%), Telstra (52.3%), BT (4.8%), NTT (3.0%), and China Mobile (1.9%). By the same criteria, the worst capex growth came from Reliance Jio (-27.4%), Verizon (-22.5%), Vodafone (-20.0%), Deutsche Telekom (-18.1%), and KDDI (-16.3%) during the same period.
Opex and labor costs: Total opex for the telecom industry in the annualized 3Q24 period stood at $1,507.9B, a slight increase of 0.9% over the same period in the previous year. Excluding depreciation and amortization (D&A) costs, opex increased by 1.7% on YoY basis to record $1,179.4B in the annualized 3Q24 period. One significant element of telco opex is labor costs, which include salaries, wages, bonuses, benefits, and retirement/severance costs. Labor costs grew by 0.8% YoY in the annualized 3Q24 period, while labor costs as a percentage of opex (ex-D&A) was 22.2% in the same period.
Profitability margins: Both EBITDA and EBIT margins showed a slight decline in annualized 3Q24 compared to 3Q23. The annualized EBIT margin dipped from 15.5% in 3Q23 to 14.8% in 3Q24, while the EBITDA margin for the annualized 3Q24 period stood at 33.4%, down from 34.5% in annualized 3Q23.
Regional trends: The Americas retained its position as the largest revenue-generating region in 3Q24, contributing 37.2% of global telco revenues, closely followed by Asia with a 36.4% share. On a capex basis though, Asia emerged as the top spender, claiming 38.2% of global capex and outpacing the Americas; this is a change from 3Q22 and 3Q23, when Americas ranked #1 on the back of 5G spending by AT&T and Verizon. Europe retained the highest annualized capital intensity, reaching 17.8% in 3Q24, followed by MEA at 17.0%.
Important note: We have made some significant enhancements to our telco market review report in 1Q24. The changes are designed to provide a more insightful and user-friendly experience:
- 'Market Snapshot' Tab:This tab now features an interactive dashboard view of the telco market, allowing users to interact with and analyze market data more effectively. Additionally, users can export the dashboard to PDF for convenient sharing and reference.
- Two distinct sections have been created from the previous 'Company Deepdive & Benchmarking' section for greater clarity and functionality:
- 1.'Company Drilldown': Provides a comprehensive analysis of a selected company from the full set of 140 telcos. It covers various metrics including revenue, capex, employee counts, costs, profitability, cash and debt levels, and key ratios.
- 2.'Company Benchmarking': Focuses on a sample of 79 telcos, representing approximately 82% of the global market. This section allows users to select and compare up to 5 telcos across multiple metrics such as labor costs, opex, EBIT, as well as revenues, capex, and employee counts. The sample includes operators from all regions and of varying sizes.
Both new sections also feature the capability to export graphics to PDF, enhancing the flexibility and utility of the data presented.
Operator coverage:
|
|
Regional coverage:
|
|
Table of Contents
- 1. Report Highlights
- 2. Summary
- 3. Market snapshot
- 4. Analysis
- 5. Key stats through 3Q24
- 6. Labor stats
- 7. Operator rankings
- 8. Company drilldown
- 9. Company benchmarking
- 10. Country breakouts
- 11. Country breakouts by company
- 12. Regional breakouts
- 13. Raw Data
- 14. Subs & traffic
- 15. Exchange rates
- 16. Methodology & Scope
- 17. About
List of Figures and Charts:
- 1. TNO market size & growth by: Revenues, Capex, Employees - 1Q19-3Q24
- 2. Regional trends by: Revenues, Capex - 1Q19-3Q24
- 3. Opex & Cost trends
- 4. Labor cost trends: 1Q20-3Q24
- 5. Profitability margin trends: 1Q20-3Q24
- 6. Spending (opex, labor costs, capex): annual and quarterly trend
- 7. Key ratios: annual and quarterly trend
- 8. Workforce & productivity trends: 1Q14-3Q24
- 9. Operator rankings by revenue and capex: latest single-quarter and annualized periods
- 10. Top 20 TNOs by capital intensity: latest single-quarter and annualized periods
- 11. Top 20 TNOs by employee base: latest single-quarter
- 12. TNOs: YoY growth in single quarter revenues
- 13. TNOs: Annualized capital intensity, 1Q16-3Q24
- 14. TNOs: Revenue and RPE, annualized 1Q16-3Q24
- 15. TNOs: Capex and capital intensity (annualized), 1Q16-3Q24
- 16. TNOs: Total headcount trends, 1Q16-2Q24
- 17. TNOs: Revenue and RPE trends, 2011-23
- 18. TNOs: Capex and capital intensity, 2011-23 ($ Mn)
- 19. TNOs: Capex and capital intensity, 1Q16-3Q24 ($ Mn)
- 20. TNOs: Revenue and RPE trends, 1Q16-3Q24
- 21. TNOs by total opex, 3Q24
- 22. TNOs by labor costs, 3Q24
- 23. TNOs: Software as % of total capex
- 24. TNOs: Software & spectrum spend
- 25. TNOs: Total M&A, spectrum and capex (excl. spectrum)
- 26. TNOs by total debt: 2011-23
- 27. TNOs by total net debt: 2011-23
- 28. TNOs by long term debt: 2011-23
- 29. TNOs by short term debt: 2011-23
- 30. TNOs by total cash and short term investments ($M): 2011-23
 關稅情勢如何影響美國再生能源成本
 關稅情勢對美國的再生能源成本帶來的影響- 數據
 網路營運商資本支出展望(2024 年第四季版):電信公司持平,但人工智慧驅動的生成式資料中心炒作將推動電信資本支出在 2024 年超過 6,000 億美元,其中 Scalers 預計將引領市場
 網路營運商永續發展策略的全球市場:2024-2029
 Direct-to-Cell 全球市場:2024-2029
 Apps Run The World - 應用市場分析與買家洞察
 虛擬網路營運商世界市場報告(2024 年)
 營運商中立網路營運商(CNNO)-市場回顧(2023年第4季):
 虛擬網路營運商 (VNO) 的全球市場預測(截至 2030 年):按類型、目標客戶、服務、技術、最終用戶和地區進行分析
 虛擬網路營運商市場- 按服務(行動虛擬網路營運商(MVNO)、固定虛擬網路營運商(FVNO))、按產品(預付費、後付費)、按最終用戶(消費者、企業)、2024 - 2032 年預測