


 |
市場調查報告書
商品編碼
1664823
頭飾市場機會、成長動力、產業趨勢分析與 2024 - 2032 年預測Headwear Market Opportunity, Growth Drivers, Industry Trend Analysis, and Forecast 2024 - 2032 |
||||||
2023 年全球頭飾市場規模達到 282 億美元,預計 2024 年至 2032 年期間複合年成長率將達到 6.7%。推動成長的主要趨勢之一是對永續性的日益關注。領先品牌正在採用有機棉和再生布料等環保材料,以滿足對環保產品日益成長的需求。
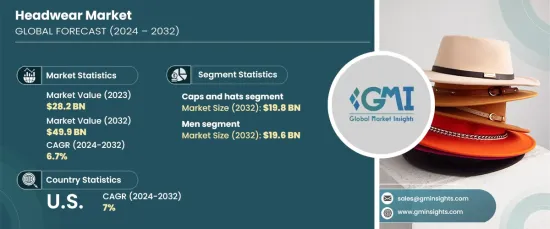
頭飾市場依產品類型分為無簷小帽、頭帶、便帽和帽子等類別。值得注意的是,帽子領域在 2023 年成為市場領導者,創造了 108 億美元的收入。預計該領域將實現顯著成長,到 2032 年將達到 198 億美元。
| 市場範圍 | |
|---|---|
| 起始年份 | 2023 |
| 預測年份 | 2024-2032 |
| 起始值 | 282億美元 |
| 預測值 | 499億美元 |
| 複合年成長率 | 6.7% |
帽子的廣泛流行源自於其多功能性和文化相關性。這些配件具有防曬、護髮、在寒冷氣候下保暖等實用功效。帽子因其舒適性和功能性而特別受到運動和徒步旅行等戶外活動的青睞。
市場也根據最終用戶細分為男性、女性和兒童。 2023 年,男裝市場經歷了顯著成長,為市場貢獻了 109 億美元,預計到 2032 年將達到 196 億美元。此外,跑步和騎自行車等戶外活動也推動了對功能性頭飾的需求。街頭時尚的興起進一步提升了棒球帽、棒球帽和無簷便帽的流行度,使它們成為必備的衣櫃單品和身份的象徵。
2023 年,美國頭飾市場佔有率將達到驚人的 55.5%,預計在預測期內的複合年成長率為 7%。該國的主導地位歸功於其龐大而多樣化的消費群體,在消費者群體中,頭飾既被視為功能性配件,也被視為時尚宣言。棒球、籃球和足球等運動持續推動對球隊帽子和遮陽帽的需求,而知名的美國品牌在塑造市場趨勢方面發揮關鍵作用。名人文化和不斷發展的時尚潮流的影響也鞏固了頭飾作為主流服飾和街頭服飾風格中的重要元素的地位。
目錄
第 1 章:方法論與範圍
- 市場範圍和定義
- 基礎估算與計算
- 預測計算
- 資料來源
- 基本的
- 次要
- 付費來源
- 公共資源
第 2 章:執行摘要
第 3 章:產業洞察
- 產業生態系統分析
- 影響價值鏈的因素
- 利潤率分析
- 中斷
- 未來展望
- 製造商
- 經銷商
- 供應商概況
- 利潤率分析
- 重要新聞及舉措
- 監管格局
- 衝擊力
- 成長動力
- 不斷發展的時尚產業
- 不斷成長的品牌合作夥伴關係和贊助
- 體育運動日益普及
- 產業陷阱與挑戰
- 存在仿冒品
- 季節性需求波動
- 成長動力
- 消費者購買行為分析
- 人口趨勢
- 影響購買決策的因素
- 消費者產品採用
- 首選配銷通路
- 偏好價格範圍
- 成長潛力分析
- 波特的分析
- PESTEL 分析
第4章:競爭格局
- 介紹
- 公司市佔率分析
- 競爭定位矩陣
- 戰略展望矩陣
第 5 章:頭飾市場估計與預測:按產品類型,2021-2032 年
- 主要趨勢
- 毛帽
- 頭帶
- 帽子
- 其他
第 6 章:頭飾市場估計與預測:依定價,2021 年至 2032 年
- 主要趨勢
- 低的
- 中等的
- 高的
第 7 章:頭飾市場估計與預測:按應用,2021 年至 2032 年
- 主要趨勢
- 隨意的
- 醫療的
- 戰術上的
- 工作服
- 其他
第 8 章:頭飾市場估計與預測:按最終用途,2021-2032 年
- 主要趨勢
- 男性
- 女性
- 孩子們
第 9 章:頭飾市場估計與預測:按配銷通路,2021-2032 年
- 主要趨勢
- 線上
- 電子商務
- 公司網站
- 離線
- 專賣店
- 大型零售商店
- 其他(個體店等)
第 10 章:頭飾市場估計與預測:按地區,2021 年至 2032 年
- 主要趨勢
- 北美洲
- 美國
- 加拿大
- 歐洲
- 英國
- 德國
- 法國
- 義大利
- 西班牙
- 俄羅斯
- 亞太地區
- 中國
- 印度
- 日本
- 韓國
- 澳洲
- 拉丁美洲
- 巴西
- 墨西哥
- 中東和非洲
- 南非
- 沙烏地阿拉伯
- 阿拉伯聯合大公國
第 11 章:公司簡介
- Adidas
- Boardriders
- New Balance
- New Era Cap
- Nike
- Pipolaki
- Superdry
- Under Armour
- New Balance
- The Gap
- Callaway Golf
- Superdry
- Carhartt
- Columbia Sportswear
- The Burton Corporation
The Global Headwear Market reached USD 28.2 billion in 2023 and is set to expand at a robust CAGR of 6.7% from 2024 to 2032. Shifting consumer preferences and rapid technological advancements are key factors shaping the industry. Among the top trends propelling growth is the increasing focus on sustainability. Leading brands are embracing eco-friendly materials such as organic cotton and recycled fabrics to meet the rising demand for environmentally conscious products.
The headwear market is segmented by product type into categories like beanies, headbands, and caps and hats. Notably, the caps and hats segment emerged as a market leader in 2023, generating USD 10.8 billion in revenue. This segment is projected to witness remarkable growth, reaching USD 19.8 billion by 2032.
| Market Scope | |
|---|---|
| Start Year | 2023 |
| Forecast Year | 2024-2032 |
| Start Value | $28.2 Billion |
| Forecast Value | $49.9 Billion |
| CAGR | 6.7% |
The widespread popularity of caps and hats stems from their versatility and cultural relevance. These accessories provide practical benefits such as sun protection, hair management, and warmth in colder climates. Caps, in particular, are highly favored for outdoor activities like sports and hiking due to their comfort and functionality.
The market is also segmented by end-user into men, women, and children. The men's segment experienced significant growth in 2023, contributing USD 10.9 billion to the market, and is forecast to reach USD 19.6 billion by 2032. This growth is fueled by the rising demand for men's sportswear and activewear, especially for activities like baseball, football, and golf, which require specialized headgear such as caps and visors. Additionally, outdoor pursuits like running and cycling are driving the demand for functional headwear. The surge in streetwear fashion has further elevated the popularity of baseball caps, snapbacks, and beanies, turning them into essential wardrobe staples and status symbols.
The U.S. headwear market accounted for an impressive 55.5% share in 2023 and is projected to grow at a CAGR of 7% during the forecast period. The country's dominance is attributed to its large and diverse consumer base, where headwear is seen as both a functional accessory and a fashion statement. Sports such as baseball, basketball, and football continue to drive demand for team caps and visors, while prominent U.S. brands play a pivotal role in shaping market trends. The influence of celebrity culture and evolving fashion trends has also cemented headwear as a staple in both mainstream and streetwear styles.
Table of Contents
Chapter 1 Methodology & Scope
- 1.1 Market scope & definitions
- 1.2 Base estimates & calculations
- 1.3 Forecast calculations
- 1.4 Data sources
- 1.4.1 Primary
- 1.4.2 Secondary
- 1.4.2.1 Paid sources
- 1.4.2.2 Public sources
Chapter 2 Executive Summary
- 2.1 Industry 3600 synopsis, 2021-2032
Chapter 3 Industry Insights
- 3.1 Industry ecosystem analysis
- 3.1.1 Factor affecting the value chain
- 3.1.2 Profit margin analysis
- 3.1.3 Disruptions
- 3.1.4 Future outlook
- 3.1.5 Manufacturers
- 3.1.6 Distributors
- 3.2 Supplier Landscape
- 3.3 Profit margin analysis
- 3.4 Key news & initiatives
- 3.5 Regulatory landscape
- 3.6 Impact forces
- 3.6.1 Growth drivers
- 3.6.1.1 Growing fashion industry
- 3.6.1.2 Growing brand partnerships and sponsorships
- 3.6.1.3 Growing popularity of sports
- 3.6.2 Industry pitfalls & challenges
- 3.6.2.1 Presence of counterfeit products
- 3.6.2.2 Seasonal demand fluctuations
- 3.6.1 Growth drivers
- 3.7 Consumer buying behavior analysis
- 3.7.1 Demographic trends
- 3.7.2 Factors affecting buying decision
- 3.7.3 Consumer product adoption
- 3.7.4 Preferred distribution channel
- 3.7.5 Preferred price range
- 3.8 Growth potential analysis
- 3.9 Porter’s analysis
- 3.10 PESTEL analysis
Chapter 4 Competitive Landscape, 2023
- 4.1 Introduction
- 4.2 Company market share analysis
- 4.3 Competitive positioning matrix
- 4.4 Strategic outlook matrix
Chapter 5 Headwear Market Estimates & Forecast, By Product Type, 2021-2032 (USD Billion) (Million Units)
- 5.1 Key trends
- 5.2 Beanies
- 5.3 Headbands
- 5.4 Caps and hats
- 5.5 Others
Chapter 6 Headwear Market Estimates & Forecast, By Pricing, 2021-2032 (USD Billion) (Million Units)
- 6.1 Key trends
- 6.2 Low
- 6.3 Medium
- 6.4 High
Chapter 7 Headwear Market Estimates & Forecast, By Application, 2021-2032 (USD Billion) (Million Units)
- 7.1 Key trends
- 7.2 Casual
- 7.3 Medical
- 7.4 Tactical
- 7.5 Workwear
- 7.6 Others
Chapter 8 Headwear Market Estimates & Forecast, By End Use, 2021-2032 (USD Billion)
- 8.1 Key trends
- 8.2 Men
- 8.3 Women
- 8.4 Kids
Chapter 9 Headwear Market Estimates & Forecast, By Distribution Channel, 2021-2032 (USD Billion)
- 9.1 Key trends
- 9.2 Online
- 9.2.1 E-Commerce
- 9.2.2 Company website
- 9.3 Offline
- 9.3.1 Specialty stores
- 9.3.2 Mega retail stores
- 9.3.3 Others (individual stores, etc.)
Chapter 10 Headwear Market Estimates & Forecast, By Region, 2021-2032 (USD Billion) (Million Units)
- 10.1 Key trends
- 10.2 North America
- 10.2.1 United States
- 10.2.2 Canada
- 10.3 Europe
- 10.3.1 United Kingdom
- 10.3.2 Germany
- 10.3.3 France
- 10.3.4 Italy
- 10.3.5 Spain
- 10.3.6 Russia
- 10.4 Asia Pacific
- 10.4.1 China
- 10.4.2 India
- 10.4.3 Japan
- 10.4.4 South Korea
- 10.4.5 Australia
- 10.5 Latin America
- 10.5.1 Brazil
- 10.5.2 Mexico
- 10.6 Middle East & Africa
- 10.6.1 South Africa
- 10.6.2 Saudi Arabia
- 10.6.3 United Arab Emirates
Chapter 11 Company Profiles
- 11.1 Adidas
- 11.2 Boardriders
- 11.3 New Balance
- 11.4 New Era Cap
- 11.5 Nike
- 11.6 Pipolaki
- 11.7 Superdry
- 11.8 Under Armour
- 11.9 New Balance
- 11.10 The Gap
- 11.11 Callaway Golf
- 11.12 Superdry
- 11.13 Carhartt
- 11.14 Columbia Sportswear
- 11.15 The Burton Corporation
 頭飾市場規模、佔有率和成長分析(按類型、分銷管道、應用、最終用戶和地區)- 2025-2032 年行業預測頭飾市場規模、佔有率和成長分析(按類型、應用、分佈、材料、最終用戶和地區)- 2025-2032 年產業預測冬季頭飾市場規模、佔有率和成長分析(按類型、材料、性別、分銷管道和地區)- 2025-2032 年行業預測
 全球棒球帽市場:按材料、性別、分佈、應用分類 - 2025-2030 年預測
 亞太地區帽子市場預測至 2031 年 - 區域分析 - 按類型、材料、最終用戶和配銷通路
 北美帽子市場預測至 2031 年 - 區域分析 - 按類型、材料、最終用戶和配銷通路
 歐洲帽子市場預測至 2031 年 - 區域分析 - 按類型、材料、最終用戶和配銷通路2024-2032 年按產品類型(毛帽、頭帶、帽子、頭盔等)、應用(休閒、醫療、戰術等)、配銷通路(線上商店、實體門市)和地區分類的頭飾市場報告
 帽子和帽子市場規模和預測、全球和區域佔有率、趨勢和成長機會分析報告範圍:按類型、材料、最終用戶和配銷通路
 中國的帽子市場趨勢