


 |
市場調查報告書
商品編碼
1640316
美國太陽能 -市場佔有率分析、行業趨勢和統計、成長預測(2025-2030)United States Solar Energy - Market Share Analysis, Industry Trends & Statistics, Growth Forecasts (2025 - 2030) |
||||||
價格
※ 本網頁內容可能與最新版本有所差異。詳細情況請與我們聯繫。
簡介目錄
美國太陽能市場預計在預測期內複合年成長率為16.48%
主要亮點
- 從中期來看,太陽能發電成本下降和政府支持措施等因素預計將在預測期內推動美國太陽能市場的發展。
- 另一方面,替代清潔能源來源的日益採用和天然氣消費量的增加預計將阻礙預測期內的市場成長。
- 近年來,鈣鈦礦太陽能電池引起了人們的注意。鈣鈦礦太陽能電池易於製造、效率高,並表現出優異的半導體行為。因此,太陽能電池的發電效率與晶矽太陽能電池相當。因此,太陽能電池製造技術的進步將帶來大規模生產並提供成長機會。
美國太陽能市場趨勢
光伏(PV)預計將主導市場
- 太陽能在美國變得越來越容易獲得和普及。 2022年太陽能發電年增率與前一年同期比較提高8.3%。過去十年,該國太陽能裝機量增加了30倍。 2022年美國總設備容量將達到145,598吉瓦時。
- 美國各地的太陽能市場正在迅速成熟,包括加州、夏威夷州和明尼蘇達州在內的幾個州已經使太陽能發電在經濟上與傳統能源來源相比具有競爭力。
- 太陽能光電(PV)市場受到太陽能投資稅額扣抵(ITC)等強力的聯邦政策、成本迅速下降以及私營和公共部門對清潔電力需求不斷成長的推動。
- 加州擁有美國最高的裝置容量。截至 2022 年第二季度,加州太陽能裝置容量超過 37 億噸。德克薩斯州位居第二,約 15 億噸。 2021 年,美國兩州的太陽能發電量增幅最大。
- 根據太陽能產業協會 (SEIA) 的數據,自 2022 年第一季以來,公共規模的太陽能裝置量增加了 66%。儘管該領域仍面臨供應限制,但隨著組件抵達港口,情況正在改善。今年第一季,光電發電佔新增產能的54%。今年發電量將繼續增加,預計在預測期內將大幅增加。
- 綜上所述,光伏(PV)預計將在預測期內主導美國太陽能市場。
太陽能電池板成本下降和效率提高預計將推動市場發展
- 過去十年,全球整體太陽能發電面板的平均成本下降了近90%。自 2011 年以來,其他組件價格也大幅下降,降低了住宅和公共產業太陽能發電的電費(LCOE)。
- 由於技術經濟和地緣政治因素的綜合作用,太陽能發電面板價格的下降速度預計將略有下降。儘管如此,預計價格在預測期內將繼續下跌。
- 根據美國可再生能源實驗室(NREL)的數據,自2010年以來,美國住宅、商業屋頂和公用事業太陽能發電系統的公共分別下降了64%、69%和82%。
- 由於價格下降,許多住宅和商業消費者選擇屋頂太陽能發電系統來降低能源成本和投資回收時間。同樣,對於大型公共產業計劃營運商來說,較低的面板成本將使他們能夠以較低的價格與消費者簽訂購電協議(PPA)。
- 在過去的十年中,太陽能發電面板的效率穩步提高。隨著新技術和製造能力的出現,這一趨勢預計將在預測期內持續下去。市場上最高效的太陽能板效率高達 22.8%,但大多數基板的效率在 16% 到 18% 之間。
- 截至 2022 年 1 月,SunPower 的結晶太陽能發電面板在市場上所有太陽能板品牌中擁有最高的效率評級。此外,根據太陽能產業協會的數據,美國太陽能的價格趨勢已從 2012 年的每瓦 4.37 美元下降到 2022 年的每瓦 1.66 美元。
- 因此,鑑於上述方面,太陽能發電面板成本下降和效率提高預計將在預測期內推動該國太陽能市場的發展。
美國太陽能產業概況
美國太陽能市場較分散。主要企業(排名不分先後)包括 MA Mortenson Company、First Solar Inc.、NextEra Energy Inc.、SOLV Energy 和 8minergy Renewables LLC。
其他好處
- Excel 格式的市場預測 (ME) 表
- 3 個月分析師支持
目錄
第1章簡介
- 調查範圍
- 市場定義
- 研究場所
第 2 章執行摘要
第3章調查方法
第4章市場概況
- 介紹
- 美國太陽能裝置容量及 2028 年預測(吉瓦 (GW))
- 最新趨勢和發展
- 政府法規和措施
- 市場動態
- 促進因素
- 降低太陽能板的成本並提高效率
- 政府對太陽能發電的支持措施
- 抑制因素
- 採用替代清潔能源來源並增加天然氣消費量
- 促進因素
- 供應鏈分析
- PESTLE分析
第5章市場區隔
- 類型
- 太陽能(光伏)
- 聚光型太陽光電(CSP)
第6章 競爭狀況
- 合併、收購、聯盟和合資企業
- 主要企業策略
- 公司簡介
- MA Mortenson Company
- First Solar Inc.
- NextEra Energy Inc.
- SunPower Corporation
- Renewable Energy Systems Ltd
- Rosendin Electric Inc.
- Hanwha Corporation
- Canadian Solar Inc.
- JinkoSolar Holding Co. Ltd
- SOLV Energy
- 8minute Solar Energy
第7章 市場機會及未來趨勢
- 光電電池製造技術進步
簡介目錄
Product Code: 51293
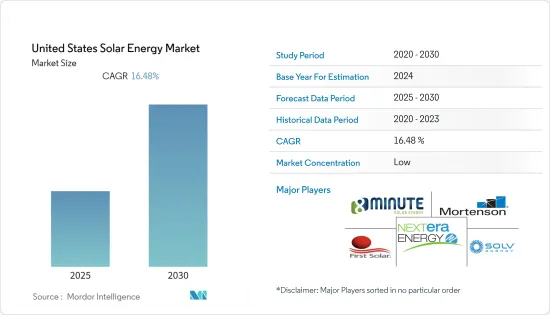
The United States Solar Energy Market is expected to register a CAGR of 16.48% during the forecast period.
Key Highlights
- Over the medium term, factors such as declining solar PV costs and supportive government policies are expected to drive the United States solar energy market during the forecast period.
- On the other hand, increasing adoption of alternative clean energy sources and increasing natural gas consumption are expected to hinder the market's growth during the forecast period.
- Nevertheless, Perovskite-based cells attracted attention in recent years. Perovskite-based PV cells offer high ease of manufacturing, high efficiency, and excellent semiconducting behaviour. Hence, they are comparable to silicon-based solar PV regarding solar-to-electric efficiency. Hence, technological advancements in manufacturing PV cells will likely lead to mass-scale production, offering growth opportunities.
US Solar Energy Market Trends
Solar Photovoltaic (PV) Expected to Dominate the Market
- Solar power has become more accessible and prevalent in the United States. Solar experienced an annual growth rate of 8.3% in 2022 compared to the previous year. Over the last decade, solar installations in the country have grown 30-fold. The total installed capacity in the United States reached 145,598 gigawatt-hours in 2022.
- The solar energy markets are maturing rapidly around the country, and solar electricity is now economically competitive with conventional energy sources in several states, including California, Hawaii, and Minnesota.
- The solar photovoltaic (PV) market is mainly driven by strong federal policies, such as the solar Investment Tax Credit (ITC), rapidly declining costs, and increasing demand for clean electricity across the private and public sectors.
- California has by far the most installed capacity of solar photovoltaic (PV) power of any state in the United States. The Golden State had a total solar power capacity of over 37 gigatonnes as of the second quarter of 2022. Texas came in second with a capacity of about 15 gigatonnes. In 2021, both states in the United States added the most solar PV capacity.
- According to the Solar Energy Industries Association (SEIA), Utility-scale solar installations increased 66% from the first quarter of 2022. The sector is still experiencing supply constraints, but things are improving as module shipments arrive at ports. In the first quarter of this year, photovoltaic solar (PV) accounted for 54% of all new electricity-generating capacity additions. The capacity is expected to increase this year and continue to surge significantly during the forecast period.
- Hence, owing to the points mentioned above, solar photovoltaic (PV) is expected to dominate the US soar energy market during the forecast period.
Declining Costs and Increasing Efficiencies of Solar Panels Expected to Drive the Market
- Since the last decade, the average cost of a solar PV panel has dropped by nearly 90% globally. Prices of other components have also fallen significantly since 2011, reducing the Levelized Cost of Electricity (LCOE) for residential and utility-scale solar PV generation.
- Due to a combination of techno-economic and geopolitical factors, the rate of decline of solar PV panel prices is estimated to reduce slightly. Still, prices will continue to decline during the forecast period.
- According to the United States National Renewable Energy Laboratory (NREL), since 2010, there has been a 64%, 69%, and 82% reduction in the cost of residential, commercial-rooftop, and utility-scale PV systems in the United States, respectively.
- Due to the declining prices, many residential and commercial consumers are opting for rooftop solar PV systems to reduce energy costs and recovery time. Similarly, for large-scale utility project operators, lower panel costs enable them to sign Power Purchase Agreements (PPA) with consumers at a lower price.
- Over the past decade, the efficiency of solar PV panels has risen steadily. With the emergence of new technologies and manufacturing capabilities, this trend is expected to continue during the forecast period. The most efficient solar panels commercially available in the market have efficiency ratings as high as 22.8%, whereas most boards have an efficiency rating ranging from 16% to 18%.
- As of January 2022, SunPower's monocrystalline solar PV panels had the highest efficiency rating of any commercially available solar panel brand. Additionally, according to Solar Energy Industries Association, the U.S. Solar PV Pricing Trend dropped from USD 4.37 per watt in 2012 to USD 1.66 per watt in 2022 for the commercial segment.
- Therefore, owing to the above-mentioned points, declining costs and increasing efficiencies of solar PV panels are expected to drive the country's solar energy market during the forecast period.
US Solar Energy Industry Overview
The United States solar energy market is fragmented. Some of the key players (in no particular order) include M. A. Mortenson Company, First Solar Inc., NextEra Energy Inc., SOLV Energy, and 8minutenergy Renewables LLC.
Additional Benefits:
- The market estimate (ME) sheet in Excel format
- 3 months of analyst support
TABLE OF CONTENTS
1 INTRODUCTION
- 1.1 Scope of the Study
- 1.2 Market Definition
- 1.3 Study Assumptions
2 EXECUTIVE SUMMARY
3 RESEARCH METHODOLOGY
4 MARKET OVERVIEW
- 4.1 Introduction
- 4.2 United States Solar Energy Installed Capacity and Forecast in Gigawatt (GW), till 2028
- 4.3 Recent Trends and Developments
- 4.4 Government Policies and Regulations
- 4.5 Market Dynamics
- 4.5.1 Drivers
- 4.5.1.1 Declining Costs and Increasing Efficiencies of Solar PV Panels
- 4.5.1.2 Supportive Government Policies Towards Solar
- 4.5.2 Restraints
- 4.5.2.1 Increasing Adoption of Alternative Clean Energy Sources and Increasing Natural Gas Consumption
- 4.5.1 Drivers
- 4.6 Supply Chain Analysis
- 4.7 PESTLE Analysis
5 MARKET SEGMENTATION
- 5.1 Type
- 5.1.1 Solar Photovoltaic (PV)
- 5.1.2 Concentrated Solar Power (CSP)
6 COMPETITIVE LANDSCAPE
- 6.1 Mergers, Acquisitions, Collaborations, and Joint Ventures
- 6.2 Strategies Adopted by Key Players
- 6.3 Company Profiles
- 6.3.1 M. A. Mortenson Company
- 6.3.2 First Solar Inc.
- 6.3.3 NextEra Energy Inc.
- 6.3.4 SunPower Corporation
- 6.3.5 Renewable Energy Systems Ltd
- 6.3.6 Rosendin Electric Inc.
- 6.3.7 Hanwha Corporation
- 6.3.8 Canadian Solar Inc.
- 6.3.9 JinkoSolar Holding Co. Ltd
- 6.3.10 SOLV Energy
- 6.3.11 8minute Solar Energy
7 MARKET OPPORTUNITIES AND FUTURE TRENDS
- 7.1 Technological Advancements in Manufacturing PV Cells
02-2729-4219
+886-2-2729-4219
 印尼太陽能:市場佔有率分析、產業趨勢、成長預測(2025-2030)
 印度太陽能 -市場佔有率分析、行業趨勢和統計、成長預測(2025-2030)
 東南亞太陽能 -市場佔有率分析、產業趨勢與統計、成長預測(2025-2030)
 泰國太陽能:市場佔有率分析、產業趨勢、成長預測(2025-2030)
 越南太陽能 -市場佔有率分析、行業趨勢和統計、成長預測(2025-2030)
 全球太陽能光電板市場 - 2024-2031
 太陽能市場規模、佔有率、成長分析、按技術、按光學模組、按應用、按最終用途、按地區 - 按行業預測,2024-2031 年
 太陽能的全球市場:各技術,各用途,各地區,機會,預測,2018年~2032年
 南歐洲的太陽能光伏發電的展望 2024年
 2025-2033 年日本太陽能市場規模、佔有率、趨勢和預測(按部署、應用和地區分類)
▼