


 |
市場調查報告書
商品編碼
1683931
亞太室內 LED 照明:市場佔有率分析、產業趨勢與統計、成長預測(2025-2030 年)Asia Pacific Indoor LED Lighting - Market Share Analysis, Industry Trends & Statistics, Growth Forecasts (2025 - 2030) |
||||||
※ 本網頁內容可能與最新版本有所差異。詳細情況請與我們聯繫。
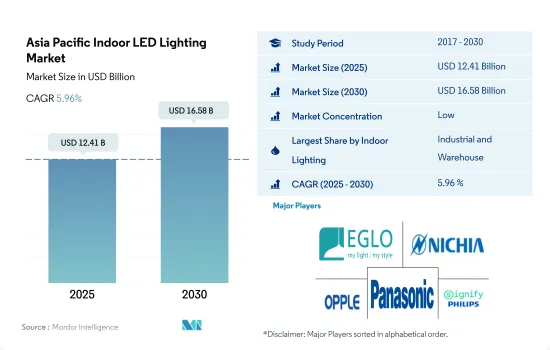
亞太室內 LED 照明市場規模預計在 2025 年為 124.1 億美元,預計到 2030 年將達到 165.8 億美元,預測期內(2025-2030 年)的複合年成長率為 5.96%。
工業和住宅領域的不斷發展推動著市場的成長
- 從金額佔有率來看,2023年工業和倉儲將佔據大部分市場佔有率。截至2022年,中國是世界第二大經濟體。新冠疫情前,中國倉庫空間成本平均為每平方公尺每月 44.3 元人民幣(6.15 美元)。中國對倉庫的需求穩定成長,推高了疫情後的倉庫租金成本。未來五年中國倉儲產業收益預計以每年4.3%的速度成長。
- 同樣,在印度,製造業在疫情之前創造了印度GDP的16-17%,預計將成為成長最快的產業之一。印度工業和倉儲業報告強勁吸收量,約 1,100 萬平方英尺,一線城市佔 77% 的需求。由於這些因素,預計 LED 的廣泛需求將會成長。
- 從成交量佔有率來看,2023年住宅將佔大部分市場。過去三十年,亞洲經歷了較高的都市化。快速都市化推動了經濟成長,但也帶來了巨大的住宅需求,導致住宅飆升。在日本,由於政府為因應人口減少而推出的住宅政策,到2023年,很有可能出現1000萬套的供應過剩。 2023年,家庭數量將達到5,419萬的峰值。這些因素正在推動對LED的需求。
- 政府補貼在引進新住宅發揮了重要作用。在印度,政府已經推出了多項節能計劃。例如,中央政府雄心勃勃的 PMAY(Pradhan Mantri Awas Yojana)計劃旨在到 2022 年在全國範圍內建造 2000 萬套經濟適用住宅。這些因素可能會導致未來一段時間內 LED 的銷售強勁和需求增加。
工業生產和可支配收入的提高推動市場需求
- 以金額佔有率和數量佔有率來看,2023年中國將佔據室內LED照明的大部分佔有率。以金額佔有率來看,2023年,工業和倉儲(I&W)將佔據中國大部分佔有率。 2021年中國工業生產維持穩定。 2021年,中國總產出為48,658億美元,比2020年成長26.04%。 2022年,工業生產成長3.6%。 2023年3月份中國工業生產與前一年同期比較增3.9%。因此,疫情過後工業產量的成長將在未來幾年創造對室內照明的需求。
- 此外,該公司在2021年投資者日上宣布,計劃在未來五年內將物流網路擴展到45至50個物流中心。 2022年,全國出口總額創歷史新高,達42.7兆元(6.3兆美元),比2021年成長7.7%。同時,進口成長了1.1%。隨著物流中心需求的增加,LED照明的需求也預計會增加。
- 印度在金額和數量佔有率上均位居第二。從出貨量佔有率來看,2022年住宅照明將佔最大佔有率。 2022年全國平均家庭規模(包括登記在冊的人)為4.4人,單人家庭和自住房屋數量增加。印度的可支配所得正在增加。 2022 年 3 月,印度的人均收入為 2,301.4 美元,而 2021 年 3 月為 1,971.6 美元。這顯示印度人民的購買力可能低於這些國家。因此,人們將會購買更多的住宅,並且 LED 照明的使用也會增加。
亞太室內 LED 照明市場趨勢
人口成長、人均收入提高和政府補貼推動 LED 市場
- 亞太地區人口約 47 億,佔全球總人口的 59.7%,其中包括中國、印度等世界人口最多的國家,其中 46.3% 的人口居住在城市(2019 年為 21.4 億)。該全部區域生育率接近每名婦女2.1個孩子。東亞地區的家庭規模已降至每名婦女撫養 1.7 人,但南亞地區的家庭規模仍高達每位婦女撫養 2.5 人。此外,該地區五分之二的人口目前居住在都市區。隨著數以百萬計的人口為了尋找就業和更好的機會從農村遷移到城鎮,這一比例在未來幾年將大幅增加。因此,預計都市區家庭數量的增加將推動該地區採用 LED 來滿足照明需求。
- 該地區包括幾個新興國家,儘管受到疫情影響,發展中國家的可支配收入仍在成長。 2022 年 12 月,中國的人均收入達到 12,732.5 美元,而 2021 年 12 月為 12,615.7 美元。 2022 年 3 月,印度的人均收入為 2,301.4 美元,而 2021 年 3 月為 1,971.6 美元。 2022 年 12 月,日本的人均收入達到 33,911.2 美元,而 2021 年 12 月為 39,916.1 美元。這將提高個人的消費能力,從而將更多資金投入新的住宅空間。對於家庭用戶,2012年中國政府提供了22億元人民幣的補助用於使用節能燈泡和LED燈。日本政府於2010年4月推出生態積分計劃,用戶可依照2:1的生態積分比例使用其生態積分購買LED燈,預計將進一步增加LED照明的需求。
基礎設施建設努力和節能照明的廣泛採用將推動 LED 照明的成長
- 在亞太地區,工業部門預計將成為2021年最大的能源消費量,其次是住宅和商業部門。此外,亞太地區以其正在進行和即將推出的基礎設施計劃而聞名,尤其是智慧城市計劃,這些計劃可以產生對建築營運的需求。工業和商業部門也在迅速擴張。東京和印度計劃在 2022 年在全球範圍內就基礎設施開發計劃展開合作。在尼泊爾等兩國已有計劃啟動的國家,新德里和東京可以充分利用他們在計劃計畫規劃、設計和實施方面的合作。由於這些發展,該地區對 LED 的需求預計會增加。
- 商業部門的電力需求往往在11至13小時左右。工業部門的用電量在一天和一年中往往更加穩定。住宅領域的電力需求通常在晚上亮燈時最高,平均照明時間約為六到八小時。此外,科欽智慧使命有限公司(CSML)正在準備一個價值 4 億印度盧比的計劃,於 2022 年在印度科欽安裝 LED 照明,確保車輛和行人的安全。這些項目正在刺激LED產業的擴張。
- 亞太國家正在透過使用LED來推動節能。例如,2018年1月,澳洲政府決定在澳洲和紐西蘭引進符合歐盟要求的LED燈泡最低標準,以進一步完善照明能源效率法規,逐步淘汰低效率的滷素燈。此舉將減少該國的電力使用並推廣使用 LED 照明。
亞太室內 LED 照明產業概況
亞太室內LED照明市場較為分散,五大主要企業佔了26.26%的市場。市場的主要企業是:EGLO Leuchten GmbH、Nichia Corporation、OPPLE Lighting、Panasonic Holdings Corporation和Signify(飛利浦)(按字母順序排列)。
其他福利
- Excel 格式的市場預測 (ME) 表
- 3 個月的分析師支持
目錄
第 1 章執行摘要和主要發現
第2章 報告要約
第 3 章 簡介
- 研究假設和市場定義
- 研究範圍
- 調查方法
第4章 產業主要趨勢
- 人口
- 人均收入
- LED進口總量
- 照明電力消耗量
- 家庭數量
- LED滲透率
- 園藝區
- 法律規範
- 中國
- 印度
- 日本
- 價值鏈與通路分析
第5章 市場區隔
- 室內照明
- 農業照明
- 商業照明
- 辦公室
- 零售
- 其他
- 工業/倉庫
- 住宅
- 國家
- 中國
- 印度
- 日本
- 其他亞太地區
第6章 競爭格局
- 主要策略趨勢
- 市場佔有率分析
- 業務狀況
- 公司簡介(包括全球概況、市場層級概況、主要業務部門、財務狀況、員工人數、關鍵資訊、市場排名、市場佔有率、產品和服務、最新發展分析)
- ACUITY BRANDS, INC.
- ams-OSRAM AG
- EGLO Leuchten GmbH
- Endo Lighting Corporation
- Guangdong PAK Corporation Co.,Ltd.
- Nichia Corporation
- OPPLE Lighting Co., Ltd
- Panasonic Holdings Corporation
- Signify(Philips)
- Toshiba Corporation
第7章:執行長的關鍵策略問題
第 8 章 附錄
- 世界概況
- 概述
- 五力分析框架
- 全球價值鏈分析
- 市場動態(DRO)
- 資訊來源和進一步閱讀
- 圖片列表
- 關鍵見解
- 資料包
- 詞彙表
The Asia Pacific Indoor LED Lighting Market size is estimated at 12.41 billion USD in 2025, and is expected to reach 16.58 billion USD by 2030, growing at a CAGR of 5.96% during the forecast period (2025-2030).
Increasing development in the industrial sector and residential sector drives the market growth
- In terms of value share, in 2023, industrial and warehouse accounts for most of the share. China is the second-largest economy in the world as of 2022. Warehouse space in China cost an average of CNY 44.3 (USD 6.15) per square meter per month during pre-COVID-19. In China, there has been a steady rise in the demand for warehouses, raising the cost of renting them post-pandemic. Revenue for the storage industry in China is expected to increase at an annualized 4.3% over the five years.
- Similarly, in India, manufacturing generated 16-17% of India's GDP before the pandemic and is expected to be one of the fastest-growing sectors. India's industrial and warehousing sector reported a nearly 11 million square feet robust absorption, with tier-I cities driving 77% of the demand. Such factors are expected to increase the LED penetration demand.
- In terms of volume share, in 2023, residential accounts for most of the share. Over the past three decades, Asia experienced a high urbanization rate. While rapid urbanization helped to fuel economic growth, it has led to major demand for housing, resulting in high housing prices. Japan will likely see an excess supply of 10 million dwelling units in 2023, partly due to government housing policy with a shrinking population. The number of households will peak at 54.19 million in 2023. Such a factor caters to a major LED demand.
- Government subsidy plays a major role in the adoption of new housing. In India, the government has introduced several energy-saving programs. For example, the central government's ambitious Pradhan Mantri Awas Yojana (PMAY) program aims to build 20 million affordable metropolitan housing units nationwide by 2022. Such factors might lead to major sales, leading to more LED demand in the coming period.
Growing number of industrial production and disposable income drive the demand for market
- In terms of value and volume share, China stood with the majority of the share in indoor LED lighting in 2023. In terms of value share, in 2023, industrial and warehouse (I&W) accounted for the majority of the share in China. China sustained its industrial production in 2021. In 2021, China produced a total of USD 4865.8 billion, an increase of 26.04% compared to 2020. In 2022, industrial production grew by 3.6%. China's industrial production increased by 3.9% year-on-year in March 2023. Thus, the growing industrial production post-pandemic is creating demand for indoor lighting in the coming years.
- In addition, during its Investor Day in 2021, the company announced that it intends to expand its logistics network over the following five years to 45 to 50 distribution centers. The country's total exports hit an all-time high in 2022, accounting for CNY 42.07 trillion (USD 6.3 trillion), up 7.7% from 2021. On the other hand, imports increased by 1.1%. With the increasing demand for distribution centers, the LED demand is expected to rise.
- India stands at the second spot in terms of value and volume share. Regarding volume share, residential lighting had the largest share in 2022. In 2022, the average household size, including all registrants nationwide, was 4.4, leading to an increase in private households and homeowners. In India, disposable income is increasing. India's per capita income reached USD 2301.4 in March 2022, compared to USD 1971.6 in March 2021. This suggests that people in India may have lower purchasing power than those countries. As a result, more homes will be purchased and the use of LED lighting will increase.
Asia Pacific Indoor LED Lighting Market Trends
The LED market is driven by increasing population, rising per capita income, and government subsidies
- Asia-Pacific is home to 59.7% of the world's population, which is around 4.7 billion people, and includes the world's most populous countries, such as China and India, and 46.3 % of the population is urban (2.14 billion people in 2019). The region's overall fertility rate is close to 2.1 births per woman. Family size has decreased to 1.7 children per woman in East Asia while maintaining a high of 2.5 children per woman in South Asia. Further, two out of every five people in the region currently live in urban areas. This ratio will increase significantly in the coming as millions move from the countryside to towns and cities in search of employment and better opportunities. Thus, the increase in the number of households in urban areas is expected to create more LED penetration for the need for illumination in the region.
- This region includes several developing nations, and despite the pandemic, disposable income is growing in developing countries. China's per capita income reached USD 12,732.5 in December 2022, compared to USD 12,615.7 in December 2021. India's per capita income reached USD 2301.4 in March 2022, compared to USD 1971.6 in March 2021. Japan's per capita income reached USD 33,911.2 in December 2022, compared to USD 39,916.1 in December 2021. Such instances result in the rising spending power of individuals and affording more money for new residential spaces. For households, in 2012, the Chinese government offered a subsidy of CNY 2.2 billion for the use of energy-conserving light bulbs and LEDs. The Japanese government introduced a consumer rebate program known as the "Eco-Point" program in April 2010. Users may use their Eco-Points to purchase LED lamps at a 2 to 1 Eco-point ratio, which is further expected to surge the demand for LED lighting.
Initiatives related to infrastructure development and increasing use of energy-efficient lighting to drive the growth of LED lights
- The industrial sector in the Asia-Pacific had planned to have the biggest energy consumption in 2021, followed by the residential and commercial sectors. Additionally, Asia-Pacific is known for its ongoing and future infrastructure initiatives, notably smart city projects, which could generate demand for building operations. The industrial and commercial sector is also expanding quickly. Tokyo and India will collaborate on global infrastructure development projects in 2022. In countries like Nepal, where both countries are already working on projects, joint planning, design, and implementation of infrastructure projects might help New Delhi and Tokyo maximize their impact. The demand for LED in the area is anticipated to rise as a result of these developments.
- Electricity demand in the commercial sector tends to be around 11-13 hours. Electricity use in the industrial sector tends not to fluctuate through the day or year. Electricity demand in the residential sector tends to be highest in the evenings, when lights are turned on, and the average lighting time varies for about 6 to 8 hours. Additionally, Cochin Smart Mission Limited (CSML) is preparing an INR 40 crore project to install LED lighting in Kochi, India, to guarantee the security of vehicles and pedestrians in 2022. These programs fuel the expansion of the LED sector.
- Countries in Asia-Pacific have expedited energy savings through the use of LEDs. For instance, the Australian Government decided in January 2018 to introduce minimum LED bulb standards in Australia and New Zealand that comply with EU requirements and phase out inefficient halogen lamps as a way to improve lighting energy efficiency regulation further. The effort will reduce the nation's electricity use and encourage the usage of LED lighting.
Asia Pacific Indoor LED Lighting Industry Overview
The Asia Pacific Indoor LED Lighting Market is fragmented, with the top five companies occupying 26.26%. The major players in this market are EGLO Leuchten GmbH, Nichia Corporation, OPPLE Lighting Co., Ltd, Panasonic Holdings Corporation and Signify (Philips) (sorted alphabetically).
Additional Benefits:
- The market estimate (ME) sheet in Excel format
- 3 months of analyst support
TABLE OF CONTENTS
1 EXECUTIVE SUMMARY & KEY FINDINGS
2 REPORT OFFERS
3 INTRODUCTION
- 3.1 Study Assumptions & Market Definition
- 3.2 Scope of the Study
- 3.3 Research Methodology
4 KEY INDUSTRY TRENDS
- 4.1 Population
- 4.2 Per Capita Income
- 4.3 Total Import Of Leds
- 4.4 Lighting Electricity Consumption
- 4.5 # Of Households
- 4.6 Led Penetration
- 4.7 Horticulture Area
- 4.8 Regulatory Framework
- 4.8.1 China
- 4.8.2 India
- 4.8.3 Japan
- 4.9 Value Chain & Distribution Channel Analysis
5 MARKET SEGMENTATION (includes market size in Value in USD and Volume, Forecasts up to 2030 and analysis of growth prospects)
- 5.1 Indoor Lighting
- 5.1.1 Agricultural Lighting
- 5.1.2 Commercial
- 5.1.2.1 Office
- 5.1.2.2 Retail
- 5.1.2.3 Others
- 5.1.3 Industrial and Warehouse
- 5.1.4 Residential
- 5.2 Country
- 5.2.1 China
- 5.2.2 India
- 5.2.3 Japan
- 5.2.4 Rest of Asia-Pacific
6 COMPETITIVE LANDSCAPE
- 6.1 Key Strategic Moves
- 6.2 Market Share Analysis
- 6.3 Company Landscape
- 6.4 Company Profiles (includes Global level Overview, Market level overview, Core Business Segments, Financials, Headcount, Key Information, Market Rank, Market Share, Products and Services, and analysis of Recent Developments)
- 6.4.1 ACUITY BRANDS, INC.
- 6.4.2 ams-OSRAM AG
- 6.4.3 EGLO Leuchten GmbH
- 6.4.4 Endo Lighting Corporation
- 6.4.5 Guangdong PAK Corporation Co.,Ltd.
- 6.4.6 Nichia Corporation
- 6.4.7 OPPLE Lighting Co., Ltd
- 6.4.8 Panasonic Holdings Corporation
- 6.4.9 Signify (Philips)
- 6.4.10 Toshiba Corporation
7 KEY STRATEGIC QUESTIONS FOR LED CEOS
8 APPENDIX
- 8.1 Global Overview
- 8.1.1 Overview
- 8.1.2 Porter's Five Forces Framework
- 8.1.3 Global Value Chain Analysis
- 8.1.4 Market Dynamics (DROs)
- 8.2 Sources & References
- 8.3 List of Tables & Figures
- 8.4 Primary Insights
- 8.5 Data Pack
- 8.6 Glossary of Terms
 中國LED照明:市場佔有率分析、產業趨勢與統計、成長預測(2025-2030年)中國室內 LED 照明:市場佔有率分析、產業趨勢與統計、成長預測(2025-2030 年)中東和非洲室內 LED 照明:市場佔有率分析、行業趨勢和統計、成長預測(2025-2030 年)北美 LED 照明:市場佔有率分析、行業趨勢和成長預測(2025-2030 年)北美室內 LED 照明:市場佔有率分析、行業趨勢和統計、成長預測(2025-2030 年)南美LED照明:市場佔有率分析、產業趨勢與成長預測(2025-2030年)南美室內 LED 照明:市場佔有率分析、行業趨勢和統計、成長預測(2025-2030 年)印度室內 LED 照明:市場佔有率分析、行業趨勢和統計、成長預測(2025-2030 年)室內 LED 照明:市場佔有率分析、行業趨勢和統計、成長預測(2025-2030 年)德國LED照明:市場佔有率分析、產業趨勢與成長預測(2025-2030年)